Sample Category Title
GBPUSD Elliott Wave: Forecasting the Rally from the Intraday Equal Legs
Hello traders. In this technical article we’re going to look at the Elliott Wave charts of GBPUSD forex pair published in members area of the website. The pair recently delivered an intraday pullback and, as anticipated, attracted buyers precisely at the Equal Legs area. In the analysis below, we’ll break down the Elliott Wave count and highlight the key target zones for the next leg higher.
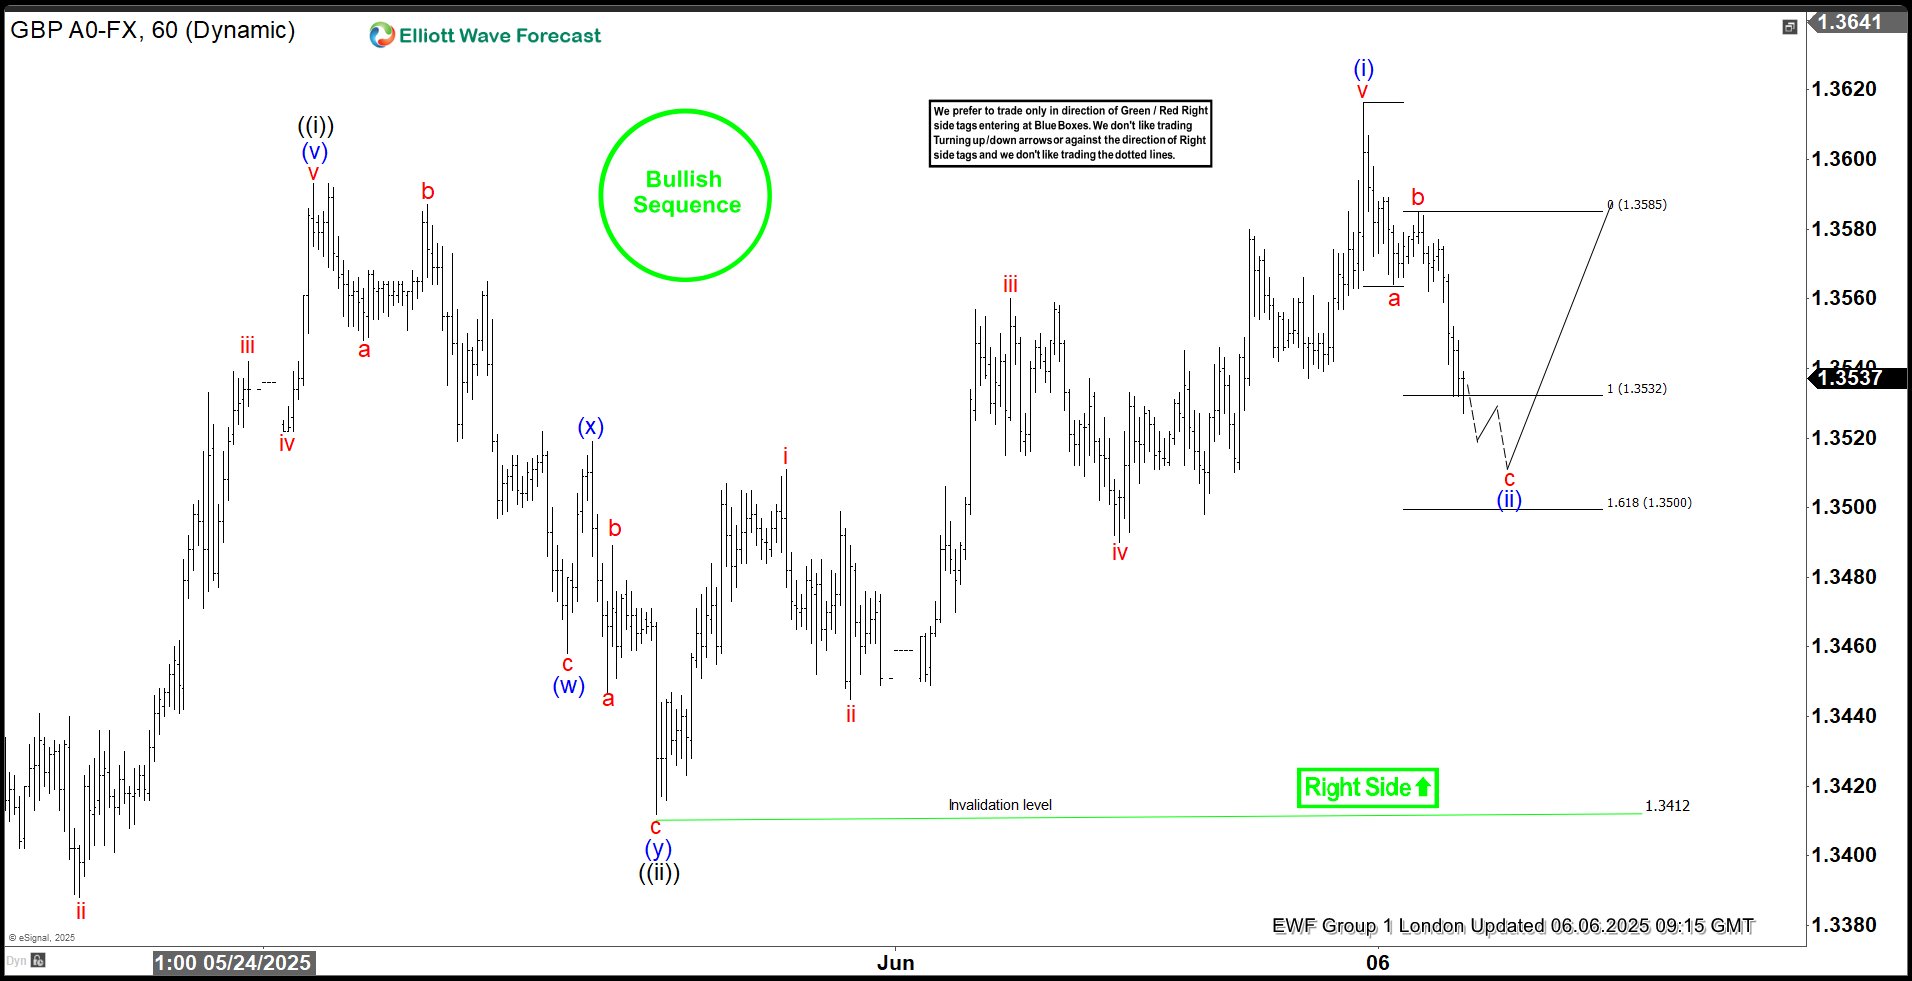
GBPUSD Elliott Wave 1 Hour Chart 06.06.2025
GBP/USD is currently forming an intraday three-wave pullback from recent highs. Our members understand how to identify potential reversal zones using the Equal Legs technique: a related to b red . So, in this case, the ideal support area lies between 1.3532 and 1.3500. While additional near-term downside remains possible, as long as price stays within this zone, we expect buyers to emerge and continuation of the bullish trend to resume.
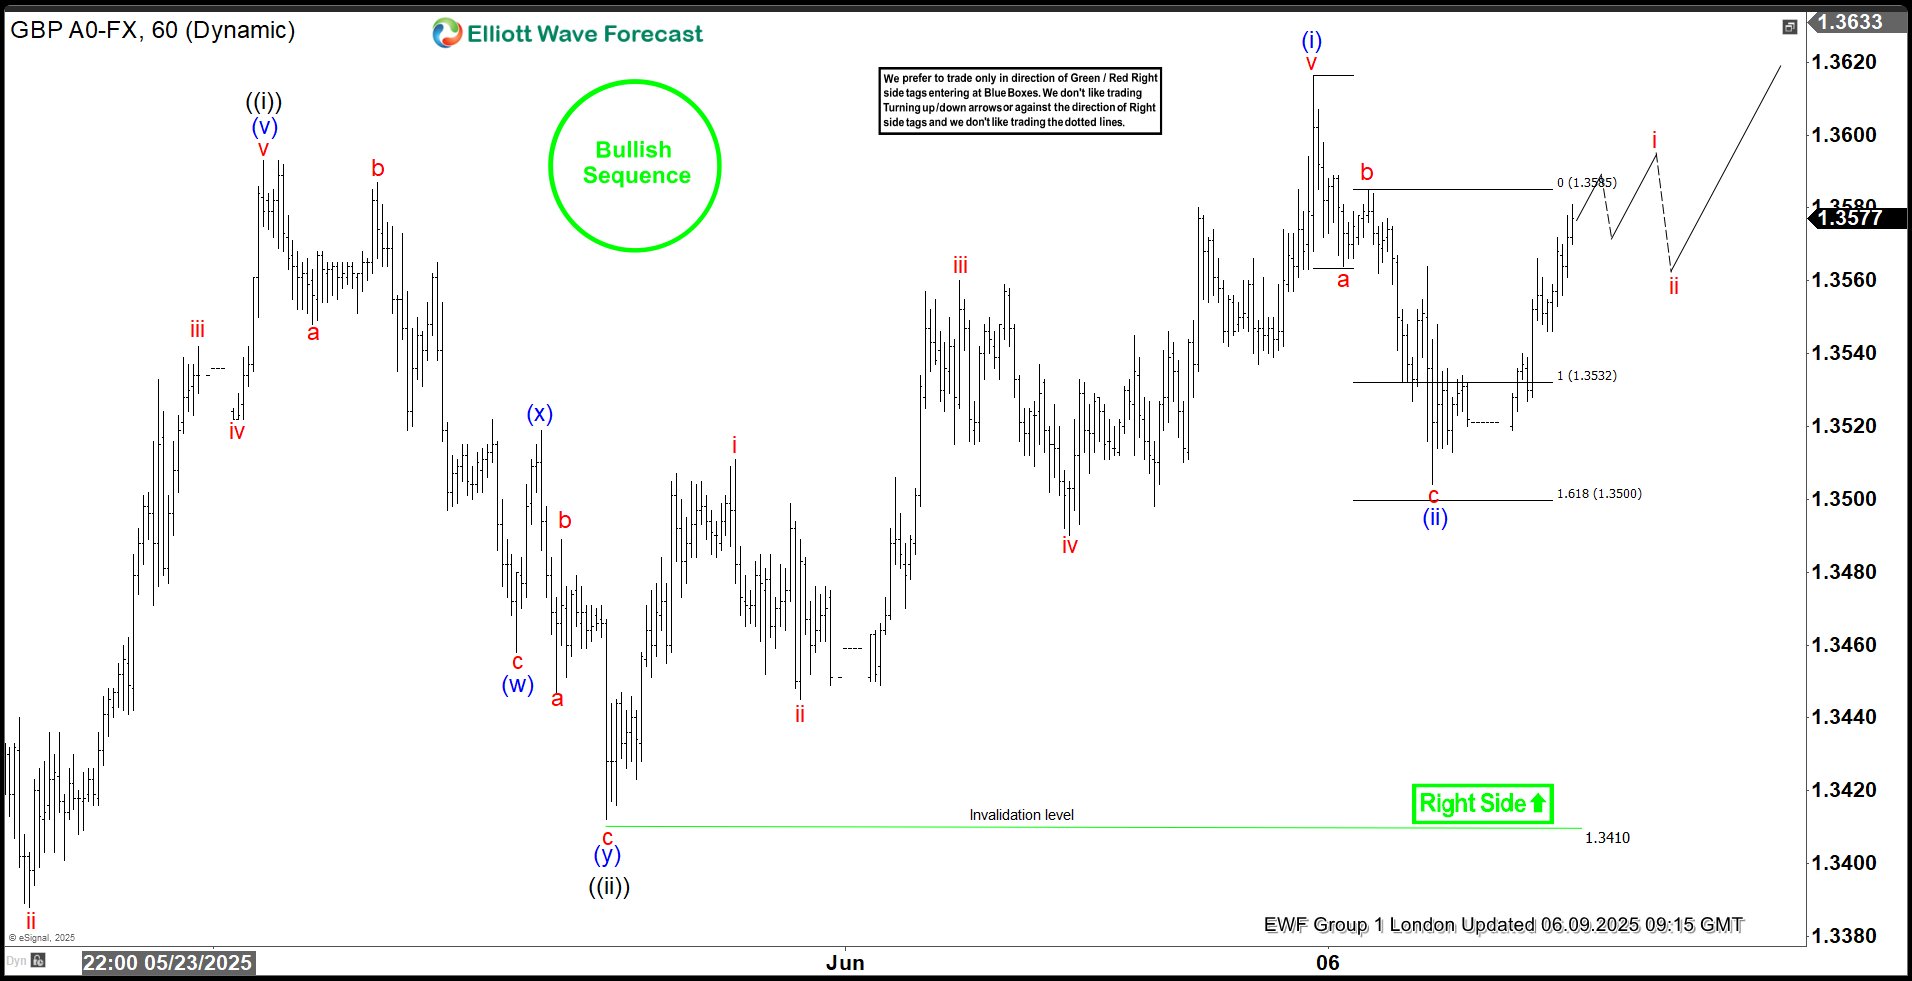
GBPUSD Elliott Wave 1 Hour Chart 06.06.2025
The pair has found buyers in the marked area, as expected. GBPUSD has since staged a solid rally from this support area. At this point, we do not recommend initiating short positions. The key short-term support level to watch is 1.35069—maintaining price above this level supports the case for the next upward leg. While above the mentioned low, the pair can see extension toward 1.3708 area. To confirm the continuation of the rally, we want to see a decisive break above the previous (i) blue peak.
EURUSD Elliott Wave Outlook: Rally Unfolding from Equal Legs Support
Hello fellow traders. In this technical article we’re going to look at the Elliott Wave charts of EURUSD forex pair published in members area of the website. As our members know, we are enjoying profitss in long positions the pair . The pair has recently given us intraday pull back and found buyers again precisely at the equal legs area as we expected. In the following text, we’ll explain the Elliott Wave count and present target areas.
EURUSD Elliott Wave 1 Hour Chart 06.06.2025
EURUSD is currently developing an intraday three-wave pullback from recent highs. Our members know how to identify potential reversal zones using the Equal Legs technique — in this case, the ideal support area comes in at 1.13912–1.13505. The pair can see more downside in near term. As long as price holds within this region, we expect buyers to step in and the broader rally to resume.
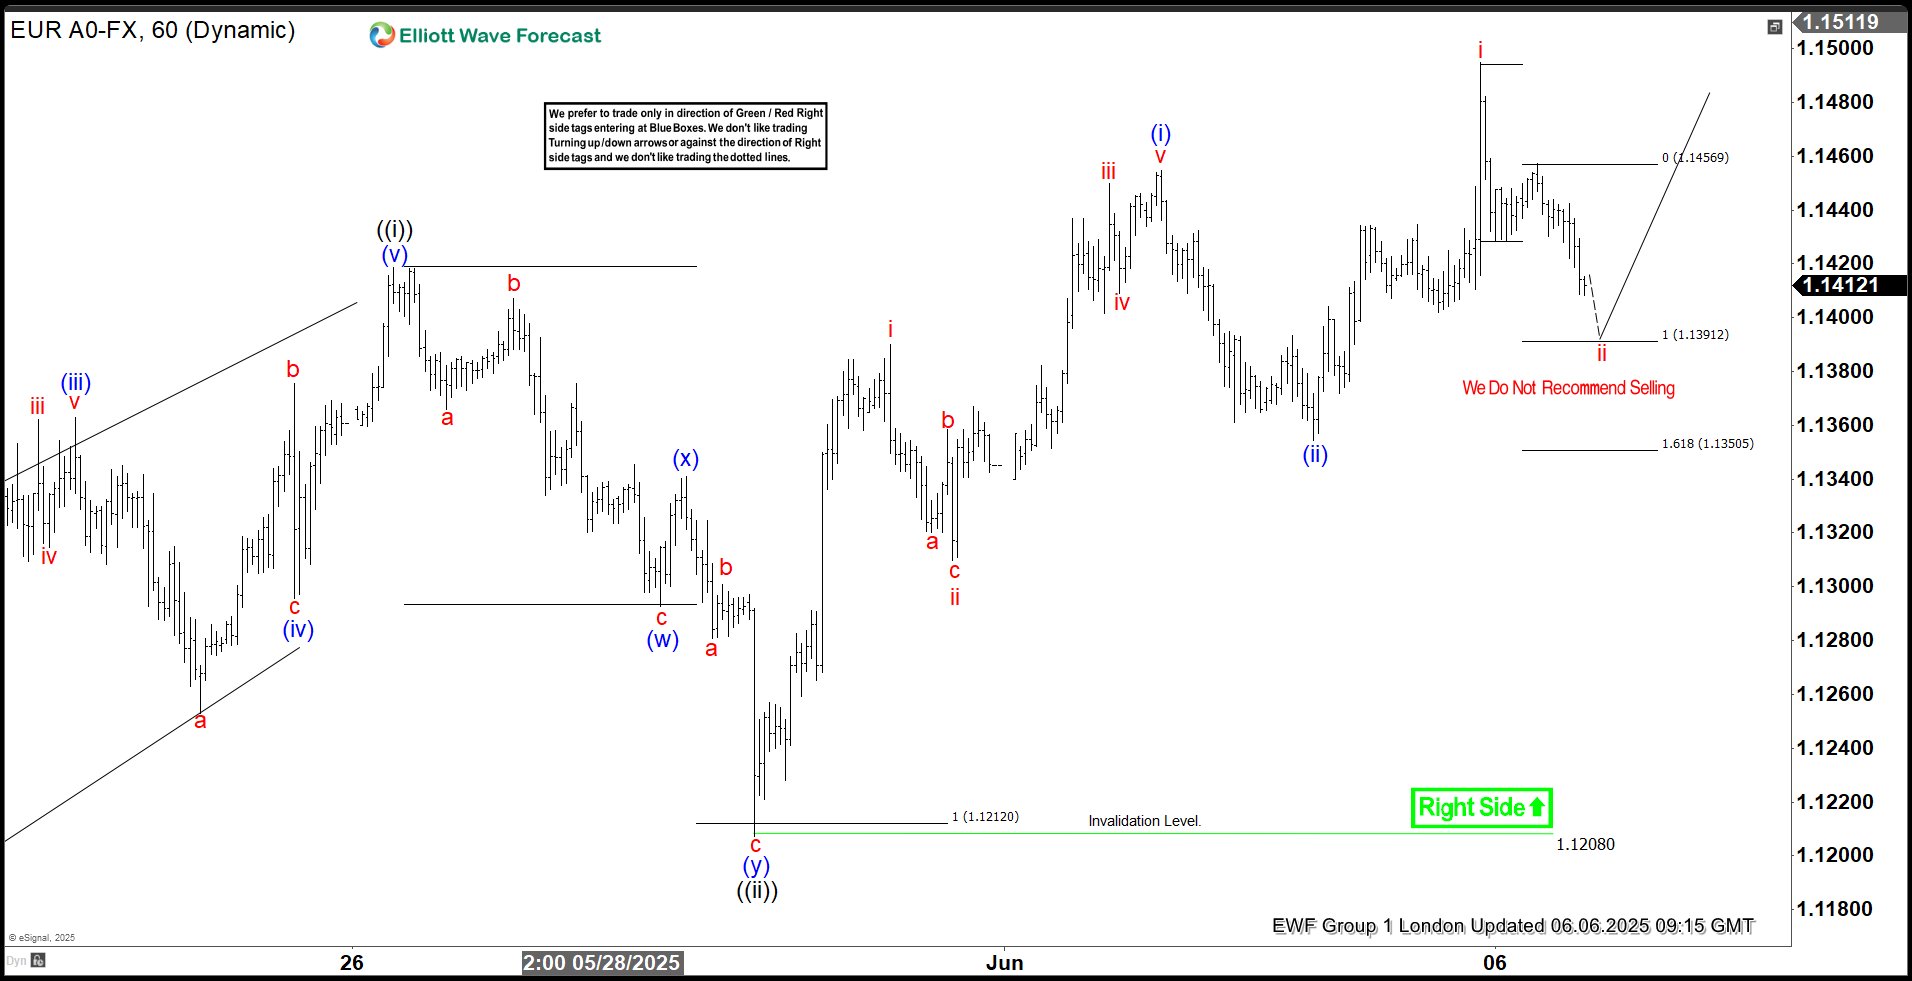
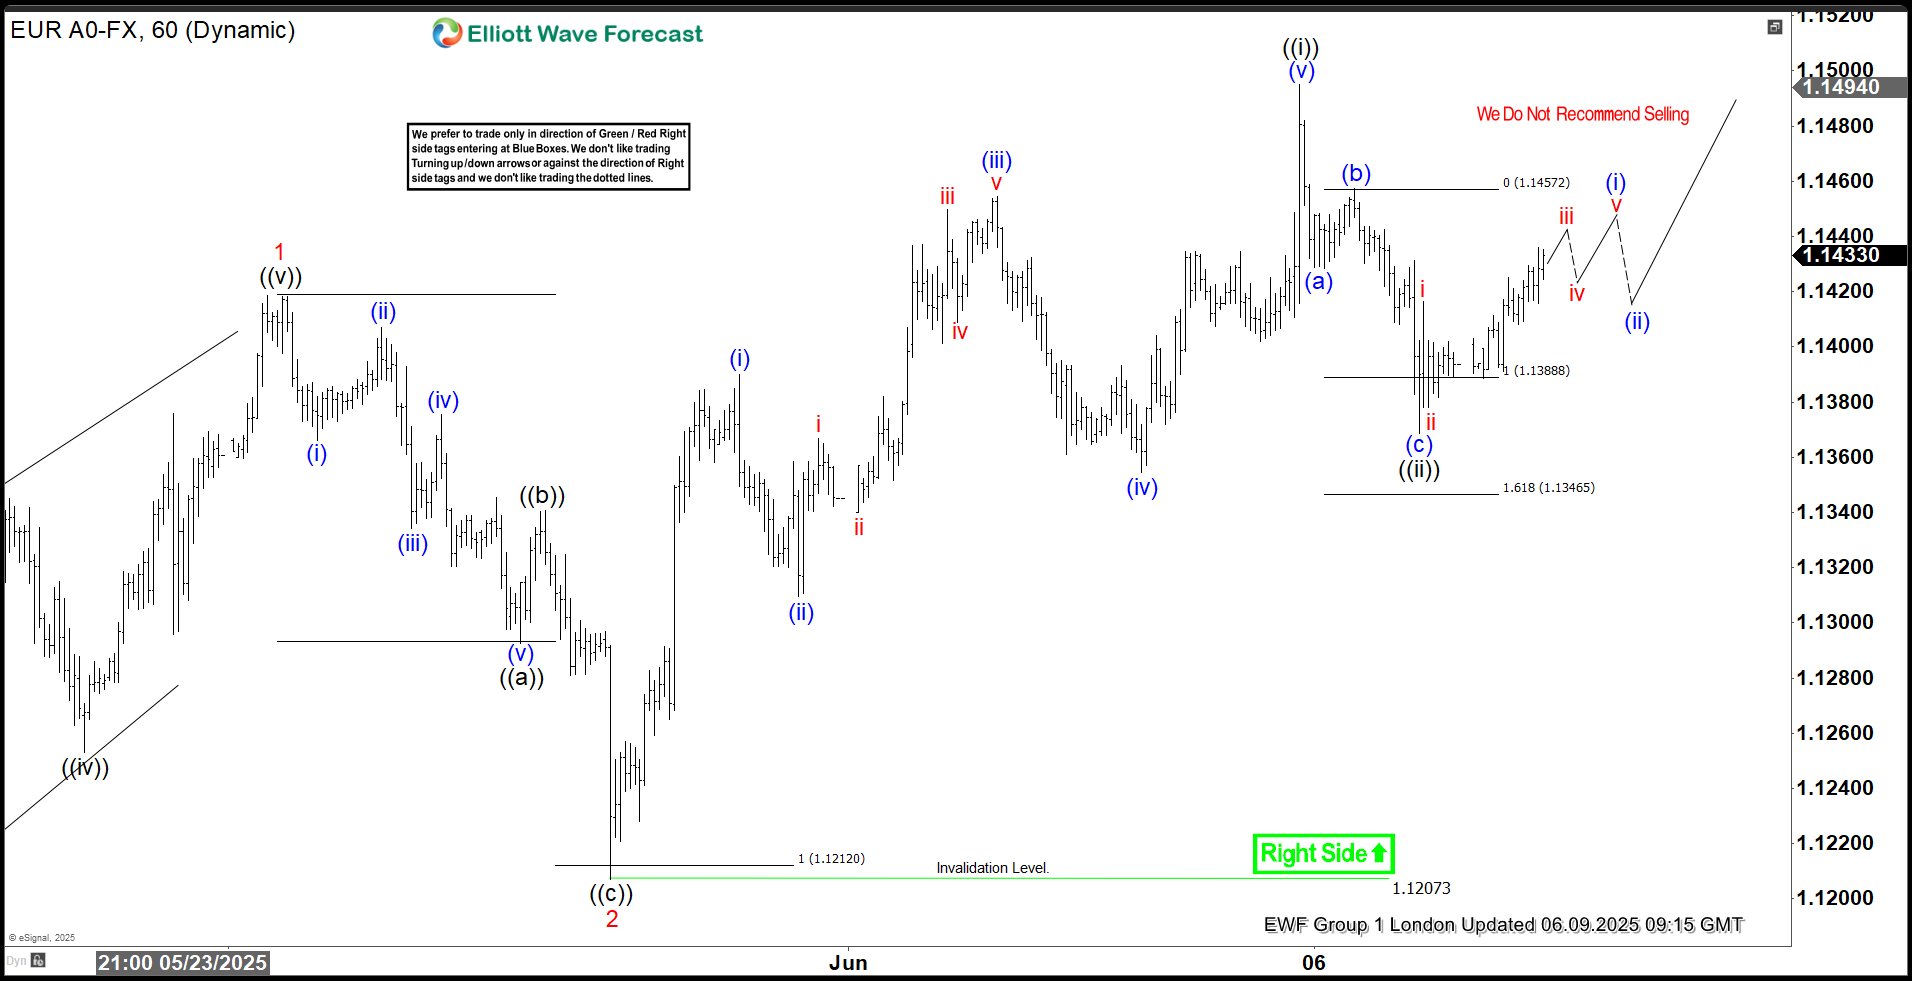
EURUSD Elliott Wave 1 Hour Chart 06.06.2025
The pair has reached our target area and found buyers as expected. EURUSD made decent rally from the buyers zone. We do not recommend selling the pair at this stage. 1.13725 is the key low for proposed short term view. While above that low, next leg up can be in progress. We would like to see break above ((i)) peak to confirm next leg up is in progress, targeting 1.1657 area.
XAU/USD: Gold Bounces from Key Support Zone, Looks for Fresh Direction Signals
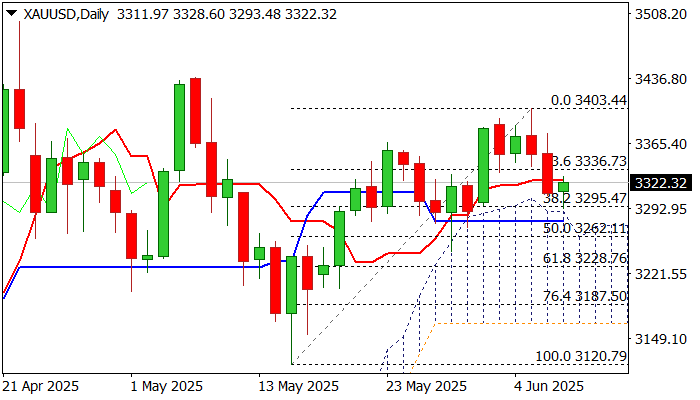
Gold price edged higher from new over one-week low in early European trading, after it cracked strong supports at $3300 zone (psychological/daily Kijun-sen / daily cloud top), but faced headwinds here.
Bouncing after heavy losses (gold price was down around $100 in past two sessions) is a logical reaction, but the length of the recovery is under big question mark, due to mixed signals from both technical and geopolitical factors.
Daily studies show continuous weakening of positive momentum, but daily cloud (top at $3280 and reinforced by daily Kijun-sen) is expected to continue underpinning the action as long as the price holds above this zone.
On the other hand, situation on macroeconomic and geopolitical front is mixed, as today’s US – China trade talks boost optimism that the major trade war could be avoided and negative consequences significantly reduced, but further escalation in war in Ukraine and persistently heated situation in Gaza, threaten to offset positive impact.
Fresh recovery tested initial barrier at $3324 (daily Tenkan-sen), with sustained break here seen as minimum requirement to keep positive bias for further gains and test of upper pivot at $3348 (50% retracement of $3403/$3293 bear-leg).
Otherwise, the downside would remain very vulnerable, with violation of $3300/$3280 zone would further weaken near-term structure and risk drop towards $3245 (May 29 higher low) and $3200 (psychological).
Res: 3335; 3348; 3361; 3377.
Sup: 3295; 3280; 3245; 3200.
US Dollar Faces Pivotal Week: Politics and Economic Data in Focus
EUR/USD opened the week steady, trading near 1.1418, as markets brace for a series of key economic reports and political developments.
Markets eye trade talks and macro indicators
Investor sentiment remains cautiously optimistic ahead of the US-China trade meeting, set to take place in London today, following President Donald Trump’s announcement last week. Hopes for progress in trade negotiations are helping stabilise the market mood.
On the economic front, a heavy data calendar lies ahead. Markets are closely watching the release of several US macroeconomic indicators:
- Consumer Price Index (CPI) on Wednesday
- Producer Price Index (PPI) and the University of Michigan Consumer Sentiment Index on Friday
These reports are expected to provide clearer insights into the effects of tariffs on inflation and the overall direction of the US economy.
Last Friday, the US dollar gained strength following an upbeat employment report for May, which showed stronger-than-expected job growth. However, the broader picture remains mixed, with recent readings on private employment, unemployment claims, and the services PMI pointing to ongoing economic fragility.
Technical analysis of EUR/USD
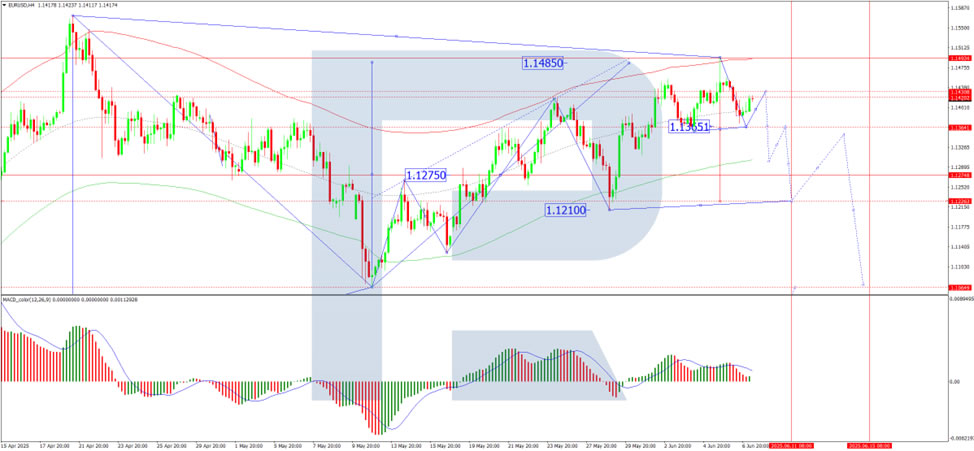
On the H4 chart, EUR/USD has reached the growth wave target at 1.1494. A correction phase is currently unfolding, with the first target at 1.1365. After touching this level, a rebound to 1.1438 is possible. This could be followed by a new downward wave towards 1.1275, with a longer-term prospect of a decline to 1.1210. The MACD indicator supports this scenario, with its signal line above zero but pointing sharply downwards, indicating a shift towards bearish momentum.
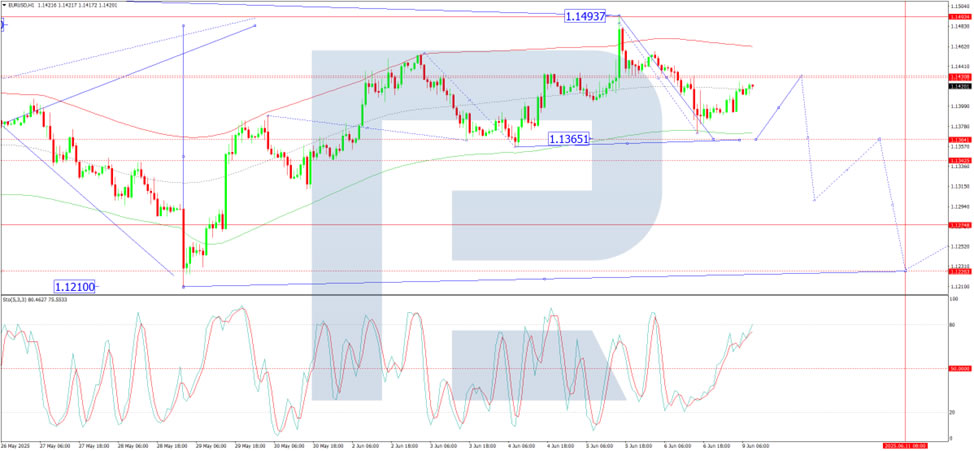
On the H1 chart, the pair has completed the first downward wave, reaching a local target at 1.1372. A corrective bounce to 1.1438 (a test from below) is now on the radar. This move will determine whether EUR/USD resumes its upward correction or extends its decline.
Conclusion
EUR/USD is entering a critical week, with US economic data and trade talks in the spotlight. A corrective move to 1.1438 appears likely in the short term, but further downside towards 1.1365, 1.1275, and 1.1210 remains on the table depending on data outcomes and broader risk sentiment. Technical indicators suggest a shift in momentum, with consolidation and correction likely before the next directional move.
ECB Kazimir: Likely at end of cuts, eyes summer data for fine-tuning
Slovak ECB Governing Council member Peter Kazimir signaled a possible end to the current easing cycle, writing in an opinion piece today that "we're nearly done with, if not already at the end of, the easing cycle."
While acknowledging the potential for weaker-than-expected economic growth in the eurozone, Kazimir emphasized the importance of staying focused on inflation to, which he warned could surprise to the upside.
Looking ahead, Kazimir stressed the need for flexibility, noting that "incoming data throughout the summer will provide a clearer picture and guide our decisions on whether further fine-tuning is needed."
GBPUSD Edges Higher, EURGBP Hits Support
GBP/USD is attempting a fresh increase above the 1.3500 resistance. EUR/GBP declined steadily below the 0.8440 and 0.8430 support levels.
Important Takeaways for GBP/USD and EUR/GBP Analysis Today
- The British Pound is attempting a fresh increase above 1.3515.
- There was a break above a key bearish trend line with resistance at 1.3535 on the hourly chart of GBP/USD at FXOpen.
- EUR/GBP is trading in a bearish zone below the 0.8450 pivot level.
- There is a connecting bullish trend line forming with support at 0.8415 on the hourly chart at FXOpen.
GBP/USD Technical Analysis
On the hourly chart of GBP/USD at FXOpen, the pair declined after it failed to clear the 1.3615 resistance. The British Pound even traded below the 1.3575 support against the US Dollar.
Finally, the pair tested the 1.3500 zone and is currently attempting a fresh increase. The bulls were able to push the pair above the 50-hour simple moving average and 1.3540. There was a break above a key bearish trend line with resistance at 1.3535.
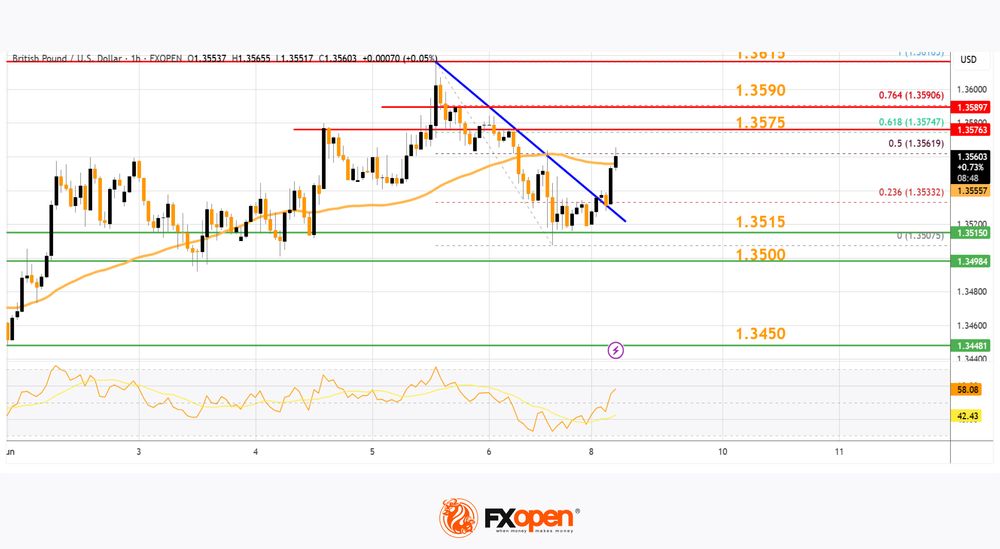
The pair tested the 50% Fib retracement level of the downward move from the 1.3616 swing high to the 1.3507 low. It is now showing positive signs above 1.3540.
On the upside, the GBP/USD chart indicates that the pair is facing resistance near 1.3575 and the 61.8% Fib retracement level of the downward move from the 1.3616 swing high to the 1.3507 low.
The next major resistance is near 1.3590. A close above the 1.3590 resistance zone could open the doors for a move toward 1.3615. Any more gains might send GBP/USD toward 1.3650.
On the downside, immediate support is near the 1.3515. If there is a downside break below 1.3515, the pair could accelerate lower. The first major support is near the 1.3500 level. The next key support is seen near 1.3450, below which the pair could test 1.3420. Any more losses could lead the pair toward the 1.3350 support.
EUR/GBP Technical Analysis
On the hourly chart of EUR/GBP at FXOpen, the pair started a fresh decline from well above 0.8460. The Euro traded below the 0.8440 and 0.8430 support levels against the British Pound.
The EUR/GBP chart suggests that the pair even declined below the 0.8420 level and tested 0.8415. It is now consolidating losses and trading below the 50-hour simple moving average. However, there is a connecting bullish trend line forming with support at 0.8415.
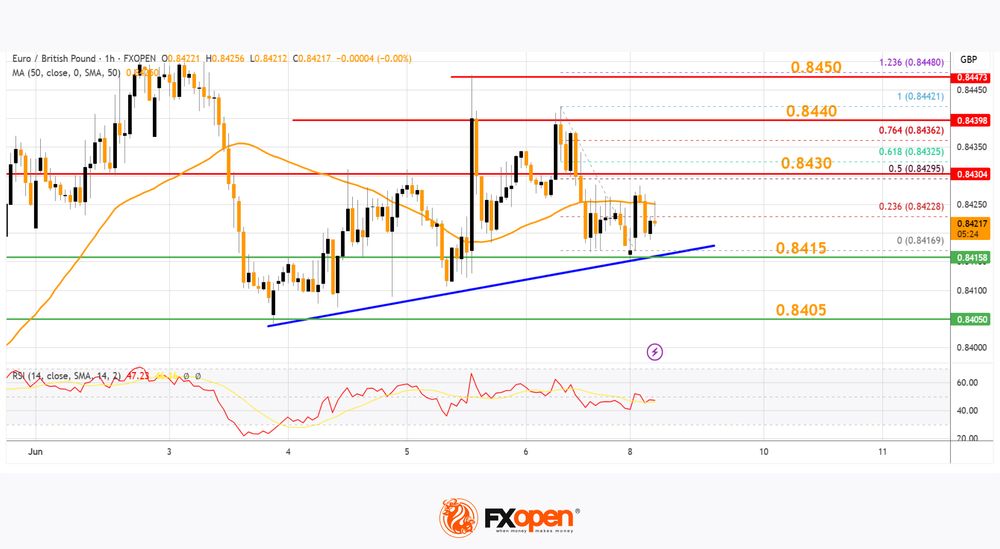
The pair is now facing resistance near the 50% Fib retracement level of the downward move from the 0.8442 swing high to the 0.8416 low at 0.8430.
The next major resistance could be 0.8440. The main resistance is near the 0.8450 zone. It coincides with the 1.236 Fib extension level of the downward move from the 0.8442 swing high to the 0.8416 low.
A close above the 0.8450 level might accelerate gains. In the stated case, the bulls may perhaps aim for a test of 0.8480. Any more gains might send the pair toward the 0.8500 level.
Immediate support sits near 0.8415. The next major support is near 0.8405. A downside break below the 0.8405 support might call for more downsides. In the stated case, the pair could drop toward the 0.8380 support level.
Trade over 50 forex markets 24 hours a day with FXOpen. Take advantage of low commissions, deep liquidity, and spreads from 0.0 pips. Open your FXOpen account now or learn more about trading forex with FXOpen.
This article represents the opinion of the Companies operating under the FXOpen brand only. It is not to be construed as an offer, solicitation, or recommendation with respect to products and services provided by the Companies operating under the FXOpen brand, nor is it to be considered financial advice.
Dow Jones Index Rises Towards Key Resistance
On Friday, the Dow Jones Industrial Average (Wall Street 30 mini on FXOpen) climbed above the 42,950 level — a high not seen since early March.
The index has gained around 1.6% since the beginning of June.
Why Is the Dow Jones Rising?
→ Friday’s US jobs report helped ease concerns about the country’s economic outlook. According to ForexFactory, Non-Farm Employment Change came in at +139K, beating the forecast of +126K.
→ On Thursday, Donald Trump and Chinese President Xi Jinping held a call, easing tariff tensions. Market participants also welcomed news that officials may hold trade negotiations in London on 9 June.
Could the DJIA (Wall Street 30 mini on FXOpen) Rally Continue?
Technical Analysis of the Dow Jones Chart
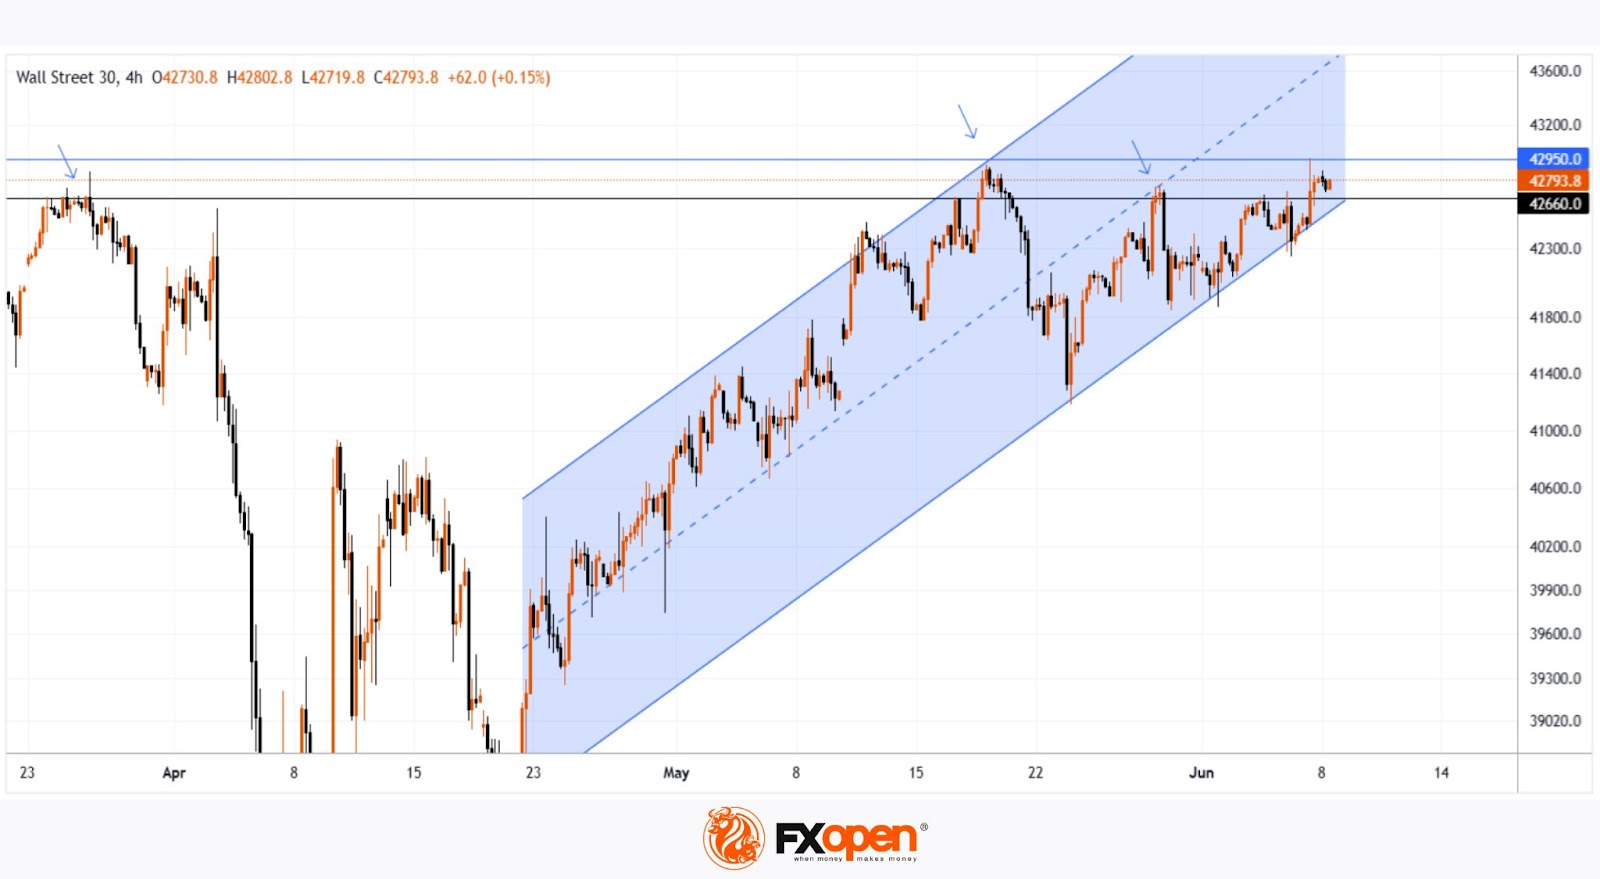
The chart suggests that the 42,950 level is acting as a significant resistance. The price has repeatedly reversed from the 42,660–42,950 area (as shown by the arrows).
At the same time:
→ Friday’s move above 42,950 triggered selling pressure, forming a candlestick with a long upper shadow;
→ This may have been a false bullish breakout of the May high;
→ The price remains within an ascending channel (shown in blue), but the bounces off the lower boundary appear weak.
Given this setup, it is reasonable to assume that intensified bearish activity near 42,950 on the USA30 could lead to a breakout below the channel’s lower boundary.
Additional pressure on the Dow Jones Industrial Average (Wall Street 30 mini on FXOpen) may come from developments in California, where protests have erupted against immigrant deportations, with President Donald Trump and Governor Gavin Newsom trading accusations.
Trade global index CFDs with zero commission and tight spreads. Open your FXOpen account now or learn more about trading index CFDs with FXOpen.
This article represents the opinion of the Companies operating under the FXOpen brand only. It is not to be construed as an offer, solicitation, or recommendation with respect to products and services provided by the Companies operating under the FXOpen brand, nor is it to be considered financial advice.
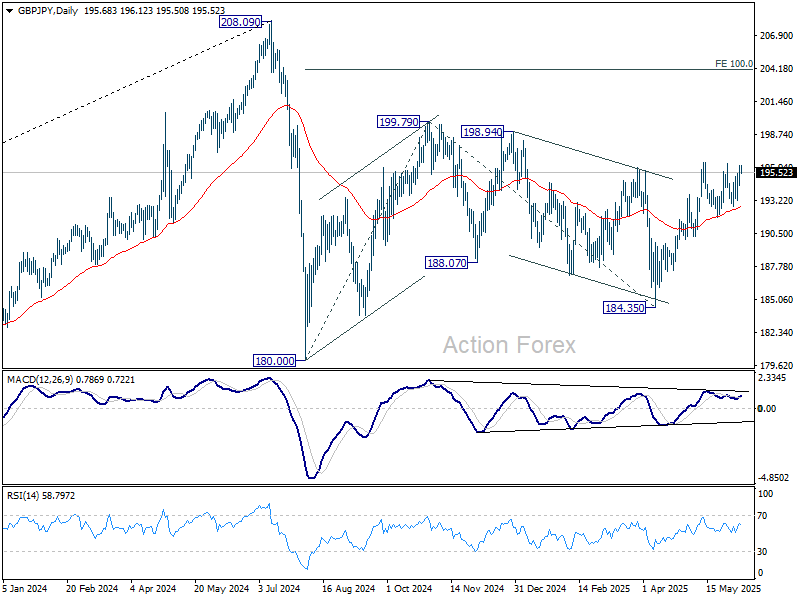
GBP/JPY Daily Outlook
Daily Pivots: (S1) 195.00; (P) 195.59; (R1) 196.53; More...
Intraday bias in GBP/JPY Remains neutral first. Further rise is in favor as long as 191.86 support holds. Firm break of 196.38 will resume whole rally from 184.35 to 199.79 resistance, and possibly further to 100% projection of 180.00 to 199.79 from 184.35 at 204.14.
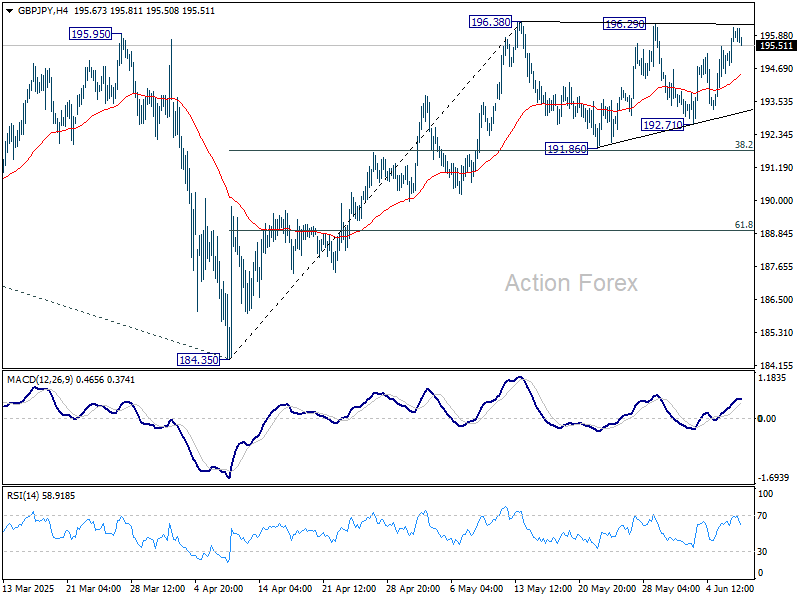
In the bigger picture, price actions from 208.09 are seen as a correction to rally from 123.94 (2020 low). Strong support should be seen from 38.2% retracement of 123.94 to 208.09 at 175.94 to contain downside. However, sustained break of 175.94 will bring deeper fall even still as a correction.
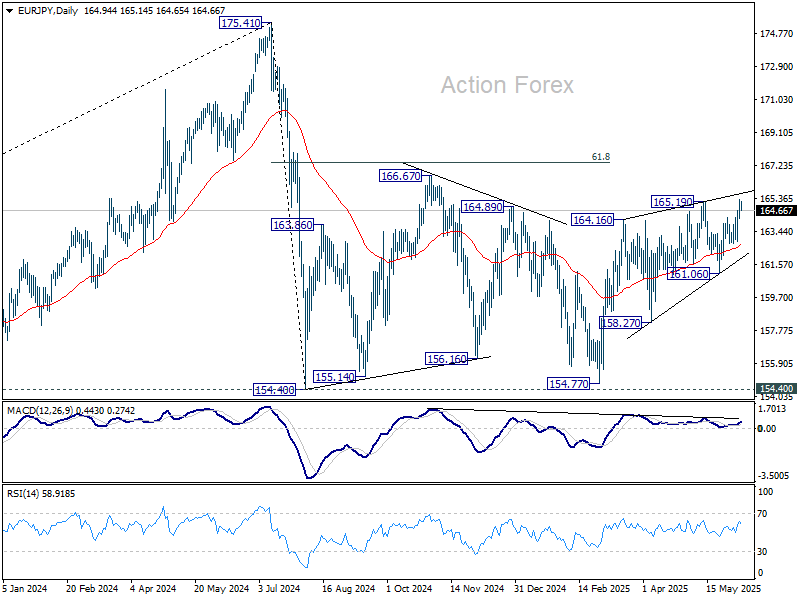
EUR/JPY Daily Outlook
Daily Pivots: (S1) 164.33; (P) 164.81; (R1) 165.51; More...
Intraday bias in EUR/JPY stays on the upside at this point. Decisive break of 165.19 will resume whole rally from 154.77 to 166.67 resistance, and possibly further to 61.8% retracement of 175.41 to 154.77 at 167.38. For now, near term outlook will stay mildly bullish as long as 162.87 support holds, in case of retreat.
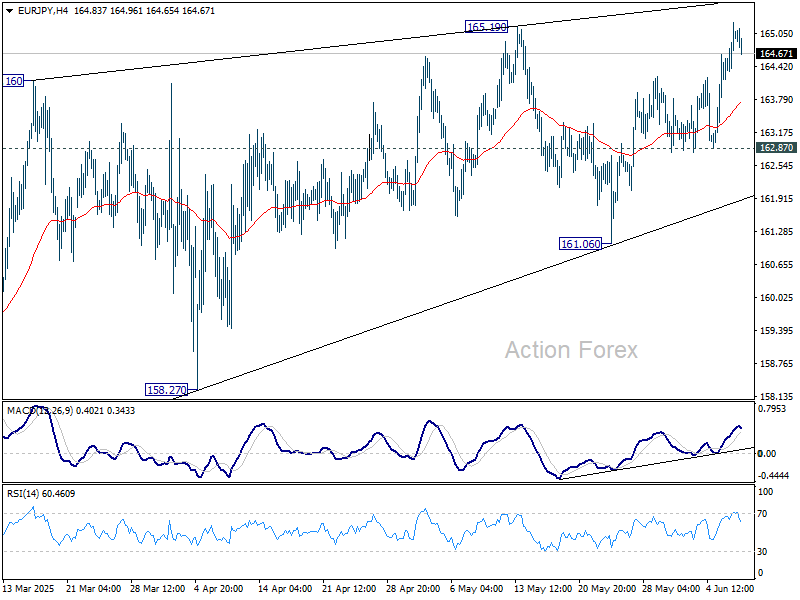
In the bigger picture, price actions from 175.41 are seen as correction to up trend from 114.42 (2020 low). Strong support should be seen from 38.2% retracement of 114.42 to 175.41 at 152.11 to contain downside. However, sustained break of 152.11 will bring deeper fall even still as a correction.
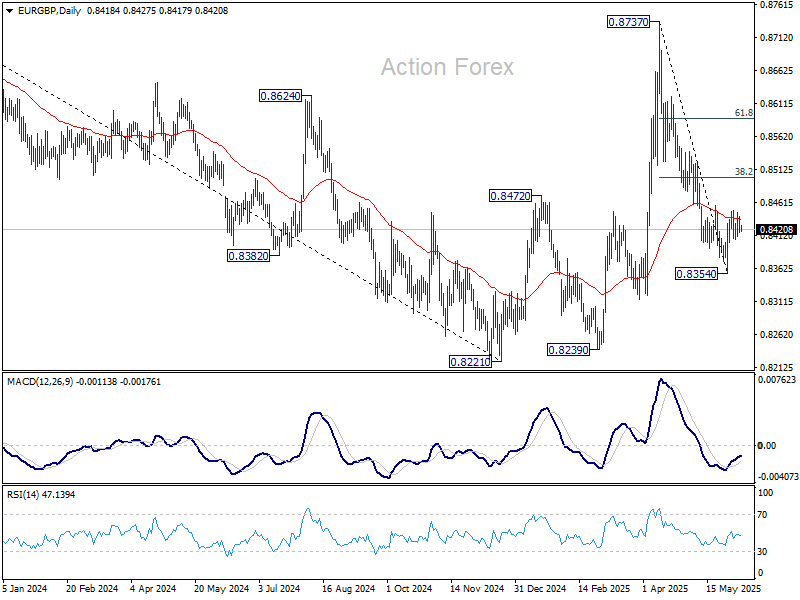
EUR/GBP Daily Outlook
Daily Pivots: (S1) 0.8414; (P) 0.8428; (R1) 0.8440; More...
Intraday bias in EUR/GBP remains neutral at this point. On the upside, above 0.8448 will bring stronger rebound to 38.2% retracement of 0.8737 to 0.8354 at 0.8500. On the downside, below 0.8401 will bring retest of 0.8354 low.
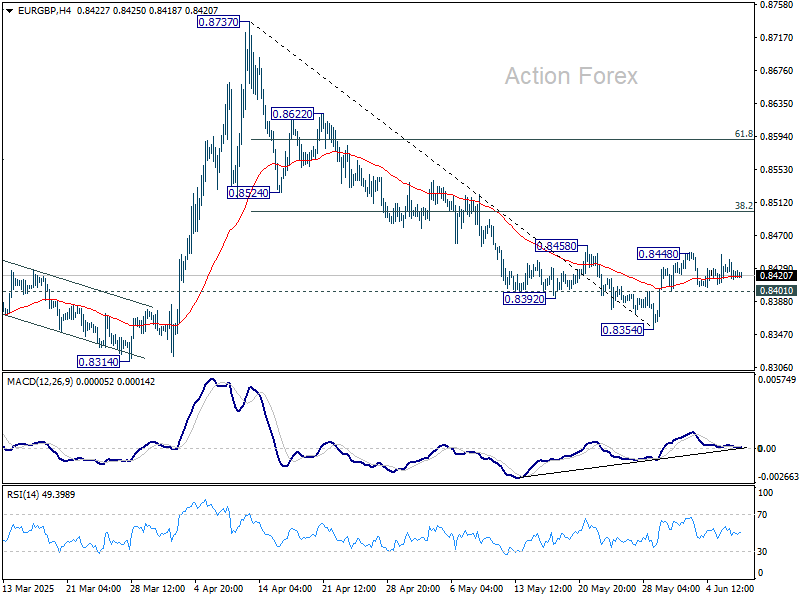
In the bigger picture, price actions from 0.8221 medium term bottom are merely forming a corrective pattern. Nevertheless, there is no clear momentum to break through 0.8201 key support (2022 low) yet. Hence, range trading is expected between 0.8221/8737 for now.