Sample Category Title
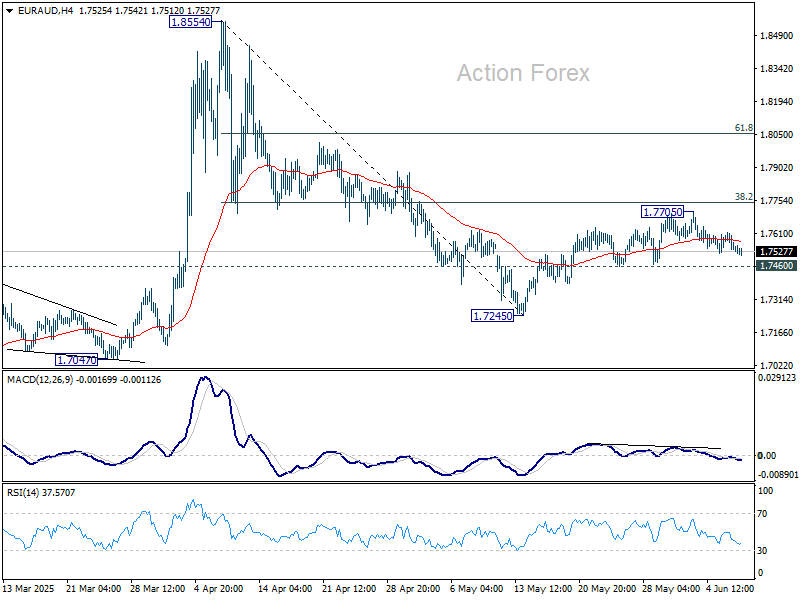
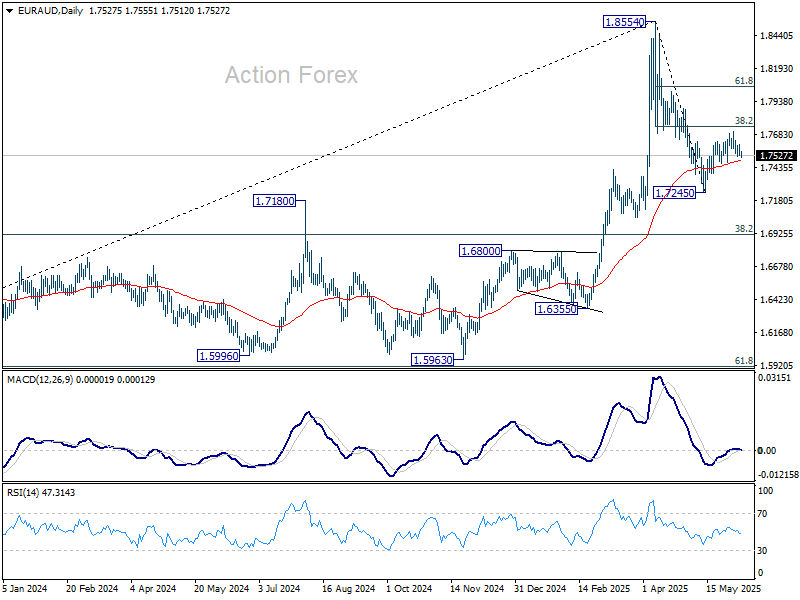
EUR/AUD Daily Outlook
Daily Pivots: (S1) 1.7519; (P) 1.7566; (R1) 1.7598; More...
Intraday bias in EUR/AUD remains neutral for the moment. On the upside, decisive break of 38.2% retracement of 1.8554 to 1.7245 at 1.7745 will solidify the case that fall from 1.8554 has completed as a corrective move. Next target is 61.8% retracement at 1.8054. On the downside, however, break of 1.7460 support will bring retest of 1.7245 instead.
In the bigger picture, with 55 W MACD staying well below signal line, 1.8554 is likely a medium term top already. Price actions from there are seen as a corrective pattern only. While deeper pullback might be seen, downside should be contained by 38.2% retracement of 1.4281 (2022 low) to 1.8554 at 1.6922 to bring rebound. Up trend from 1.4281 is still expected to resume at a later stage.
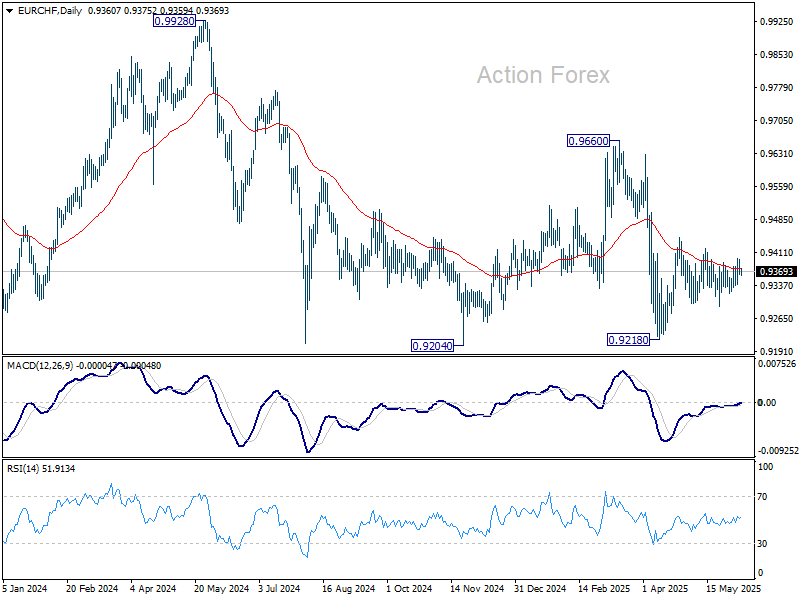
EUR/CHF Daily Outlook
Daily Pivots: (S1) 0.9352; (P) 0.9380; (R1) 0.9396; More....
Intraday bias in EUR/CHF stays neutral for the moment. Price actions from 0.9445 are seen as a triangle consolidation pattern, and thus rise from 0.9218 is not finished. Break of 0.9419 will argue that the rise, either as a correction to fall from 0.9660, or the third leg of the pattern from 0.9204, is ready to resume through 0.9445. Nevertheless, on the downside, firm break of 0.9291 will bring retest of 0.9218 low.
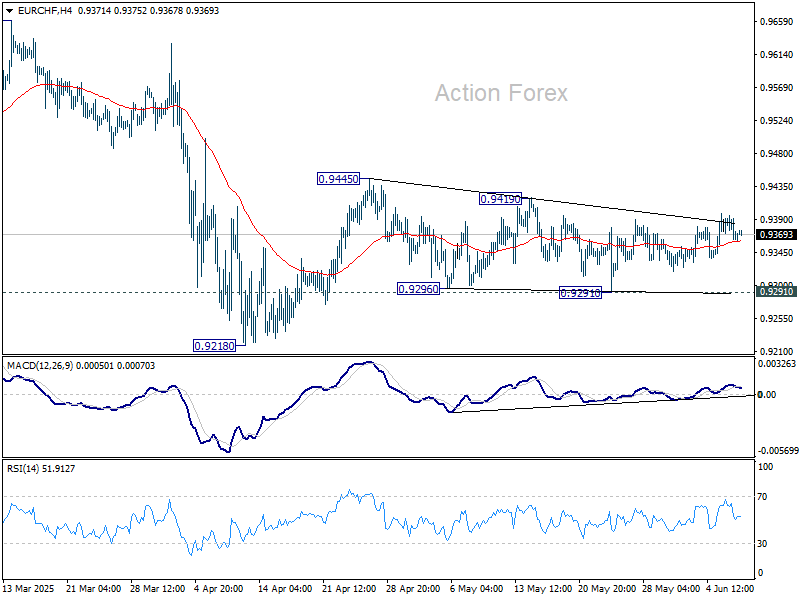
In the bigger picture, prior rejection by long-term falling channel resistance (now at 0.9527) retains medium term bearishness. That is, down trend from 1.2004 (2018 high) is still in progress. Firm break of 0.9204 (2024 low) will confirm resumption. This will remain the favored case as long as 0.9660 resistance holds.
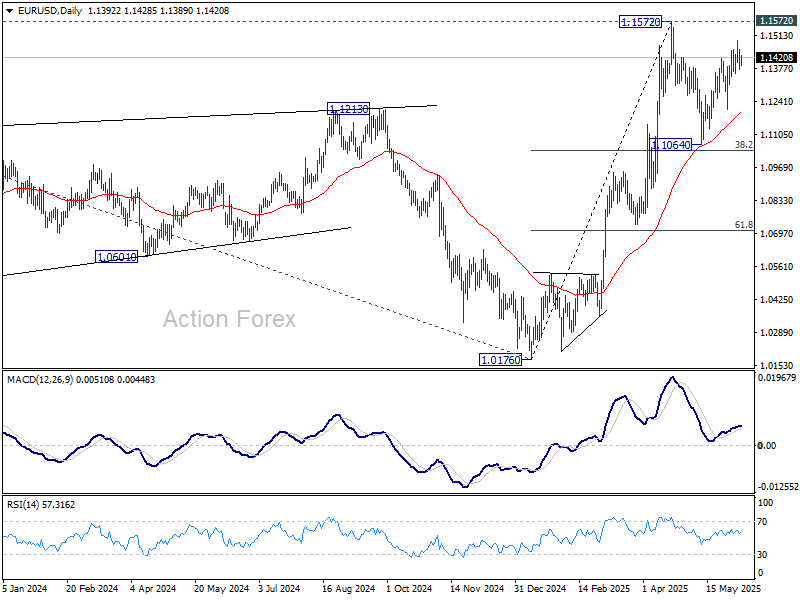
EUR/USD Daily Outlook
Daily Pivots: (S1) 1.1359; (P) 1.1409; (R1) 1.1445; More...
Intraday bias in EUR/USD stays neutral at this point. Price actions from 1.1572 are seen as a corrective pattern to rally from 1.0716. While rebound from 1.1064 might extend, strong resistance should emerge from 1.1572 to limit upside. On the downside, break of 1.1356 support will argue that the correction is already in the third leg, and target 1.1209 support for confirmation.
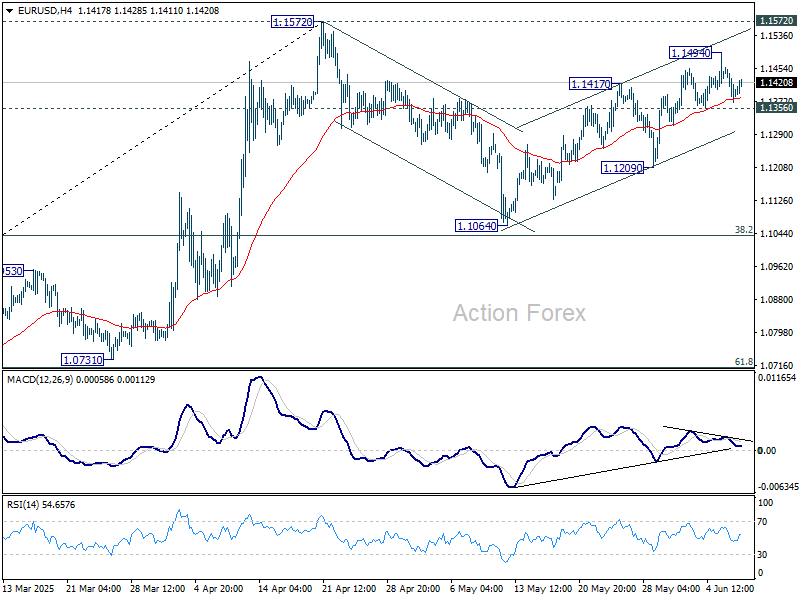
In the bigger picture, rise from 0.9534 long term bottom could be correcting the multi-decade downtrend or the start of a long term up trend. In either case, further rise should be seen to 100% projection of 0.9534 to 1.1274 from 1.0176 at 1.1916. This will now remain the favored case as long as 55 W EMA (now at 1.0894) holds.
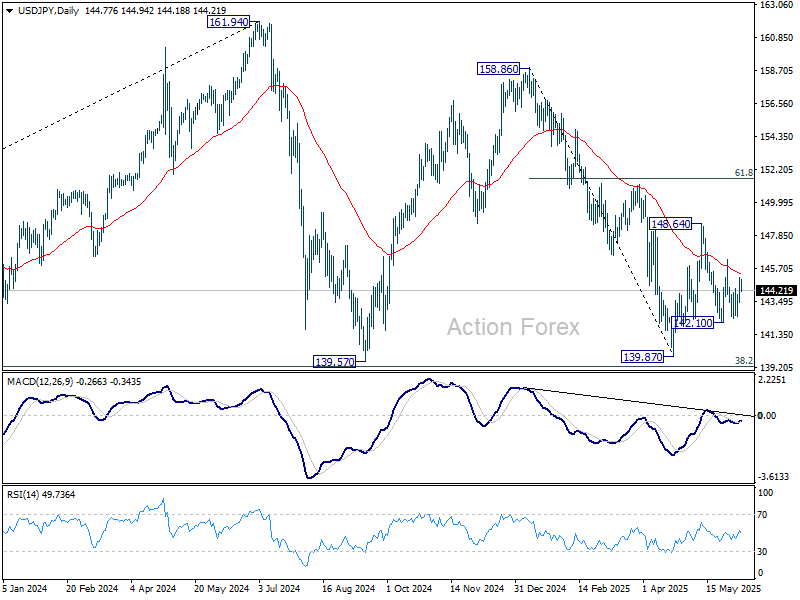
USD/JPY Daily Outlook
Daily Pivots: (S1) 143.77; (P) 144.43; (R1) 145.50; More...
Intraday bias in USD/JPY remains neutral for the moment. On the upside, above 146.27 resistance will argue that price actions from 148.64 has completed as a corrective pattern. Intraday bias will be back on the upside for 148.64 resistance and above to resume the rebound from 139.87 low. However, firm break of 142.10 will bring retest of 139.87 instead.
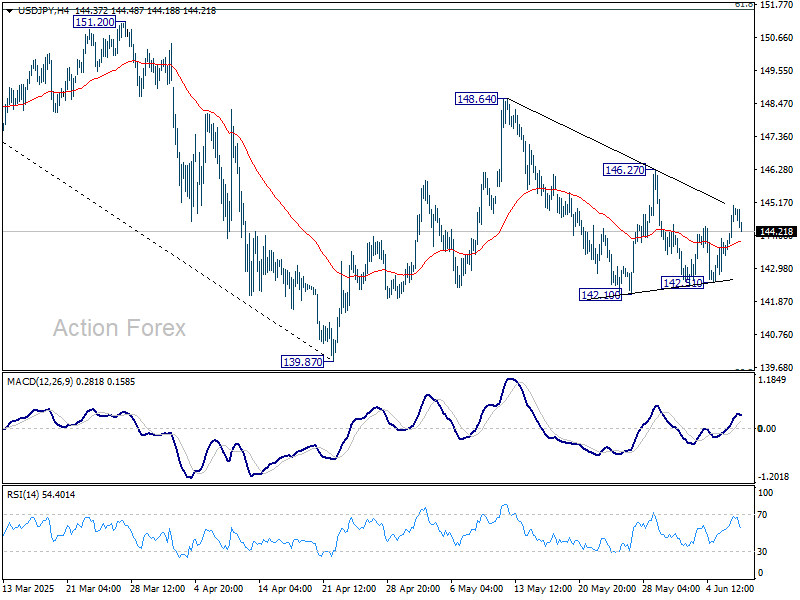
In the bigger picture, price actions from 161.94 are seen as a corrective pattern to rise from 102.58 (2021 low), with fall from 158.86 as the third leg. Strong support should be seen from 38.2% retracement of 102.58 to 161.94 at 139.26 to bring rebound. However, sustained break of 139.26 would open up deeper medium term decline to 61.8% retracement at 125.25.
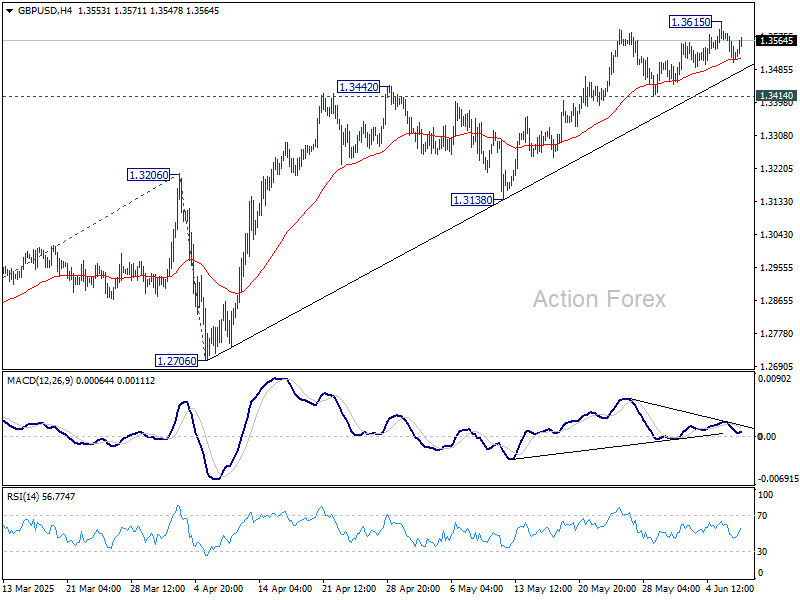
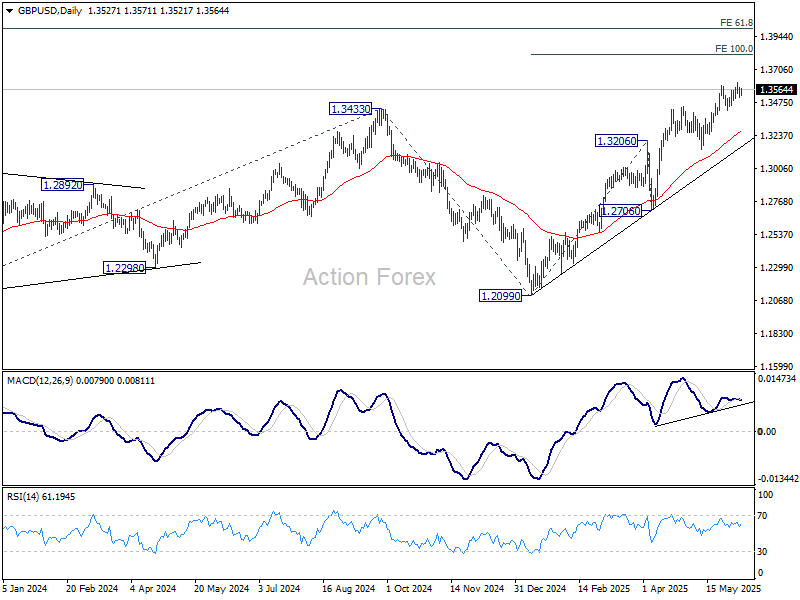
GBP/USD Daily Outlook
Daily Pivots: (S1) 1.3494; (P) 1.3540; (R1) 1.3571; More...
Intraday bias in GBP/USD remains neutral and more consolidations could be seen below 1.3615. Further rise will remain in favor as long as 1.3414 support holds. Above 1.3615 will target 100% projection of 1.2099 to 1.3206 from 1.3138 at 1.3813. Considering bearish divergence condition in 4H MACD, break of 1.3414 support should confirm short term topping, and bring deeper correction to 1.3138 support instead.
In the bigger picture, up trend from 1.3051 (2022 low) is in progress. Next medium term target is 61.8% projection of 1.0351 to 1.3433 from 1.2099 at 1.4004. Outlook will now stay bullish as long as 55 W EMA (now at 1.2913) holds, even in case of deep pullback.
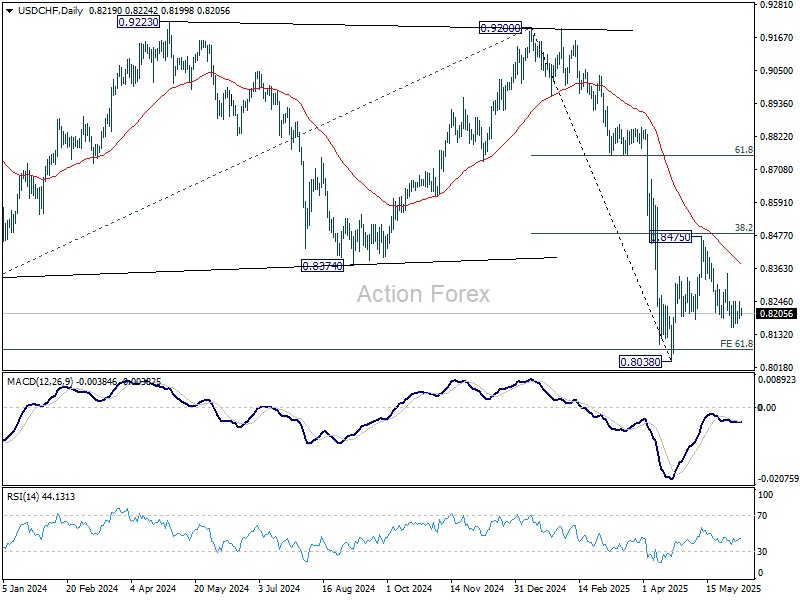
USD/CHF Daily Outlook
Daily Pivots: (S1) 0.8191; (P) 0.8220; (R1) 0.8248; More….
Intraday bias in USD/CHF remains neutral at this point. Price actions from 0.8038 are seen as a corrective pattern to decline from 0.9200. While fall from 0.8475 might extend lower, downside should be contained by 0.8038 to bring rebound. Break of 0.8436 resistance will suggest that it's already in the third leg of the correction, and target 0.8475.
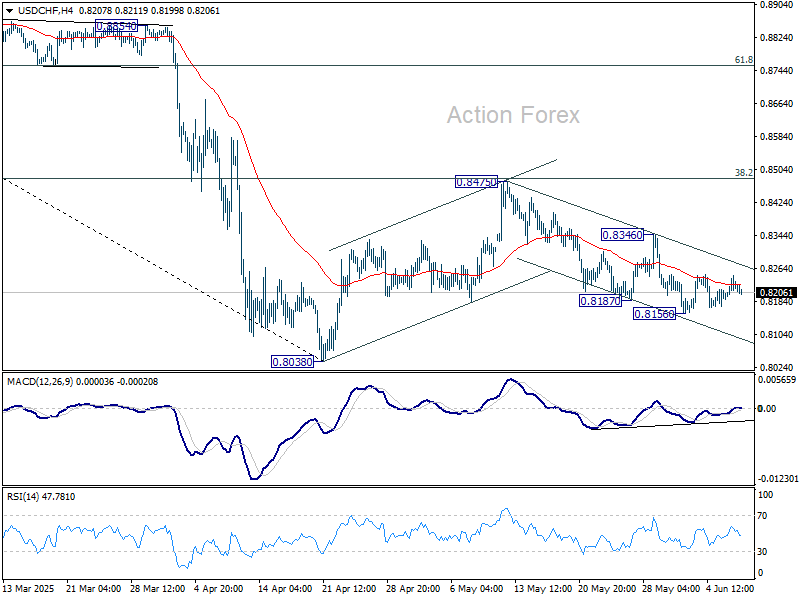
In the bigger picture, long term down trend from 1.0342 (2017 high) is still in progress and met 61.8% projection of 1.0146 (2022 high) to 0.8332 from 0.9200 at 0.8079 already. In any case, outlook will stay bearish as long as 55 W EMA (now at 0.8696) holds. Sustained break of 0.8079 will target 100% projection at 0.7382.
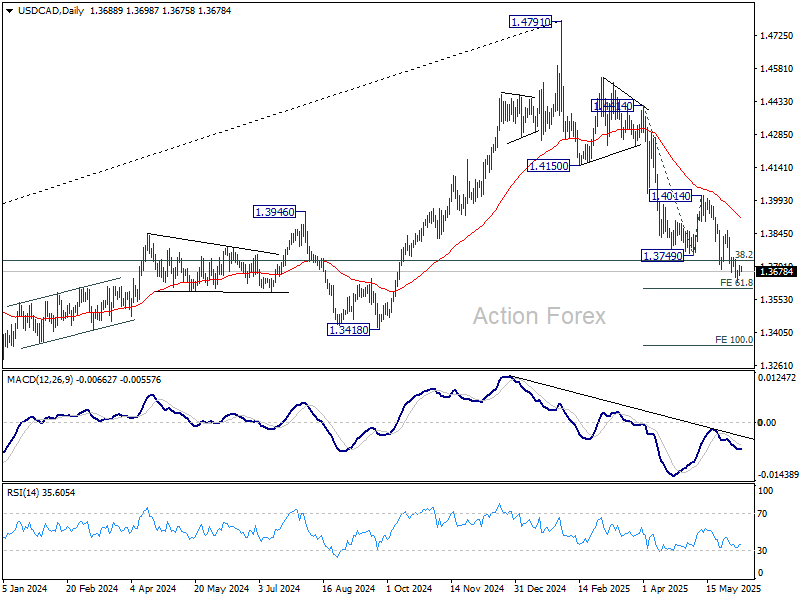
USD/CAD Daily Outlook
Daily Pivots: (S1) 1.3668; (P) 1.3686; (R1) 1.3712; More...
Intraday bias in USD/CAD remains neutral for the moment. Considering bullish convergence condition in 4H MACD, firm break of 1.3741 will indicate short term bottoming at 1.3633. Intraday bias will turn back to the upside for stronger rebound to 1.4014 resistance, as a correction to fall from 1.4791. Nevertheless, decisive break of 61.8% projection of 1.4414 to 1.3749 from 1.4014 at 1.3603 will pave the way to 100% projection at 1.3349.
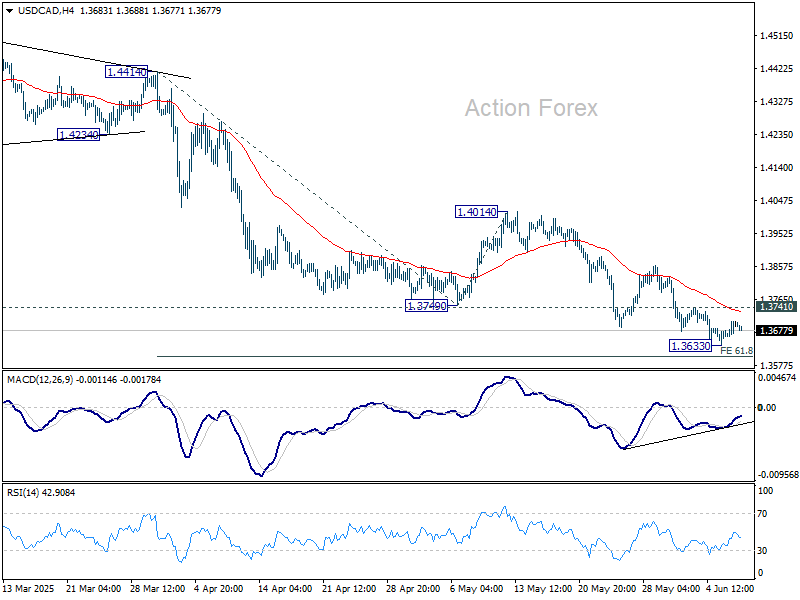
In the bigger picture, price actions from 1.4791 medium term top could either be a correction to rise from 1.2005 (2021 low), or trend reversal. In either case, further decline is expected as long as 1.4014 resistance holds. Firm break of 38.2% retracement of 1.2005 (2021 low) to 1.4791 at 1.3727 will pave the way back to 61.8% retracement at 1.3069.
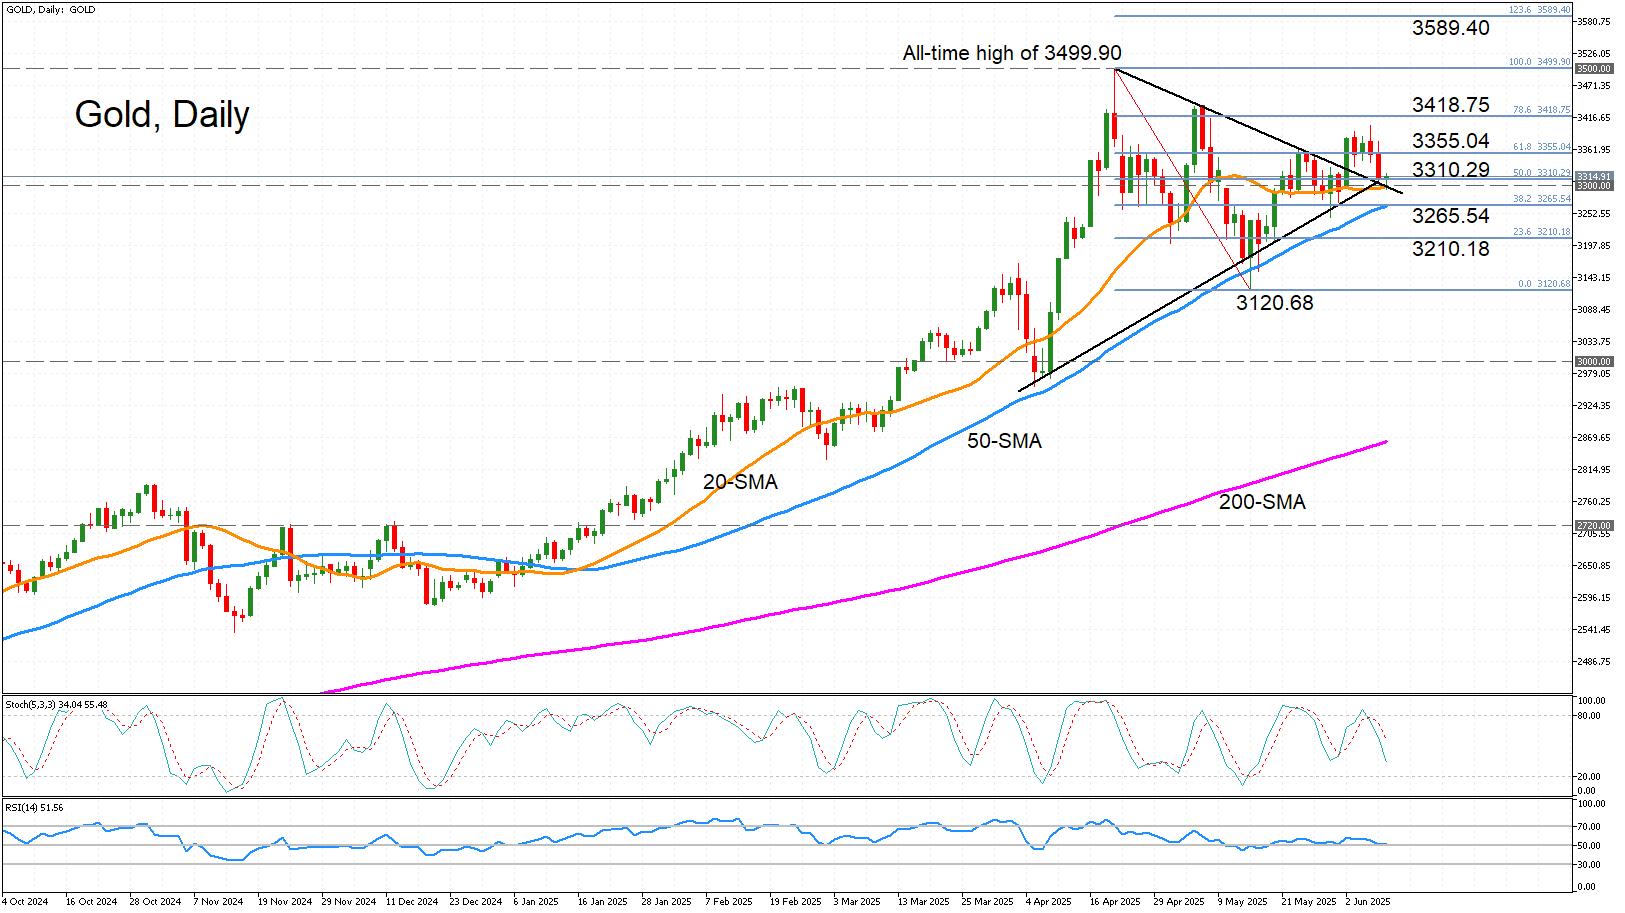
Gold Tests 3,300 as Downside Pressures Persist
- Gold is in danger of breaching 3,300 after false breakout.
- 20-day SMA is holding as support for now.
- Neutral-to-bearish bias in the short term.
Gold hasn’t had the best start to the week, as it faces selling pressure for the third straight day, following the false breakout from the bullish pennant formation. Hopes that negotiators from the US and China will make progress in resolving their trade dispute when they meet in London later today is aiding risk sentiment.
The momentum indicators point to a lacklustre session. The stochastics are headed sharply lower but remain some distance from the oversold zone. However, the RSI has flatlined just above the 50 level. This neutral-to-bearish bias is clearly displayed in the price action, with immediate support coming from the 20-day simple moving average (SMA) just beneath the 3,300 mark.
Should gold breach this critical barrier, there’s likely to be further support at the 50-day SMA, which is about to intersect the 38.2% Fibonacci retracement of the April-May downleg at 3,265.54. Further down, the 23.3% Fibonacci of 3,210.18 could halt the decline before the May low of 3,120.68 comes into range.
If, though, the 20-day SMA is successful in fending off the bears and the price reverses higher, there could be another stiff battle around the 3,355 area, which encompasses the 61.8% Fibonacci. After that, attention would turn to the May peak of 3,437.76 before gold makes another attempt at its all-time high of 3,499.90 set in April.
In a nutshell, gold is struggling to regain some momentum and whether it holds above the 20-day SMA or slips below it could determine the next direction. Dropping below the May trough of 3,120.68 would set the precious metal on a new bearish phase, while only a climb above 3,500.00 would restore the longer-term bullish outlook.
All Eyes on US-China Talks
Last week ended on a positive note. Improved headlines on the trade front between the US and China and a set of better-than-expected US jobs data helped lift the S&P 500 by 1.5% over the week. The Nasdaq 100 rallied 2% despite a sharp selloff in Tesla shares amid a heated dispute between Donald Trump and Elon Musk. As a result, the Nasdaq closed the week just below its all-time high reached in February, while the S&P 500 hit and closed at the key 6,000 psychological level – the first time since February we've seen the major US index trading at this level. We are now approaching overbought conditions.
On the bond front, Friday’s rally was driven largely by a narrative that the US economy remains surprisingly resilient despite trade chaos and geopolitical uncertainty. The US economy added 139K new nonfarm jobs in May, while wage growth unexpectedly accelerated – giving further ammunition to Federal Reserve (Fed) hawks arguing against a July rate cut. As it stands, September looks like the earliest point at which the Fed might consider cutting rates… and even that depends on inflation. On Wednesday, the US will publish its latest CPI data, and forecasts point to growing price pressures – both in headline and core metrics – which could further cool expectations for rate cuts. The US 2-year yield jumped past the 4% mark on Friday. At these levels, the Fed is unlikely to act as a catalyst for equity bulls. However, a strong auction of 30-year US bonds on Thursday could help ease concerns at the long end of the yield curve – as the 30-year yield opens the week just below the 5% psychological level.
More positive trade news could also help sentiment.
Speaking of inflation and trade: Chinese exports grew much slower than expected in May – weighed down by still-elevated triple-digit import tariffs – while imports fell significantly more than forecast. Consumer prices declined for the fourth consecutive month, and the drop in producer prices deepened. Chinese equities opened the week on a mildly positive note, supported by hopes that weak macro data will prompt further stimulus from the People’s Bank of China (PBoC) and the government, and that the second round of US-China trade talks – today in London – could lead to further progress. Last week, a phone call between Trump and Xi yielded news that China would relax export controls on rare earth metals to the US, suggesting the US may also ease restrictions on certain technology exports. Still, some observers warn that the second round of talks may not bring the same level of progress as the first. Any lack of progress could prompt bulls to take profits and move to the sidelines.
In earnings, Oracle and Adobe will be in focus on Wednesday and Thursday, respectively. Oracle’s results will provide an update on cloud infrastructure momentum, while Adobe’s will offer insight into whether consumers are willing to pay for AI tools. Last quarter, Oracle’s infrastructure business grew 50% on demand from major clients including Nvidia and OpenAI. However, the multibillion-dollar Stargate data center expansion has raised concerns about margins and whether the company is spending more on AI than investors are comfortable with.
Elsewhere, European growth data surprised to the upside on Friday, with Ireland and Germany particularly standing out. The upside surprise was largely due to net trade, as exporters rushed to ship goods ahead of expected US tariffs – a possibly temporary boost – but investment also rose in Q1, in line with more government spending, particularly on security. The Stoxx 600 closed the week 0.9% higher. The EURUSD remained bid below the 1.14 level, although the pair has yet to break through 1.15 resistance. The European Central Bank (ECB) delivered another 25bp rate cut but signaled that this may be the end of the rate-cutting cycle. Still, continued inflows into euro-denominated assets should help support the euro against the dollar.
In Japan, GDP figures released earlier today showed stronger-than-expected growth and hotter-than-expected inflation – reinforcing expectations of a more hawkish Bank of Japan (BoJ) stance. The USDJPY is currently testing its 50-day moving average to the downside. A break below this level could trigger further decline, with key support seen in the 142.50–142.75 zone.
In energy, US crude rose more than 5% last week on optimism over US-China trade progress, a weekly decline in US inventories, and strong US jobs data. Crude is consolidating just below the $65/barrel mark this morning. Any positive surprise on the trade front could lift prices above the $65.35 level – the key 38.2% retracement of this year’s decline, and a potential signal of a shift from a bearish to a medium-term bullish trend.
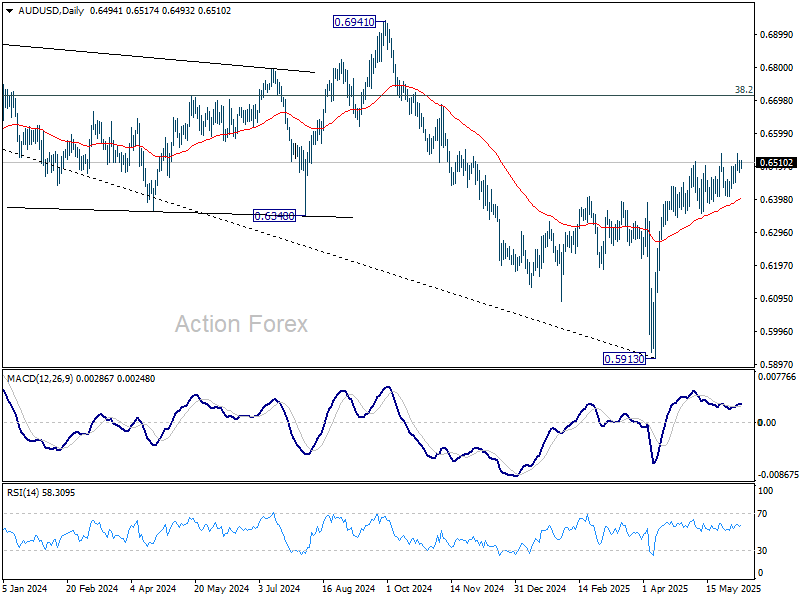
AUD/USD Daily Report
Daily Pivots: (S1) 0.6476; (P) 0.6497; (R1) 0.6513; More...
AUD/USD recovers mildly today but stays below 0.6536 resistance. Intraday bias remains neutral for the moment. Further rise is in favor as long as 0.6406 support holds. On the upside, decisive break of 0.6536 will resume the rally from 0.5913 to 61.8% retracement of 0.6941 to 0.5913 at 0.6548. However, firm break of 0.6406 will turn bias to the downside for 38.2% retracement of 0.5913 to 0.6536 at 0.6298.
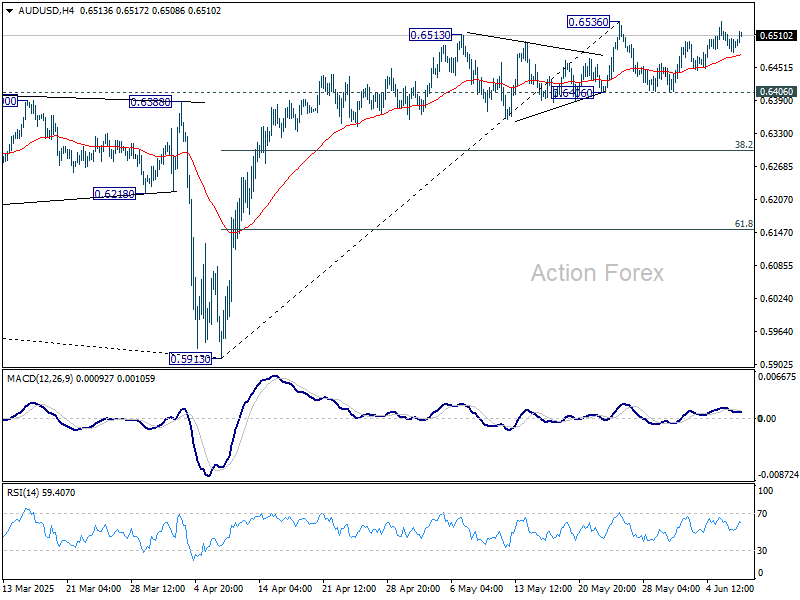
In the bigger picture, AUD/USD is still struggling to sustain above 55 W EMA (now at 0.6443) cleanly, and outlook is mixed. Sustained trading above 55 W EMA will indicate that rise from 0.5913 is at least correcting the down trend from 0.8006 (2021 high), with risk of trend reversal. Further rise should be seen to 38.2% retracement of 0.8006 to 0.5913 at 0.6713. However, rejection by 55 W EMA will revive medium term bearishness for another fall through 0.5913 at a later stage.