Sample Category Title
WTI Crude Oil Recovers Lost Ground, More Gains Possible?
Key Highlights
- WTI Crude Oil prices started a decent increase above the $62.50 level.
- A key bullish trend line is forming with support at $64.20 on the 4-hour chart.
- Gold prices are facing hurdles near the $3,400 resistance.
- EUR/USD is consolidating and might aim for a move above the 1.1440 resistance zone.
WTI Crude Oil Price Technical Analysis
WTI Crude Oil price found support at $61.50 and recovered against the US Dollar. There was a move above the $62.00 and $62.50 resistance levels.
Looking at the 4-hour chart of XTI/USD, the price settled above the $63.20 level, the 100 simple moving average (red, 4-hour), and the 200 simple moving average (green, 4-hour).
The bulls even pushed the price above $65.00 before the bears appeared. The current price action suggests that the price might rise further above the $65.50 resistance. The first key resistance sits near the $66.20 level.
The main hurdle is now near the $68.00 zone, above which the price may perhaps accelerate higher. In the stated case, it could even visit the $70.00 resistance. Any more gains might call for a test of the $72.00 resistance zone in the near term.
On the downside, the first major support sits near the $64.20 zone. There is also a key bullish trend line forming with support at $64.20 on the same chart.
A daily close below $64.20 could open the doors for a larger decline. The next major support is $62.50 and the 100 simple moving average (red, 4-hour). Any more losses might send oil prices toward $60.00 in the coming days.
Looking at Gold, there was a fresh increase above $3,350, but the bears might remain active near the $3,400 level.
Economic Releases to Watch Today
- UK Claimant Count Change for May 2025 – Forecast 9.5K, versus 5.2K previous.
- UK ILO Unemployment Rate for April 2025 (3M) – Forecast 4.6%, versus 4.5% previous.
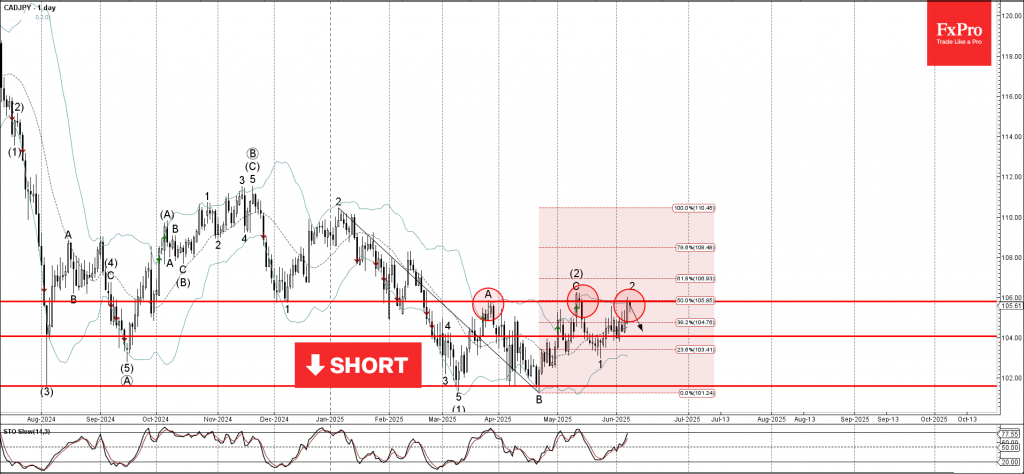
CADJPY Wave Analysis
CADJPY: ⬇️ Sell
- CADJPY reversed from resistance area
- Likely to fall to support level 104.00
CADJPY currency pair recently reversed down from the resistance area between the pivotal resistance level 106.00 (which has been reversing the price from March), upper daily Bollinger Band and the 50% Fibonacci correction of the downward impulse from January.
The downward reversal from this resistance area stopped the previous short-term correction 2.
Given the strength of the resistance level 106.00 and the daily downtrend, CADJPY currency pair can be expected to fall to the next support level 104.00.
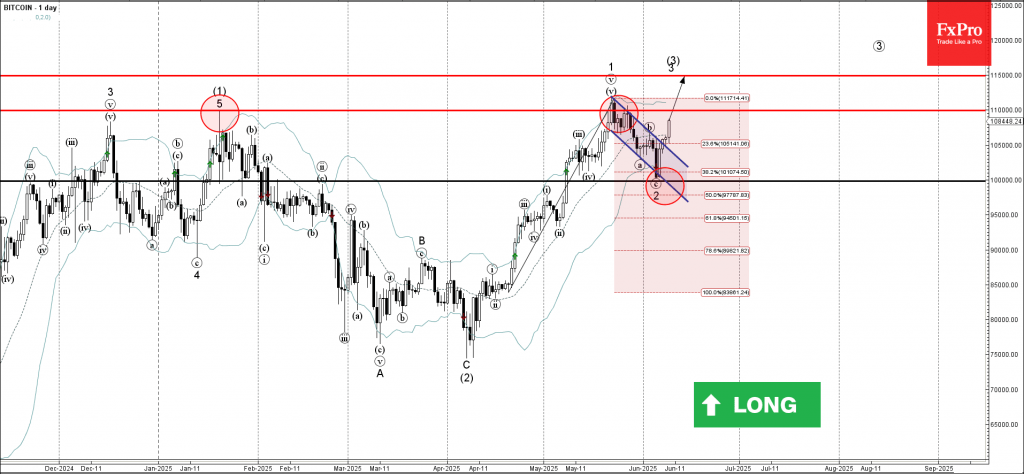
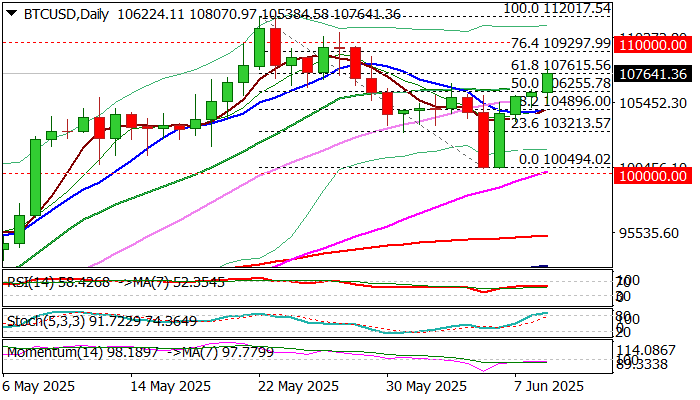
Bitcoin Wave Analysis
Bitcoin: ⬆️ Buy
- Bitcoin broke daily down channel
- Likely to rise to resistance level 110,000.00
Bitcoin cryptocurrency recently broke the resistance trendline of the daily down channel from May (which encloses the previous ABC correction 2 from the end of May).
The breakout of this down channel accelerated the active minor impulse wave 3 of the intermediate impulse wave (3) from the start of April.
Given the clear daily uptrend, Bitcoin cryptocurrency can be expected to rise to the next resistance level 110,000.00 (which reversed the price in January and May) – the breakout of which can lead to further gains toward 115000.00.
Bitcoin Extends Recovery on Brightening Trade Outlook
BTCUSD rises for the fourth consecutive day, extending recovery from last week’s double rejection just above psychological 100K.
Bitcoin received fresh boost from renewed risk appetite, as markets feel relief on start of US-China trade talks and expect positive outcome, that continues to fuel positive sentiment.
The pair rose over 1.5% until early US session on Monday and hit over 61.8% retracement of pullback from new all-time high (112017) to 100378 (correction low) that further improves near term picture.
Daily MA returned to full bullish setup, with ascending and thickening daily cloud continuing to underpin the action, though a warning from overbought stochastic and 14-d momentum still holding just under the centreline, to be considered.
Dily close above broken Fibo 50% and daily Kijun-sen (106198) is minimum requirement to keep fresh bulls intact for attack at 109270 (Fibo 76.4%) and psychological 110K target in extension.
Res: 108966; 109297; 110000; 110802
Sup: 106572; 106198; 104854; 103162
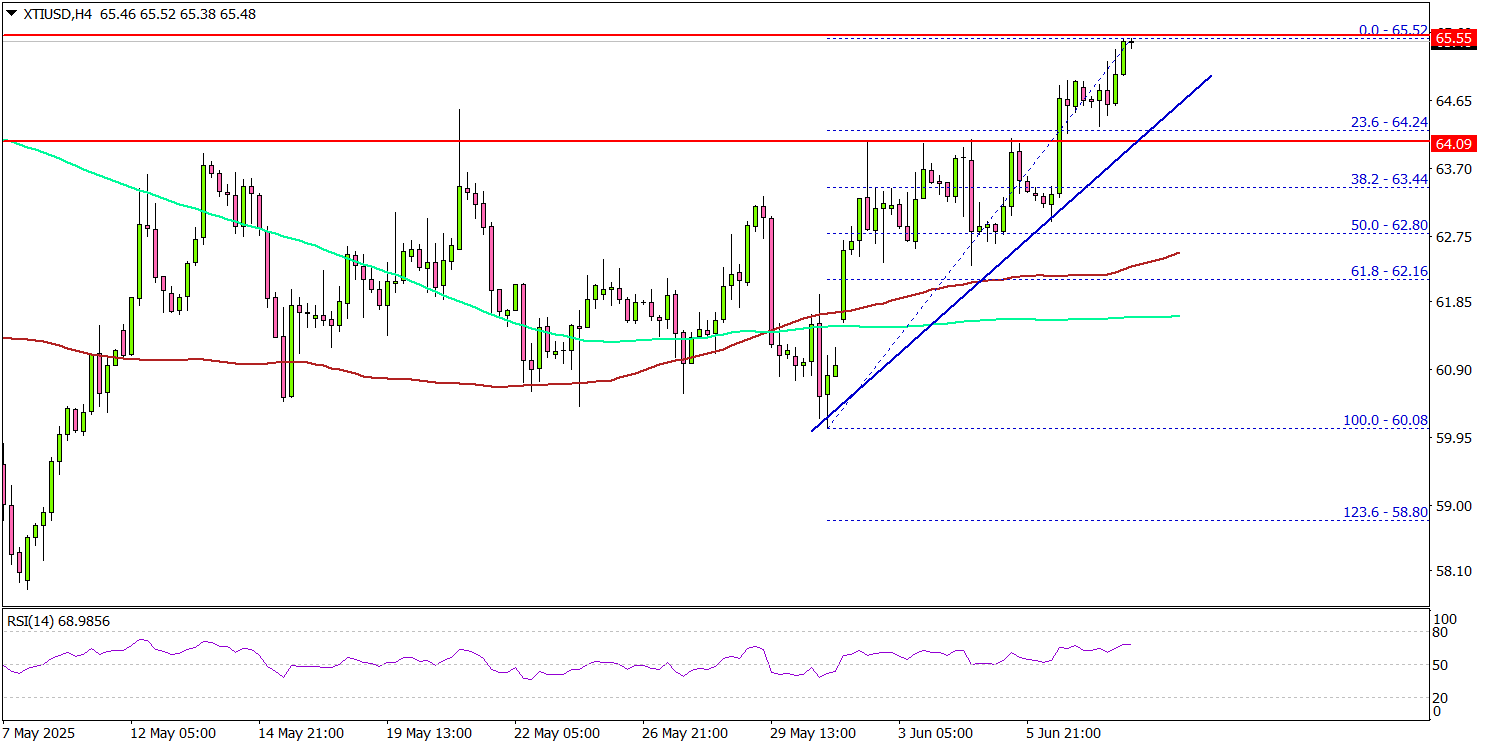
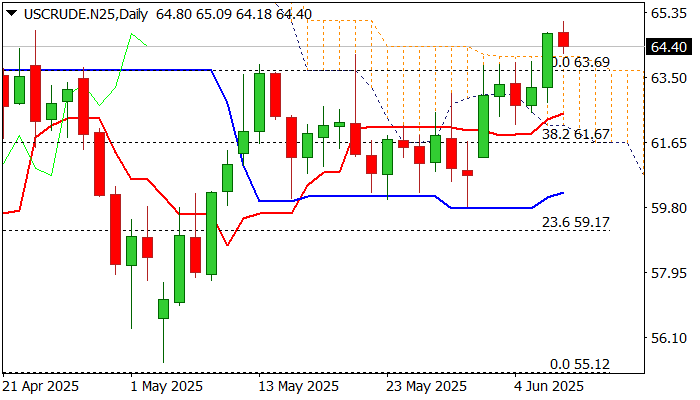
WTI Oil: Bulls May Take a Breather for Consolidation on Overbought Daily Conditions
WTI oil kept firm tone and rose to new multi-week high on Monday, in extension of Friday’s 2.5% advance.
Prevailing positive sentiment on growing hopes for a deal in US-China trade talks and subsequent rise in oil demand continues to inflate oil prices.
The contract was up 5.7% last week, with Friday’s close above significant technical barriers at $63.69/64.12 (50% retracement of $72.27/$55.12 / daily cloud c top), generating fresh bullish signals.
Predominantly bullish daily studies contribute to positive near term outlook, but overbought conditions warning that bulls may pause for consolidation before accelerating again.
Immediate target lays at $65.00 (psychological), followed by $65.72 (Fibo 61.8%), with cloud top (currently at $63.69) to ideally contain dips and keep near term bias with bulls.
Caution on dip and close within daily cloud, with stronger bearish signal to be expected on break of daily Tenkan-sen ($62.47).
Res: 65.09; 65.72; 66.00; 66.43.
Sup: 63.69; 62.80; 62.47; 62.00.
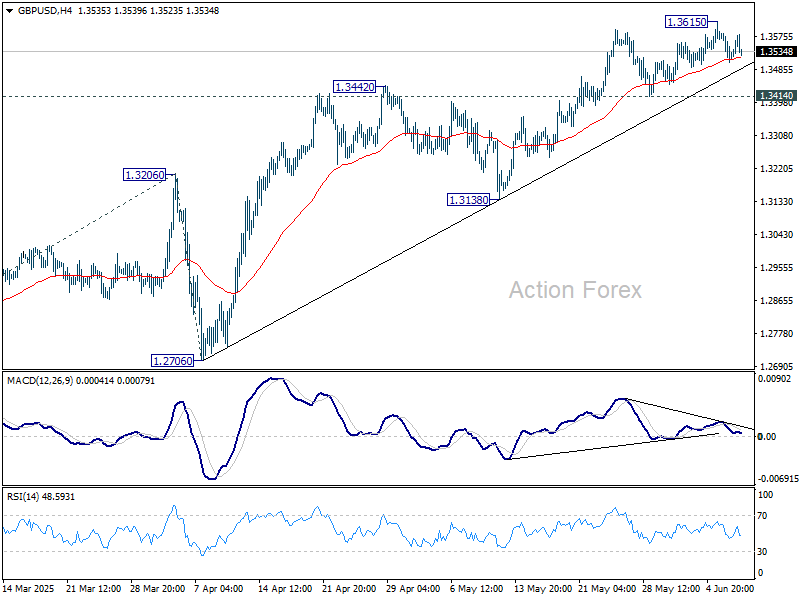
GBP/USD Mid-Day Outlook
Daily Pivots: (S1) 1.3494; (P) 1.3540; (R1) 1.3571; More...
No change in GBP/USD's outlook and intraday bias stays neutral. Further rise will remain in favor as long as 1.3414 support holds. Above 1.3615 will target 100% projection of 1.2099 to 1.3206 from 1.3138 at 1.3813. Considering bearish divergence condition in 4H MACD, break of 1.3414 support should confirm short term topping, and bring deeper correction to 1.3138 support instead.
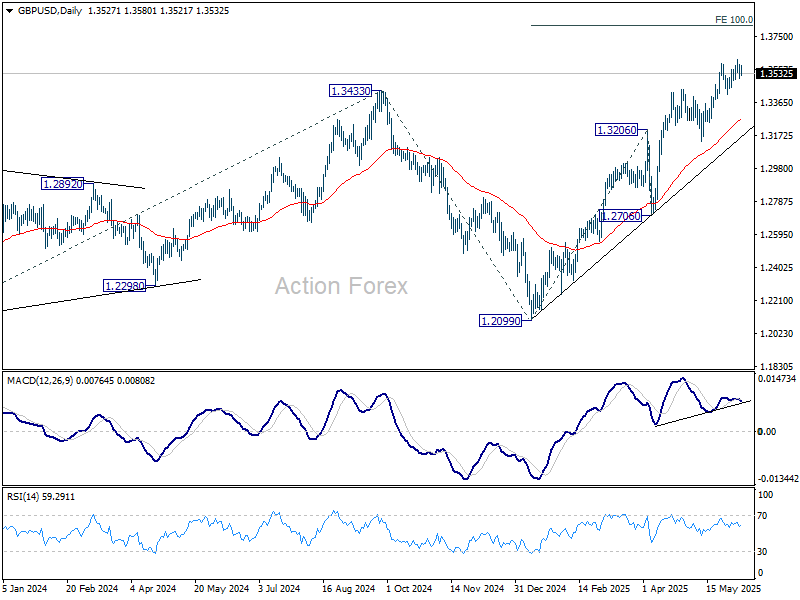
In the bigger picture, up trend from 1.3051 (2022 low) is in progress. Next medium term target is 61.8% projection of 1.0351 to 1.3433 from 1.2099 at 1.4004. Outlook will now stay bullish as long as 55 W EMA (now at 1.2913) holds, even in case of deep pullback.
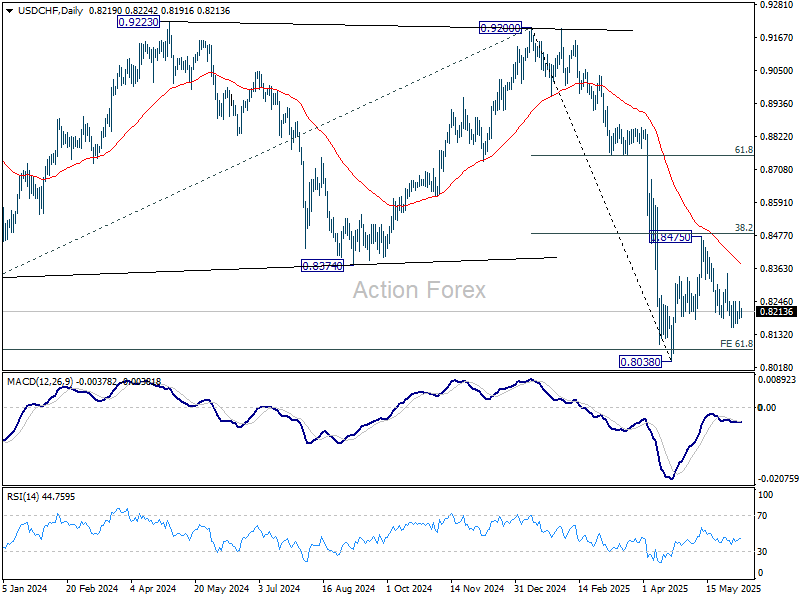
USD/CHF Mid-Day Outlook
Daily Pivots: (S1) 0.8191; (P) 0.8220; (R1) 0.8248; More….
Outlook in USD/CHF is unchanged and intraday bias stays neutral. Price actions from 0.8038 are seen as a corrective pattern to decline from 0.9200. While fall from 0.8475 might extend lower, downside should be contained by 0.8038 to bring rebound. Break of 0.8436 resistance will suggest that it's already in the third leg of the correction, and target 0.8475.
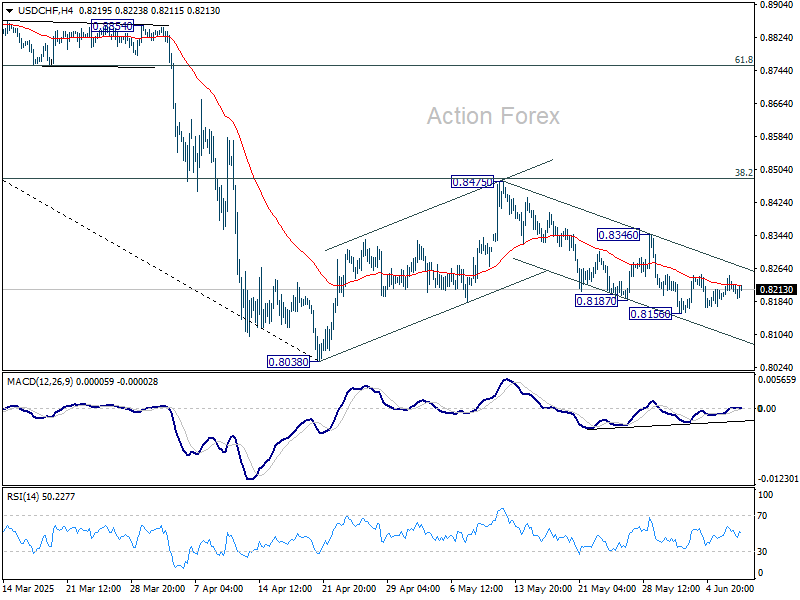
In the bigger picture, long term down trend from 1.0342 (2017 high) is still in progress and met 61.8% projection of 1.0146 (2022 high) to 0.8332 from 0.9200 at 0.8079 already. In any case, outlook will stay bearish as long as 55 W EMA (now at 0.8696) holds. Sustained break of 0.8079 will target 100% projection at 0.7382.
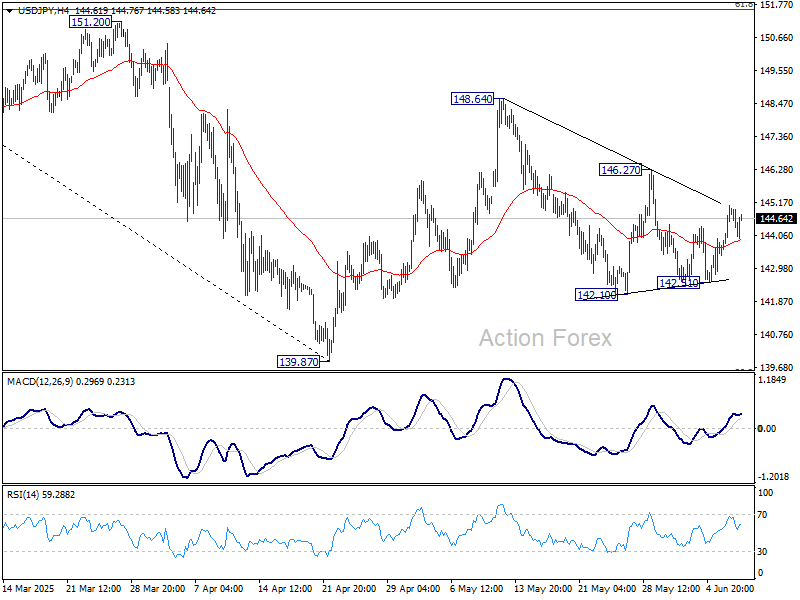
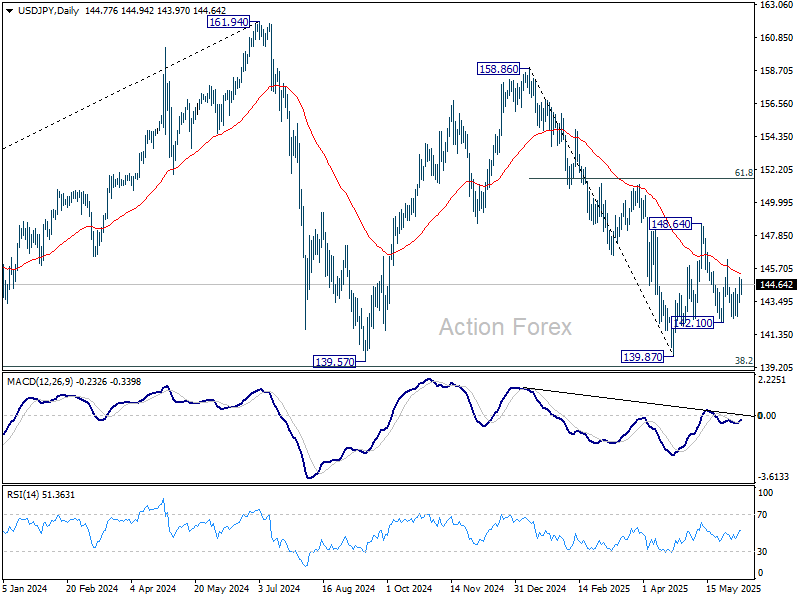
USD/JPY Mid-Day Outlook
Daily Pivots: (S1) 143.77; (P) 144.43; (R1) 145.50; More...
Intraday bias in USD/JPY stays neutral and outlook is unchanged. On the upside, above 146.27 resistance will argue that price actions from 148.64 has completed as a corrective pattern. Intraday bias will be back on the upside for 148.64 resistance and above to resume the rebound from 139.87 low. However, firm break of 142.10 will bring retest of 139.87 instead.
In the bigger picture, price actions from 161.94 are seen as a corrective pattern to rise from 102.58 (2021 low), with fall from 158.86 as the third leg. Strong support should be seen from 38.2% retracement of 102.58 to 161.94 at 139.26 to bring rebound. However, sustained break of 139.26 would open up deeper medium term decline to 61.8% retracement at 125.25.
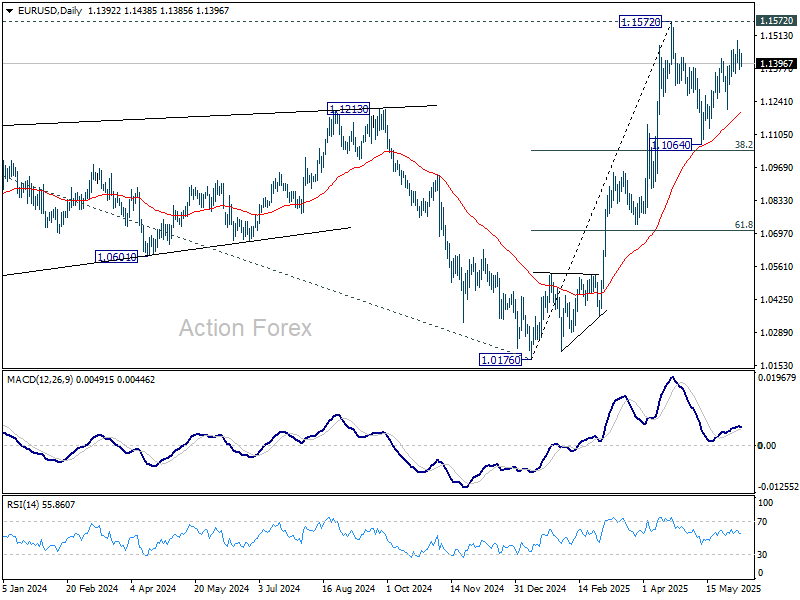
EUR/USD Mid-Day Outlook
Daily Pivots: (S1) 1.1359; (P) 1.1409; (R1) 1.1445; More...
No change in EUR/USD's outlook and intraday bias stays neutral. Price actions from 1.1572 are seen as a corrective pattern to rally from 1.0716. While rebound from 1.1064 might extend, strong resistance should emerge from 1.1572 to limit upside. On the downside, break of 1.1356 support will argue that the correction is already in the third leg, and target 1.1209 support for confirmation.
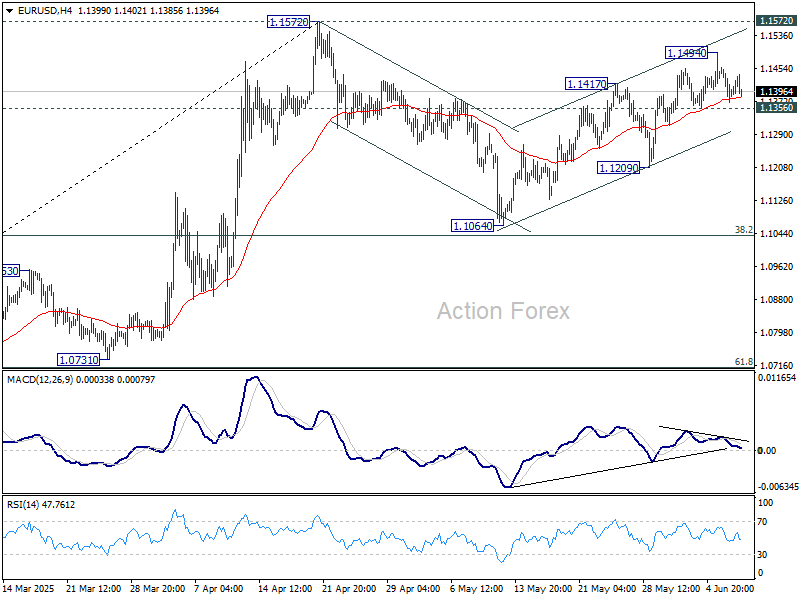
In the bigger picture, rise from 0.9534 long term bottom could be correcting the multi-decade downtrend or the start of a long term up trend. In either case, further rise should be seen to 100% projection of 0.9534 to 1.1274 from 1.0176 at 1.1916. This will now remain the favored case as long as 55 W EMA (now at 1.0894) holds.