Sample Category Title
Tariff Truce Wobbles at Halfway Mark; Risk Sentiment Falters on Renewed Threats
Trade war roared back into focus late last week, derailing fragile market sentiment already strained by concerns over the ballooning US deficit. The catalyst came in the form of a sharp threat from US President Donald Trump on European Union imports. This abrupt escalation shattered hopes that the 90-day truce period would lead to calmer trade diplomacy, and instead reignited fears of a broader trade war just as markets were struggling to absorb fiscal uncertainty.
US equities tumbled in response, with heavy losses across major indices, while European bourses weren’t spared either. Risk aversion swept through global markets, pushing investors toward traditional safe-haven assets.
Dollar, which had already been under pressure from Moody’s downgrade and debt sustainability concerns, took another hit and ended the week as the worst-performing major currency. Confidence in US assets appears increasingly fragile as both fiscal and trade risks deepen.
Aussie followed as the second weakest, burdened not just by global risk aversion but also by the dovish tone from RBA earlier in the week, while Loonie also suffered at the bottom.
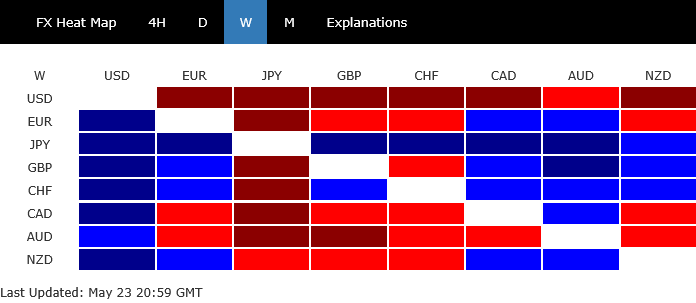
In contrast, the Japanese Yen and Swiss Franc surged to the top of the FX leaderboard, clearly benefiting from haven demand. Gold also staged a powerful rally, with its bullish momentum signaling deep market unease.
Euro and Sterling settled in the middle of the pack. While the Euro showed some vulnerability to Trump's tariff threat, it remained relatively supported. Sterling, meanwhile, was underpinned by a series of stronger-than-expected economic data, including upside surprises in inflation and retail sales.
Trade War Returns to Spotlight as Trump’s Tariff Threat on EU Hammers Markets, Dollar Slides
The global financial markets, which had been preoccupied with US sovereign debt concerns and the impact of a Moody’s downgrade earlier in the week, saw sentiment quickly shift as trade war tensions re-emerged. The trigger came late Friday, when US President Donald Trump declared he is “recommending a straight 50% Tariff on the European Union,” citing frustration with stalled negotiations. The announcement stunned investors and reignited fears of a wider spiral, sending US stocks and Dollar sharply lower into the weekly close.
Equity markets, which had enjoyed a strong six-week rally driven by optimism from the 90-day tariff truce with major trading partners, were caught off guard. As little tangible progress was made halfway through the truce period, Trump’s shift back to hardline tactics was interpreted as a sign that the administration may be preparing to walk away from negotiation tables. The renewed threat has not only clouded the outlook for trade but also raised concerns over the policy direction in Washington.
Speaking at a White House event, Trump made clear his stance: “I’m not looking for a deal. I mean, we’ve set the deal. It’s at 50%.” Treasury Secretary Scott Bessent echoed the sentiment, suggesting the tariff threat was intended to “light a fire under the EU.” These remarks hinted at a deliberate strategy to escalate pressure on Brussels ahead of the June 1 deadline.
In response, European Commission Vice President Maros Sefcovic stated the EU remains “fully engaged” and committed to securing a mutually beneficial deal. He emphasized that negotiations must be “guided by mutual respect, not threats,” and warned the EU stands ready to defend its interests. Despite diplomatic overtures, the tone on both sides suggests little ground has been gained, making further market volatility likely as the deadline nears.
In summary, the re-ignition of trade tensions with the EU has thrown markets back into uncertainty. With US fiscal policy already under scrutiny and tariff escalation threatening global growth, investors may remain on the defensive until clearer direction emerges, either through a breakthrough in negotiations or a change in Washington’s rhetoric. Until then, volatility and risk aversion are likely to dominate.
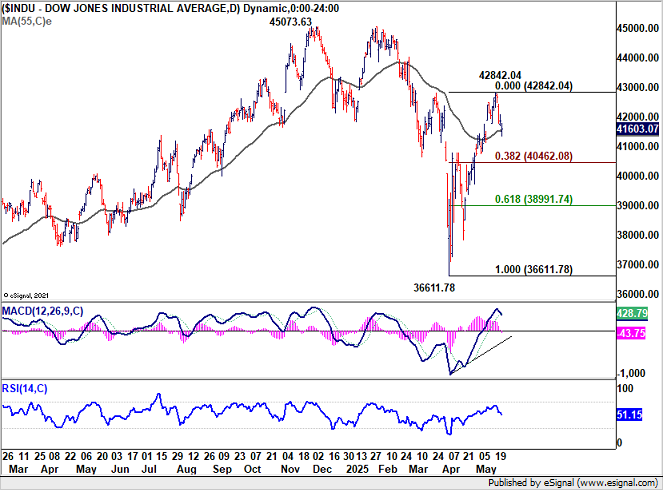
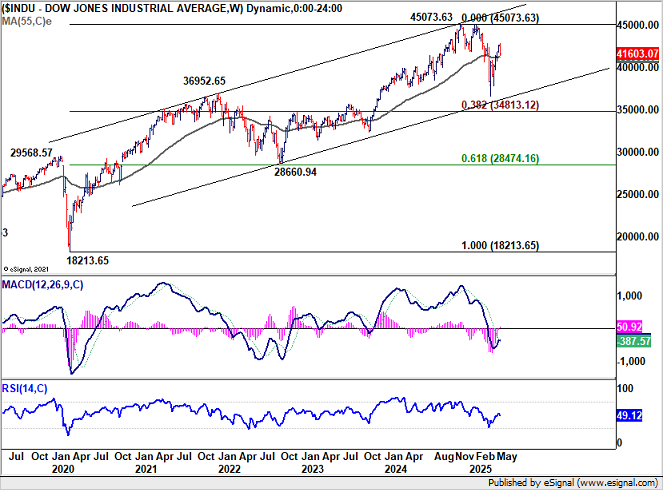
Technically, DOW's extended decline last week indicates that a short term top was already formed at 42842.04. More consolidations would be seen with risk of deeper decline. But overall near term outlook will stay bullish as long as 38.2% retracement of 36611.78 to 42842.04 at 40462.08 holds.
However, rise from 36611.78 is seen as the second leg of the medium term corrective pattern from 45073.63 high. So, even in case of another rise, DOW should start to lose momentum again as it approaches 45073.63.
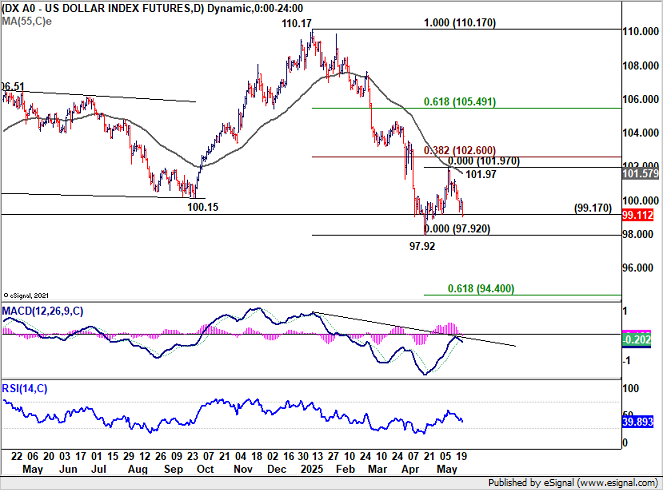
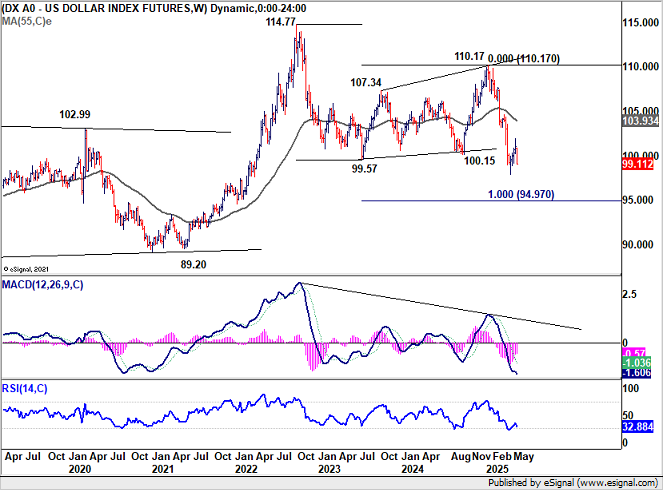
Dollar Index's late break of 99.17 support argues that corrective rebound from 97.92 might have completed at 101.97 already. Further decline is now in favor in the near term to retest 97.92 low first. Firm break there will resume the larger down trend to 61.8% projection of 100.17 to 97.92 from 101.97 at 94.40.
European Stocks Also Hit by Tariff Shock; DAX and CAC Signal Near-Term Tops
European equities also slumped in tandem with the US on Friday on Trump's tariff threat. The announcement dealt a direct blow to investor sentiment across the region, with Germany’s DAX and France’s CAC 40 each falling around -1.6% on the day.
However, Germany’s equity outlook, and to a lesser extent the region's, should remain underpinned by fiscal expansion at both national and EU levels, which could cushion downside risks and support a medium-term bullish outlook.
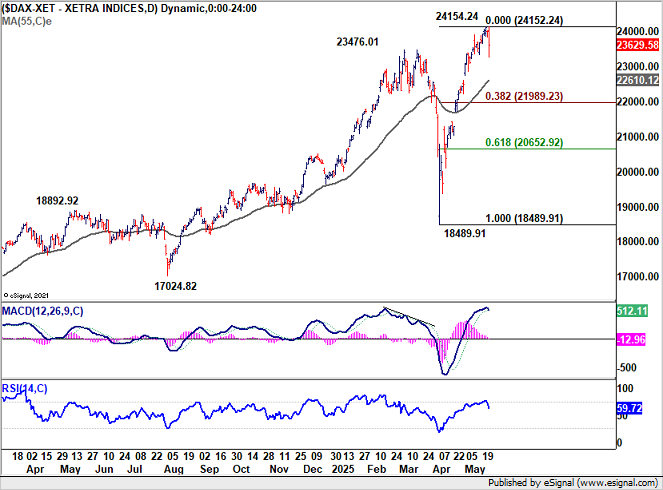
Technically, the late selloff in DAX indicates that 24154.24 record high should already be a short term top. Near term risk is mildly on the downside for pull back to 55 D EMA (now at 22610.12). Nevertheless, strong support should emerge from 38.2% retracement of 18489.91 to 24154.24 at 21989.23 to contain downside to bring rebound.
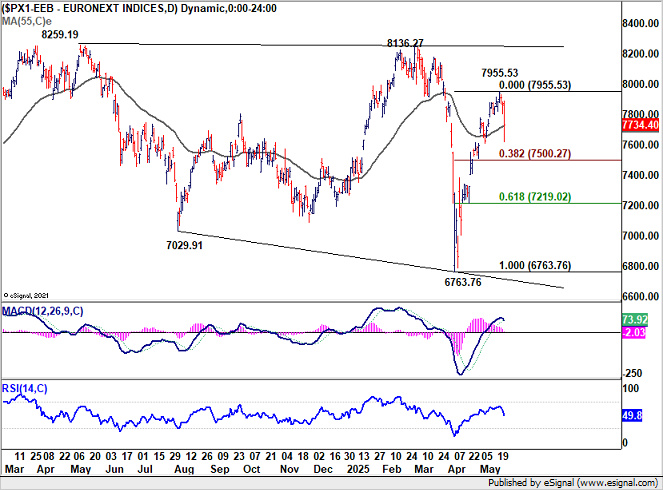
CAC should have formed a short term top at 7955.53, and turned into consolidations. Given CAC's underperformance comparing to DAX, there is risk of dipping through 38.2% retracement of 6763.76 to 7955.53 at 7500.27. But strong support should be seen above 61.8% retracement at 7219.02 to contain downside.
Aussie Under Fire as RBA's Dovish Cut Fuels July Easing Bets
Aussie ended last week as one of the weakest performers among major currencies, additionally weighed down by the dovish 25bps rate cut from RBA. While the move was widely expected, RBA Governor Michele Bullock revealed that the board had actively considered a larger 50bps reduction before settling on the more measured step.
Bullock also deliberately leave the door open for fasting easing, as she indicated that "if we need to move quickly, we can. We have got space."
Alongside the cut, RBA downgraded its 2025 GDP growth forecast from 2.1% to 1.9% and revised year-end CPI projections sharply lower, from 3.7% to 3.0%.
These adjustments cemented the market’s view that the easing cycle has room to run, with rate futures now assigning more than 50% probability to another cut as early as July and fully pricing in a second 25bps cut by August.
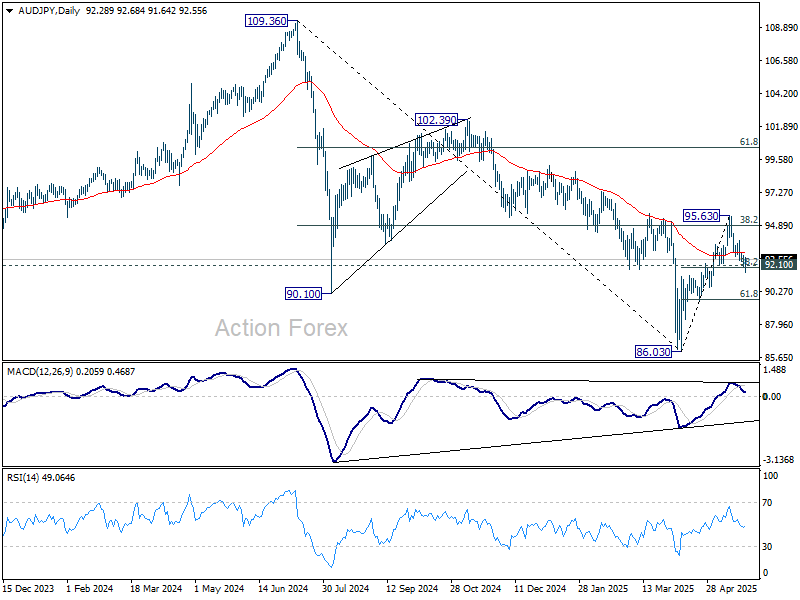
Technically, AUD/JPY failed to sustain above 38.2% retracement of 109.36 to 86.03 at 94.94, and retreated from there. Focus is now on 92.10 cluster support (38.2% retracement of 86.03 to 95.63 at 91.96).
Strong rebound from 91.96/92.10 will retain near term bullishness. Further break of 95.63 will solidify the bullish case that whole fall form 109.36 has completed as a three-wave correction to 86.03.
However, firm break of 91.96/92.10 will argue that the rebound has completed. More importantly, the down trend from 109.36 is likely still in progress for another low below 86.03.
Gold Eyes Fresh Record High as Safe Haven Flows Persist
Gold rallied strongly last week, supported by a confluence of factors including persistent concerns over the US fiscal outlook and escalating global trade tensions.
With global equities showing signs of strain and long-dated US Treasury yields on the rise, capital has flowed steadily into Gold. The precious metal’s resilience suggests it may be gearing up to break above the record high of 3500, especially if risk aversion intensifies in the days ahead.
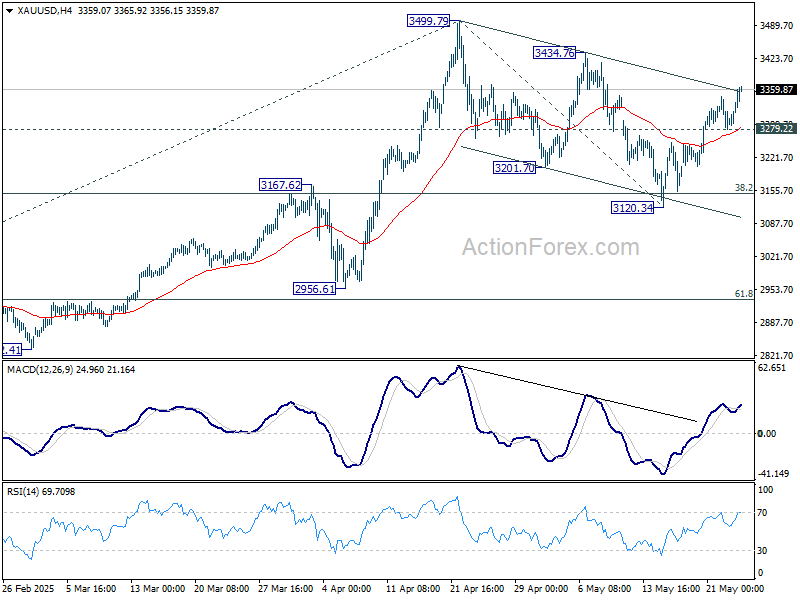
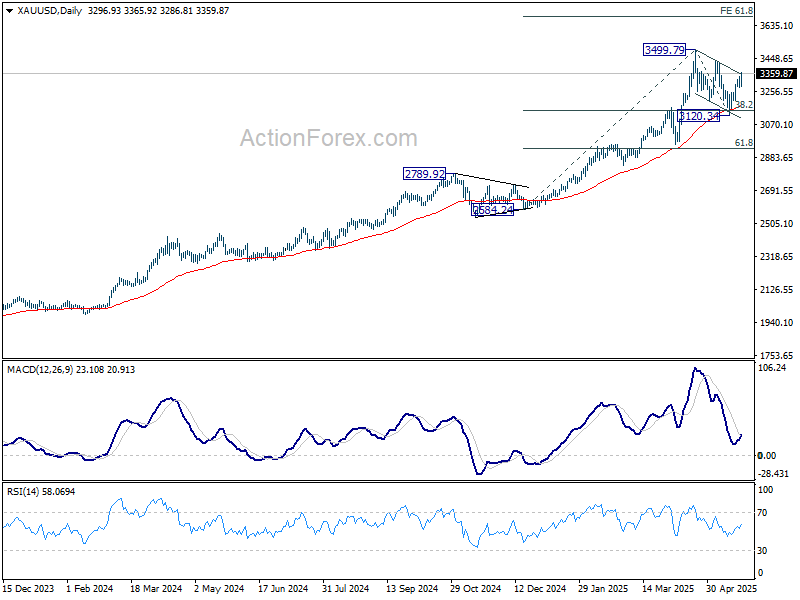
Technically, corrective decline form 3499.79 should have completed with three waves down to 3120.34. That came after strong support from 55 D EMA (now at 3177.32) and 38.2% retracement of 2584.24 to 3499.79 at 3150.04.
Further rise is expected as long as 3279.22 support holds, to retest 3499.79 high first. Decisive break there will resume larger up trend to 61.8% projection of 2584.24 to 3499.79 from 3120.34 at 3686.14 next.
GBP/USD Weekly Outlook
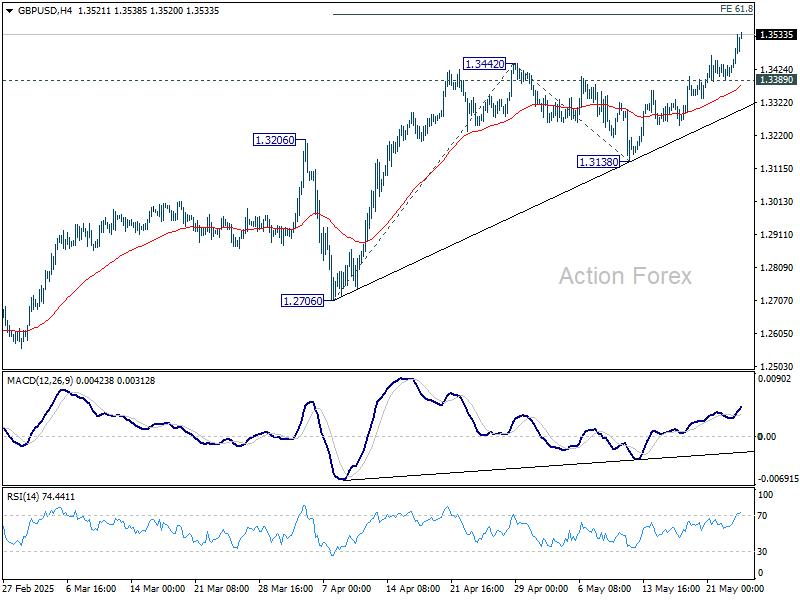
GBP/USD's up trend resumed by breaking through 1.3442 resistance last week. Initial bias remains on the upside this week for 61.8% projection of 1.2706 to 1.3442 from 1.3138 at 1.3593, and then 100% projection at 1.3874. On the downside, below 1.3389 minor support will turn intraday bias neutral again first.
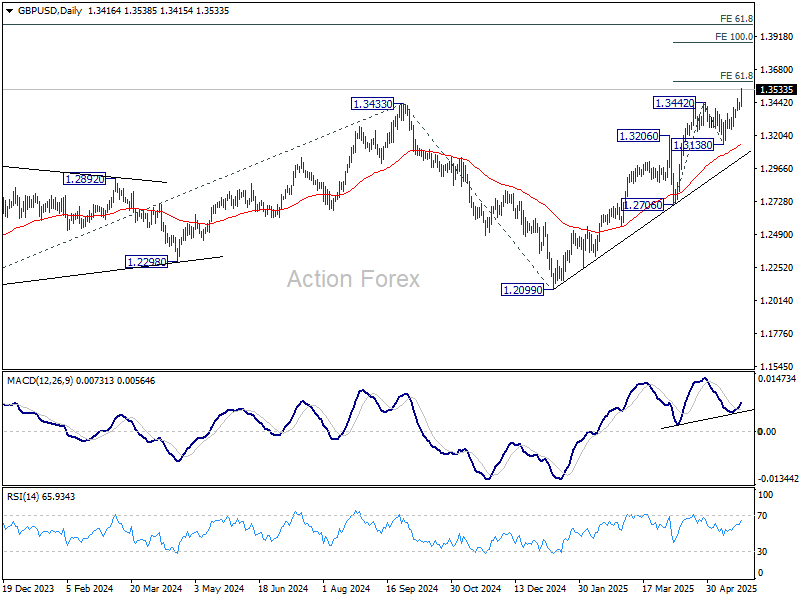
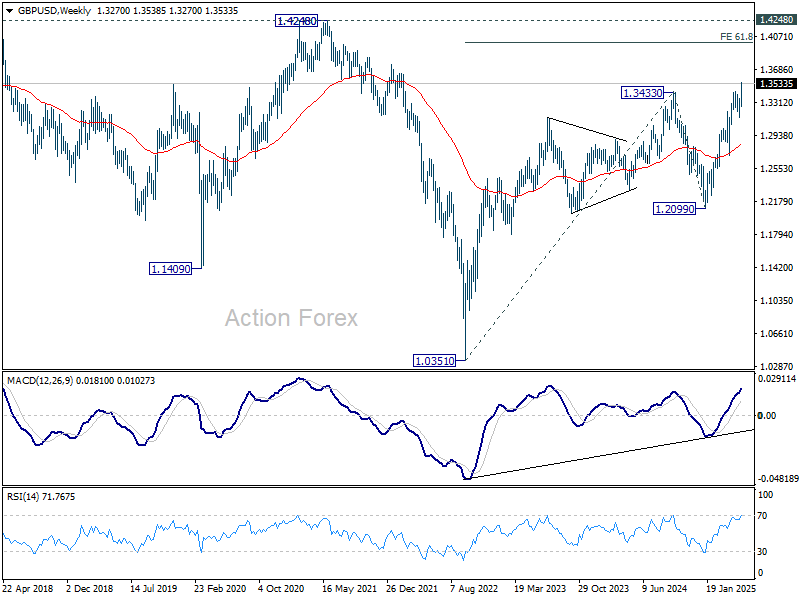
In the bigger picture, up trend from 1.3051 (2022 low) is in progress. Next medium term target is 61.8% projection of 1.0351 to 1.3433 from 1.2099 at 1.4004. Outlook will now stay bullish as long as 55 W EMA (now at 1.2843) holds, even in case of deep pullback.
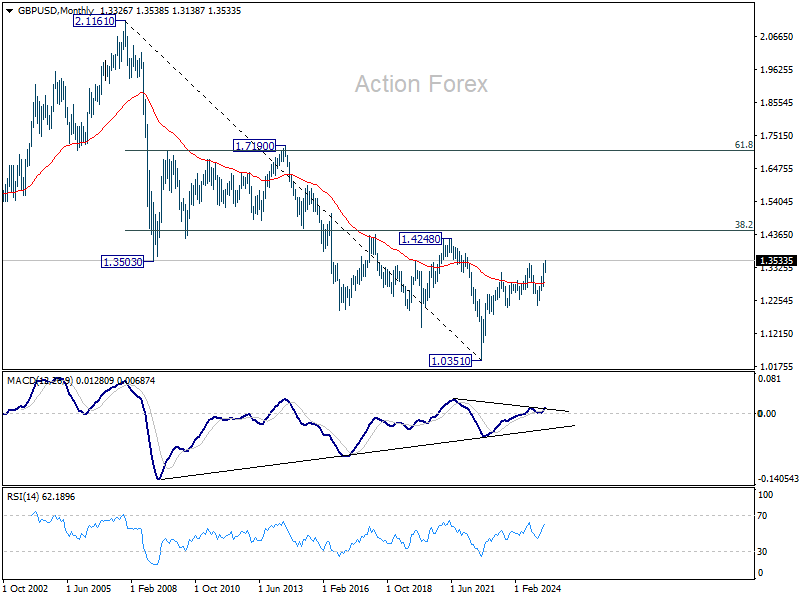
In the long term picture, for now, price actions from 1.0351 (2022 low) are still seen as a corrective pattern to the long term down trend from 2.1161 (2007 high) only. However, firm break of 1.4248 resistance (38.2% retracement of 2.1161 to 1.0351 at 1.4480) will be a strong sign of long term bullish reversal.
EUR/USD Weekly Outlook
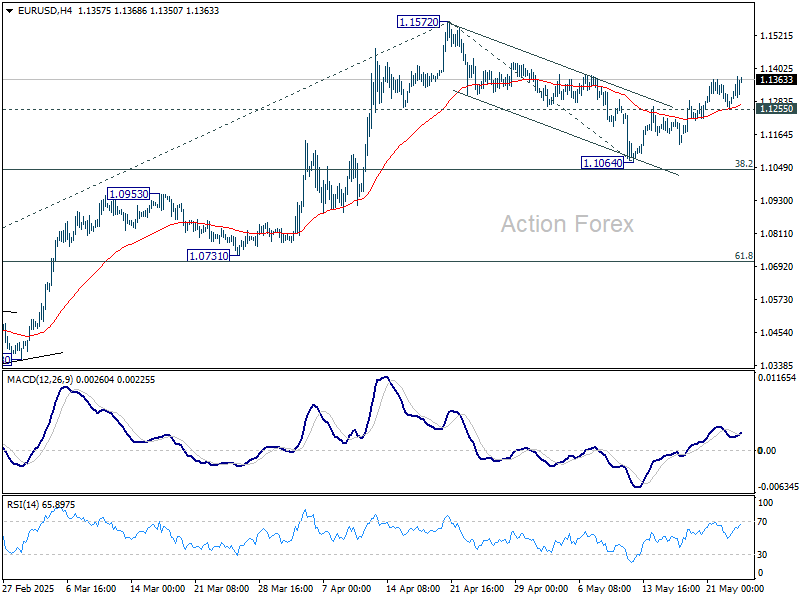
EUR/USD's extended rally last week suggests that corrective fall from 1.1572 has already completed at 1.1064. Initial bias stays on the upside this week for retesting 1.1572 first. Firm break there will resume larger up trend to 61.8% projection of 1.0176 to 1.1572 from 1.1064 at 1.1927. However, below 1.1255 minor support will dampen this view and turn intraday bias neutral again.
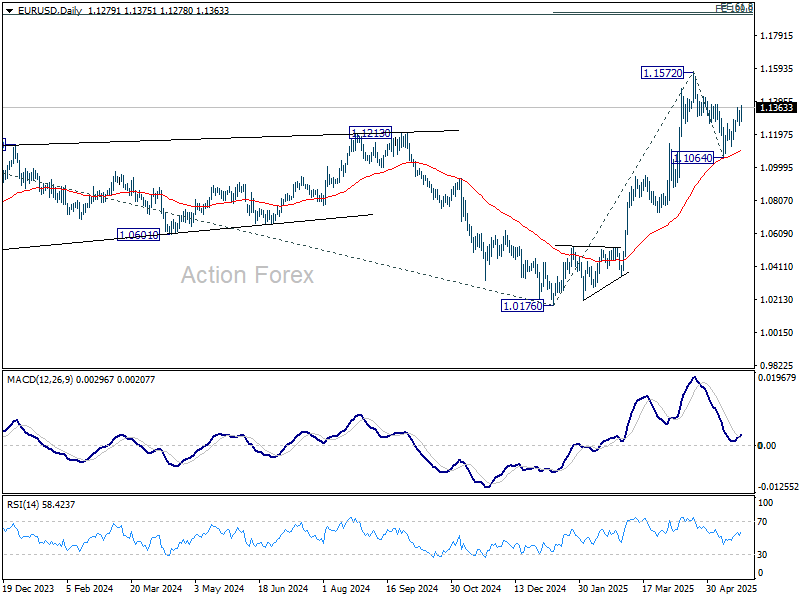
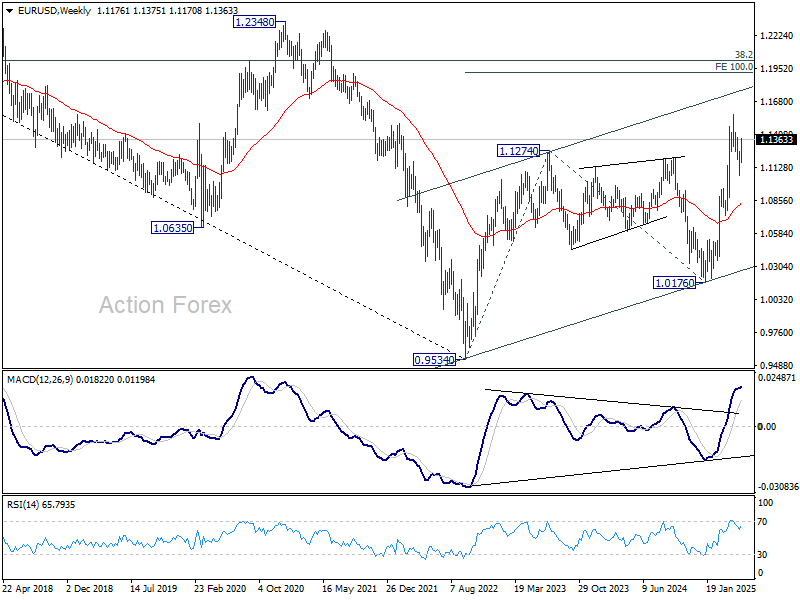
In the bigger picture, rise from 0.9534 long term bottom could be correcting the multi-decade downtrend or the start of a long term up trend. In either case, further rise should be seen to 100% projection of 0.9534 to 1.1274 from 1.0176 at 1.1916. This will now remain the favored case as long as 55 W EMA (now at 1.0837) holds.
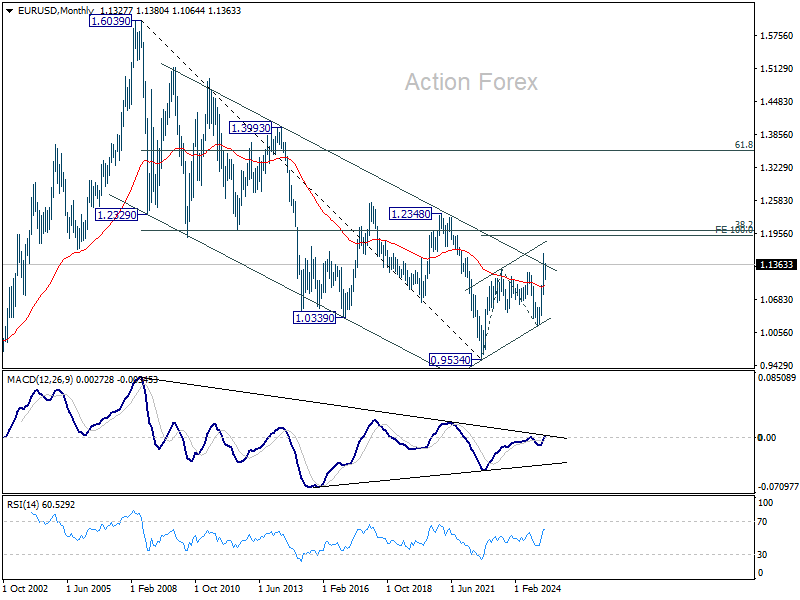
In the long term picture, the case of long term bullish reversal is building up. Sustained break of falling channel resistance (now at around 1.1300) will argue that the down trend from 1.6039 (2008 high) has completed at 0.9534. A medium term up trend should then follow even as a corrective move. Next target is 38.2% retracement of 1.6039 to 0.9534 at 1.2019.
USD/JPY Weekly Outlook
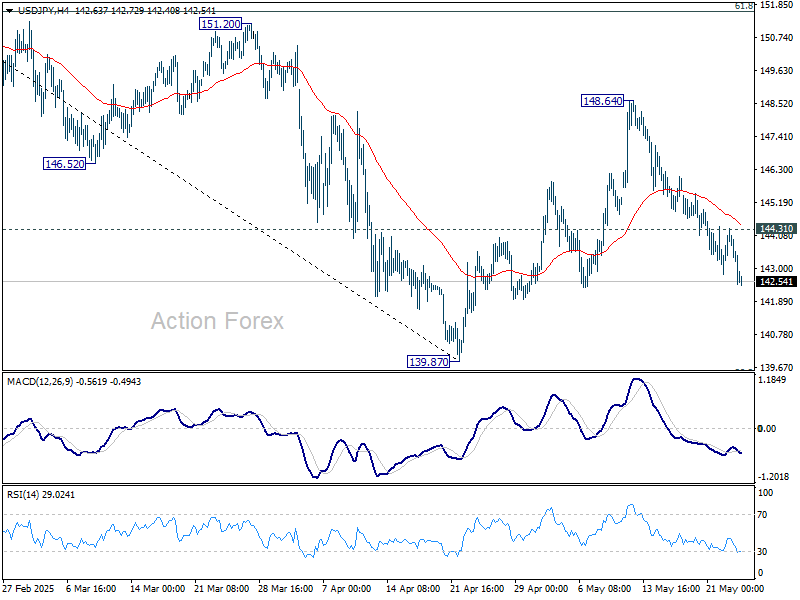
USD/JPY's extended decline last week suggests that rebound from 139.87 has already completed at a corrective move to 148.64. Initial bias remains on the downside tis week for retesting 139.87 low. On the upside, above 144.31 minor resistance will turn intraday bias neutral again first.
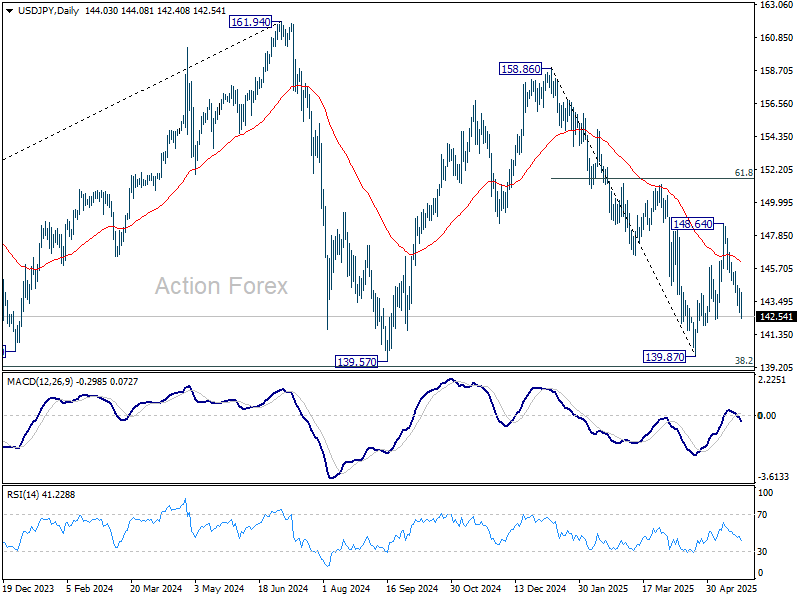
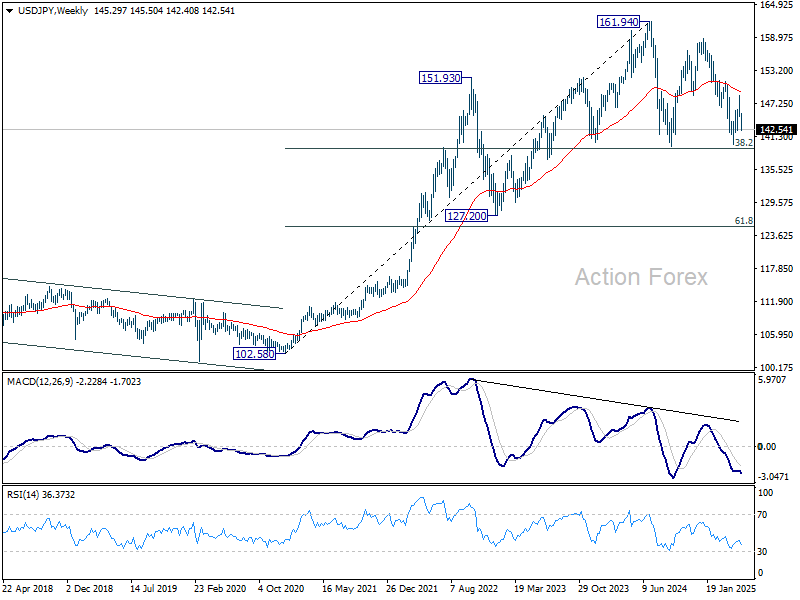
In the bigger picture, price actions from 161.94 are seen as a corrective pattern to rise from 102.58 (2021 low), with fall from 158.86 as the third leg. Strong support should be seen from 38.2% retracement of 102.58 to 161.94 at 139.26 to bring rebound. However, sustained break of 139.26 would open up deeper medium term decline to 61.8% retracement at 125.25.
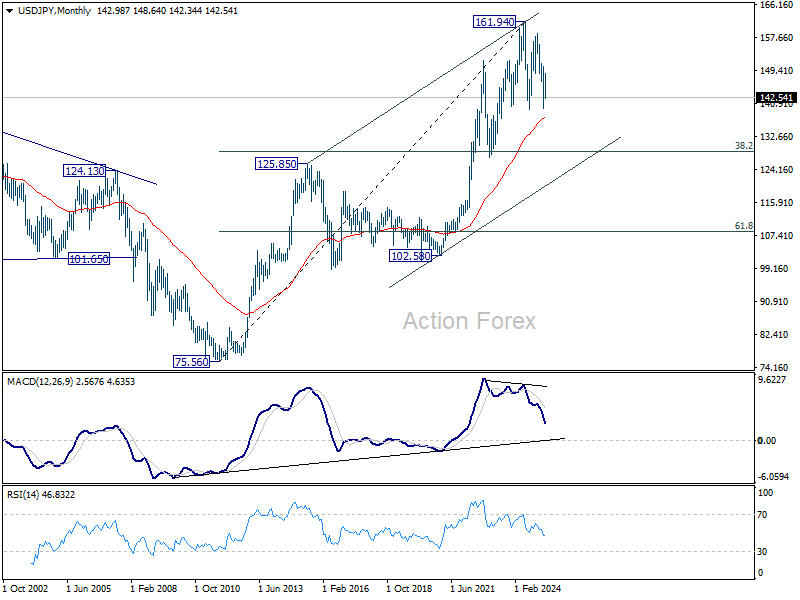
In the long term picture, it's still early to conclude that up trend from 75.56 (2011 low) has completed. A medium term corrective phase should have commenced, with risk of deep correction towards 55 M EMA (now at 137.17) and even below.
GBP/USD Weekly Outlook
GBP/USD's up trend resumed by breaking through 1.3442 resistance last week. Initial bias remains on the upside this week for 61.8% projection of 1.2706 to 1.3442 from 1.3138 at 1.3593, and then 100% projection at 1.3874. On the downside, below 1.3389 minor support will turn intraday bias neutral again first.
In the bigger picture, up trend from 1.3051 (2022 low) is in progress. Next medium term target is 61.8% projection of 1.0351 to 1.3433 from 1.2099 at 1.4004. Outlook will now stay bullish as long as 55 W EMA (now at 1.2843) holds, even in case of deep pullback.
In the long term picture, for now, price actions from 1.0351 (2022 low) are still seen as a corrective pattern to the long term down trend from 2.1161 (2007 high) only. However, firm break of 1.4248 resistance (38.2% retracement of 2.1161 to 1.0351 at 1.4480) will be a strong sign of long term bullish reversal.
USD/CHF Weekly Outlook
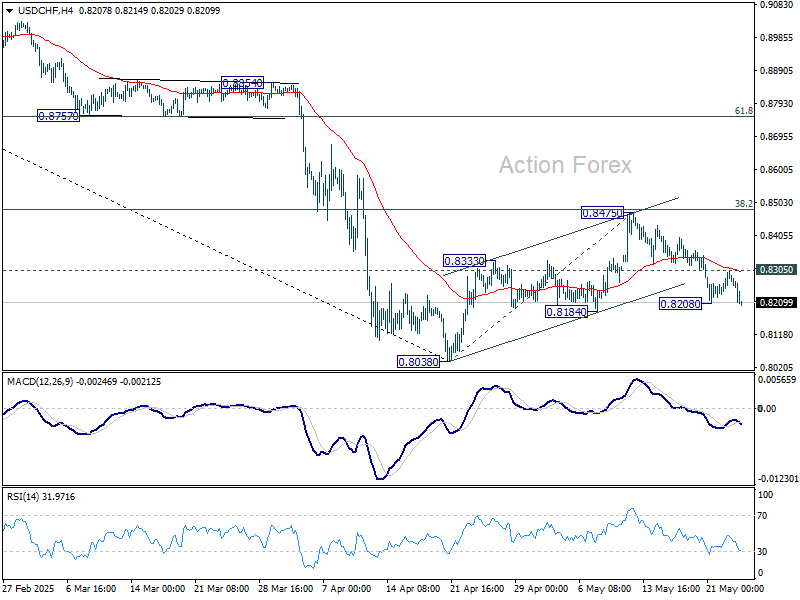
USD/CHF's extended decline last week suggest that rebound from 0.8038 has completed as a three-wave correction to 0.8475. Initial bias is now on the downside with late breach of 0.8208 temporary low. Deeper fall should be seen to retest 0.8038 low. Firm break there will resume larger down trend to 61.8% projection of 0.9200 to 0.8038 from 0.8475 at 0.7757 next. On the upside, above 0.8305 minor resistance will turn intraday bias neutral again first.
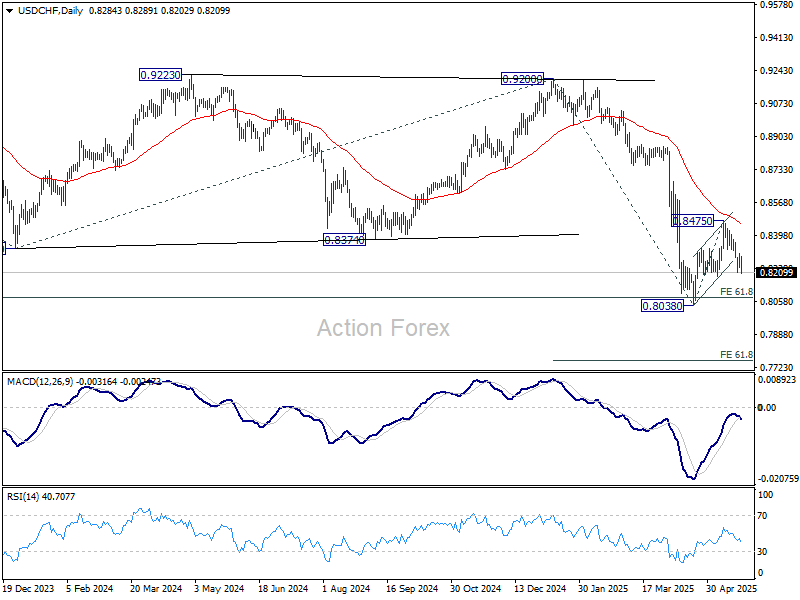
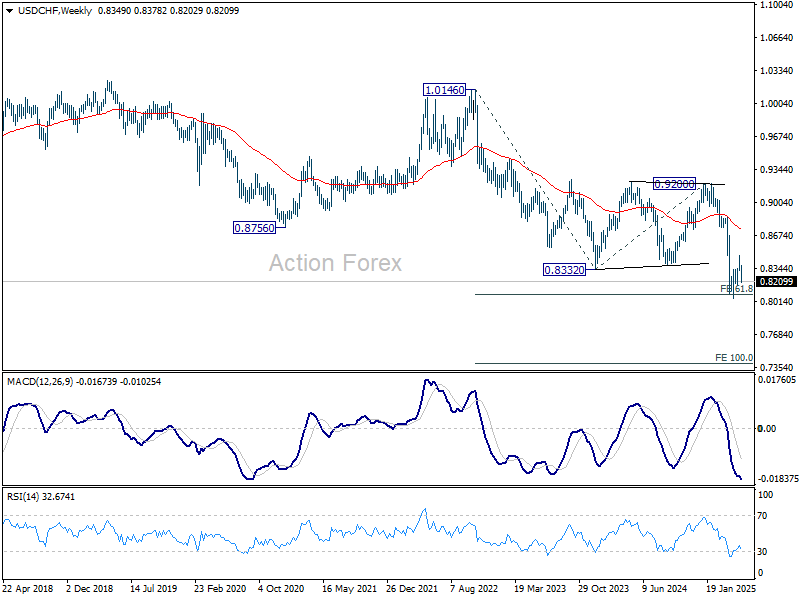
In the bigger picture, long term down trend from 1.0342 (2017 high) is still in progress and met 61.8% projection of 1.0146 (2022 high) to 0.8332 from 0.9200 at 0.8079 already. In any case, outlook will stay bearish as long as 55 W EMA (now at 0.8732) holds. Sustained break of 0.8079 will target 100% projection at 0.7382.
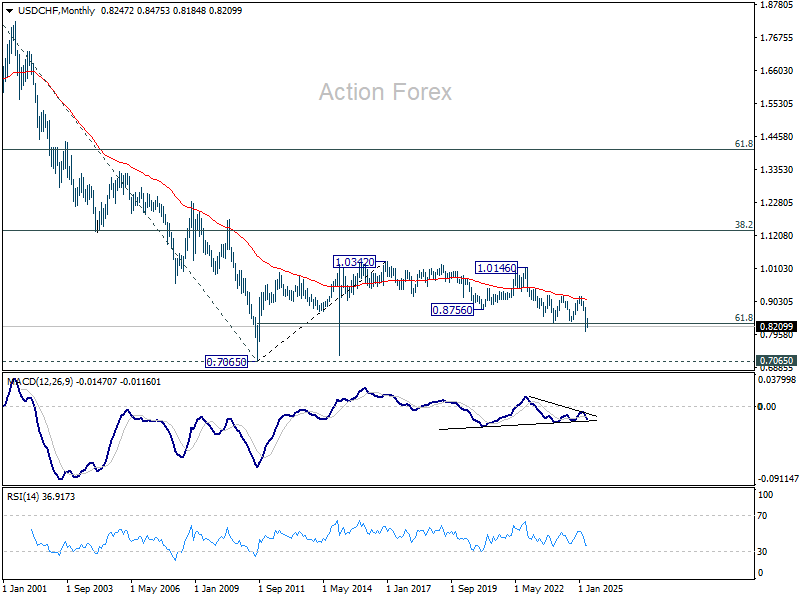
In the long term picture, price action from 0.7065 (2011 low ) are seen as a corrective pattern to the multi-decade down trend from 1.8305 (2000 high). It's uncertain if the fall from 1.0342 is the second leg of the pattern, or resumption of the down trend. But in either case, sustained trading below 61.8% retracement of 0.7065 to 1.0342 at 0.8317 will pave the way back to 0.7065.
AUD/USD Weekly Report
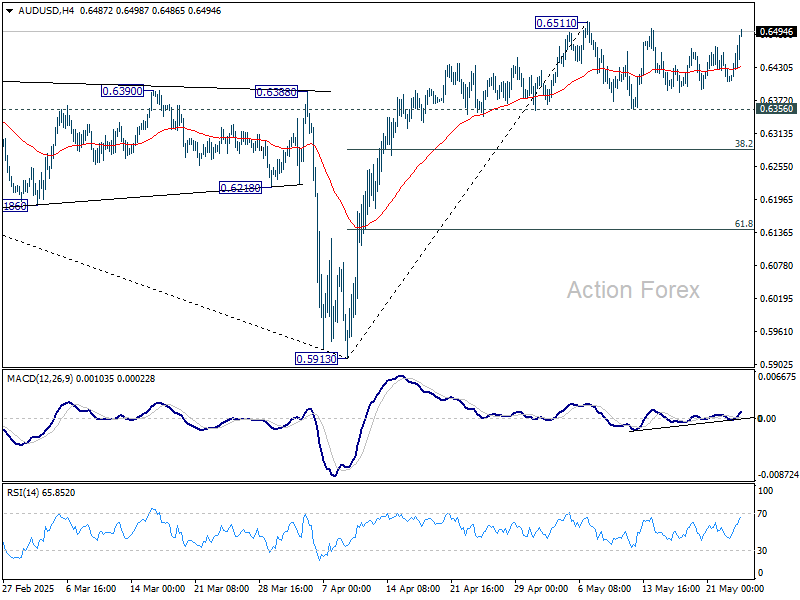
AUD/USD was still bounded in range trading below 0.6511 last week and outlook is unchanged. Initial bias remains neutral and further rally is expected with 0.6356 support intact. One the upside, break of 0.6511 will resume the rise from 0.5913 and target 61.8% retracement of 0.6941 to 0.5913 at 0.6548. However, firm break of 0.6356 will bring deeper pullback to 38.2% retracement of 0.5913 to 0.6511 at 0.6283 first.
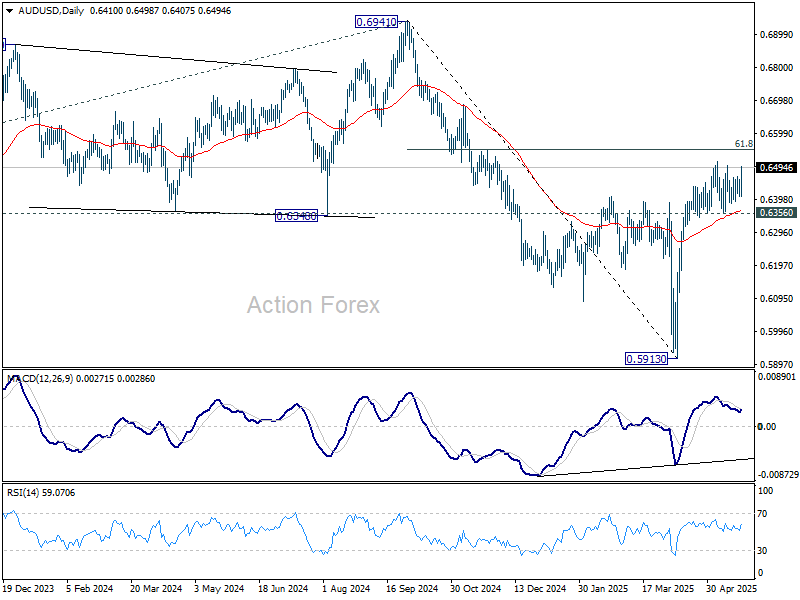
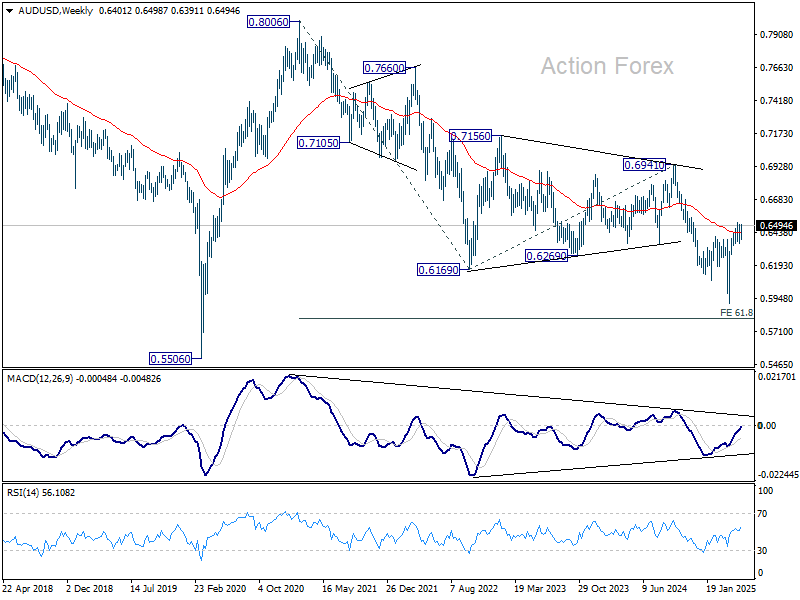
In the bigger picture, as long as 55 W EMA (now at 0.6439) holds, down trend from 0.8006 (2021 high) should resume later to 61.8% projection of 0.8006 to 0.6169 from 0.6941 at 0.5806. However, sustained trading above 55 W EMA will argue that a medium term bottom was already formed, and set up further rebound to 0.6941 resistance instead.
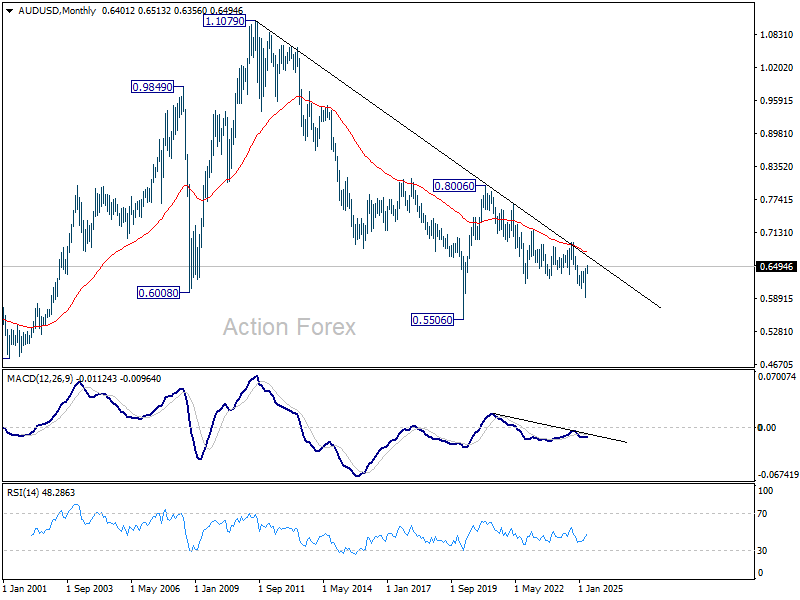
In the long term picture, fall from 0.8006 is seen as the second leg of the corrective pattern from 0.5506 long term bottom (2020 low). Hence, in case of deeper decline, strong support should emerge above 0.5506 to contain downside to bring reversal. On the upside, firm break of 0.6941 will argue that the third leg has already started back to 0.8006.
USD/CAD Weekly Outlook
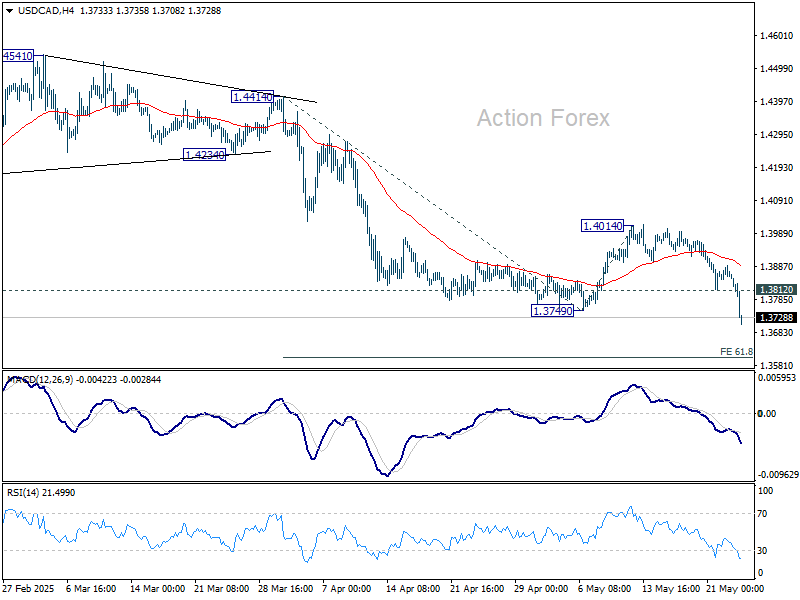
USD/CAD's late break of 1.3749 confirms resumption of the whole decline from 1.4791. Initial bias is back on the downside this week. Next near term target if 61.8% projection of 1.4414 to 1.3749 from 1.4014 at 1.3603. On the upside, above 1.3812 minor resistance will turn intraday bias neutral again first. But outlook will remain bearish as long as 1.4014 resistance holds, in case of recovery.
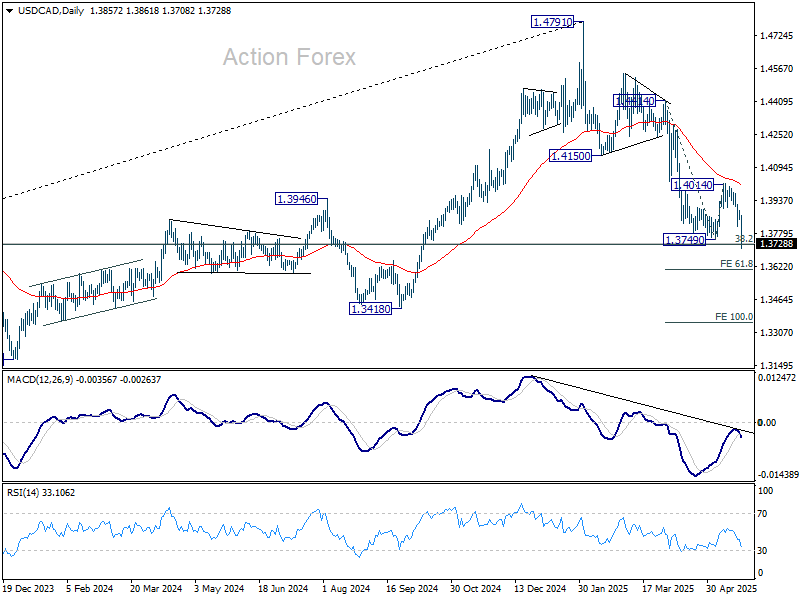
In the bigger picture, price actions from 1.4791 medium term top could either be a correction to rise from 1.2005 (2021 low), or trend reversal. In either case, further decline is expected as long as 1.4150 resistance turned support holds. Firm break of 38.2% retracement of 1.2005 (2021 low) to 1.4791 at 1.3727 will pave the way back to 61.8% retracement at 1.3069.
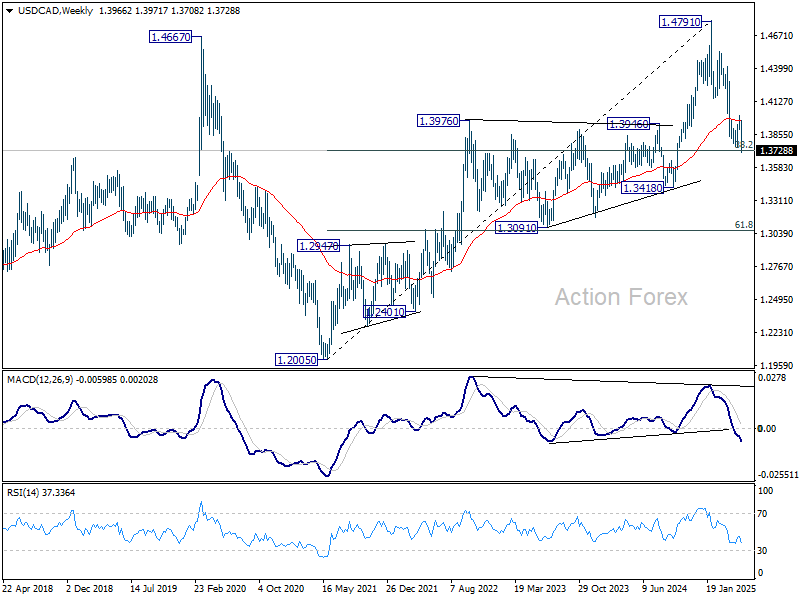
In the long term picture, as long as 55 M EMA (now at 1.3476) holds, up trend from 0.9056 (2007 low) should still resume through 1.4791 at a later stage. However, sustained trading below 55 M EMA will argue that the up trend has already completed, with rise from 1.2005 to 1.4791 as the fifth wave. 1.4791 would then be seen as a long term top and deeper medium term down trend should then follow.

GBP/JPY Weekly Outlook
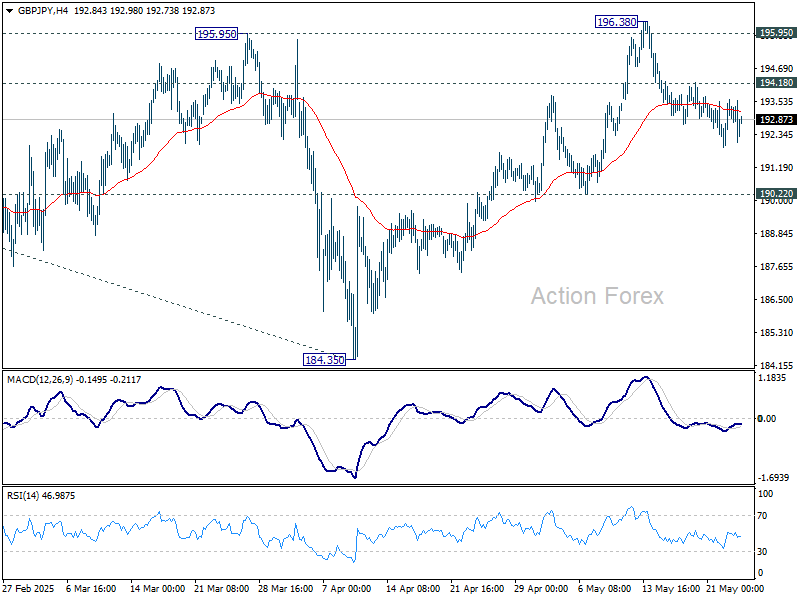
GBP/JPY's decline from 196.38 extender lower last week but stayed well above 190.22 structural support. Initial bias remains neutral this week first. Further rally remains in favor. On the upside, above 194.18 resistance will suggest that the pull back has completed and bring stronger rise back to 196.38. However, sustained break of 190.22 will indicate near term reversal.
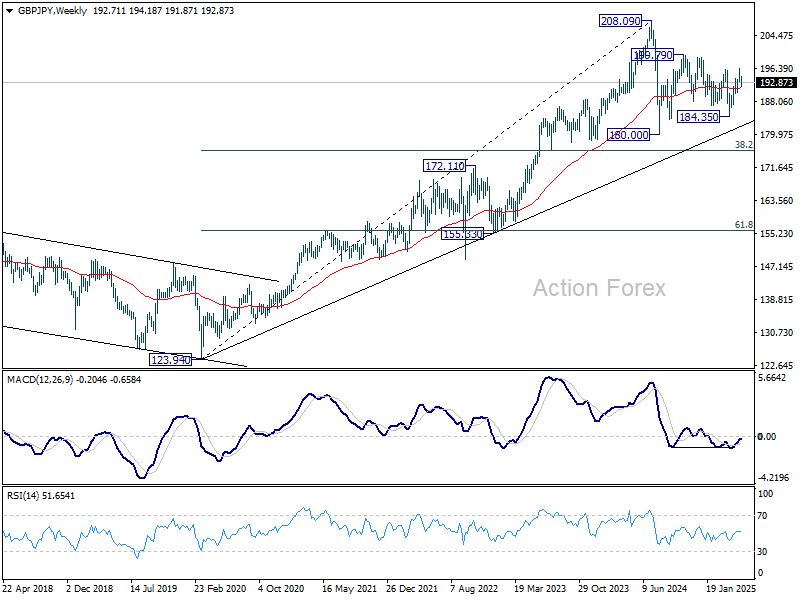
In the bigger picture, price actions from 208.09 are seen as a correction to rally from 123.94 (2020 low). Strong support should be seen from 38.2% retracement of 123.94 to 208.09 at 175.94 to contain downside. However, sustained break of 175.94 will bring deeper fall even still as a correction.
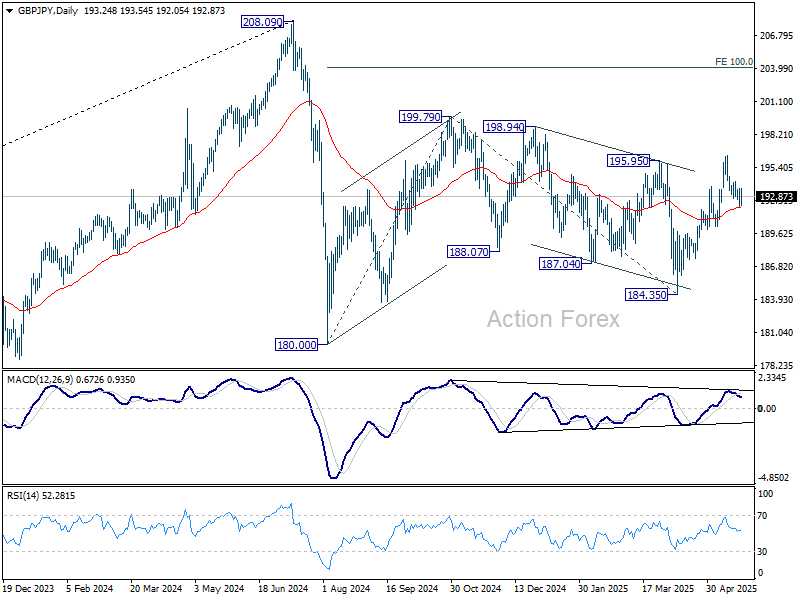
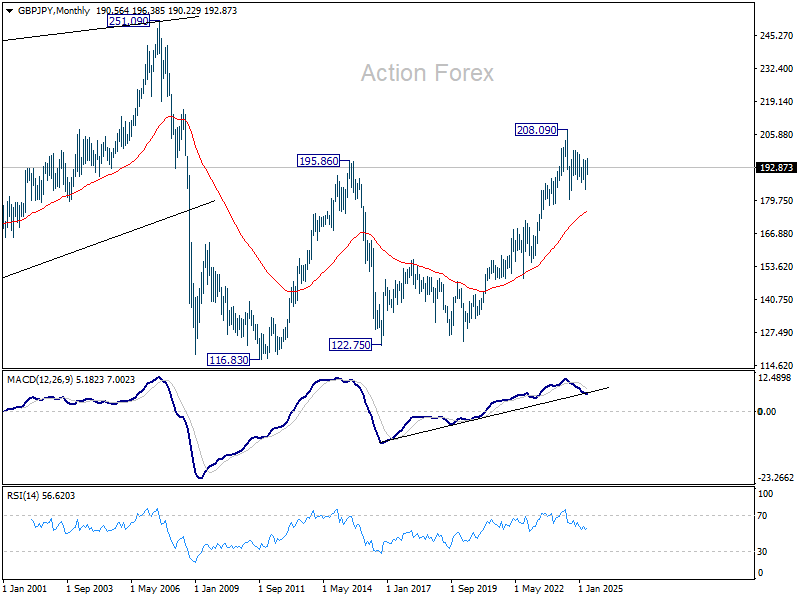
In the longer term picture, while a medium term top was formed at 208.09 (2024 high), it's still early to conclude that the up trend from 122.75 (2016 low) has completed. But GBP/JPY is at least in a medium term corrective phase, with risk of correction to 55 M EMA (now at 175.85).
EUR/JPY Weekly Outlook
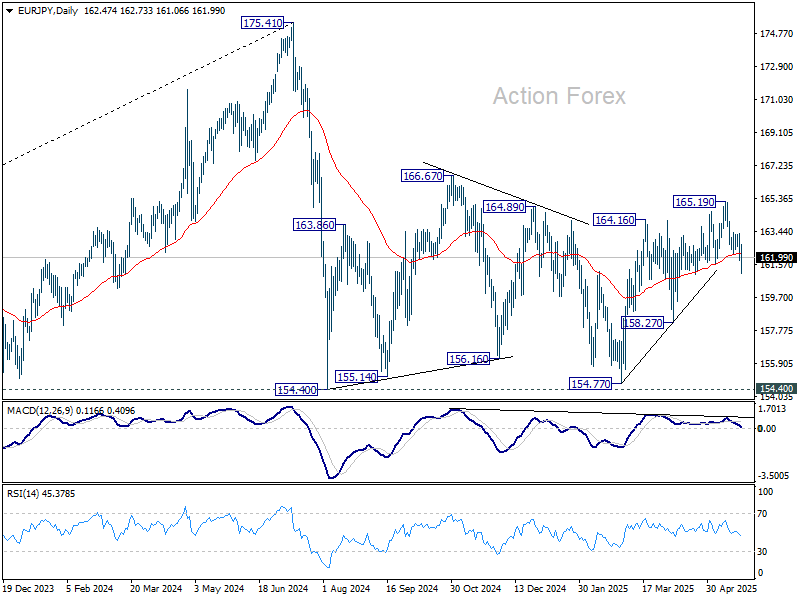
EUR/JPY's decline from 165.19 extended lower last week and the break of 161.57 support argues that rise from 154.77 might have completed. Initial bias is back on the downside this week for 158.27 support next. Nevertheless, on the upside, break of 163.35 resistance will revive near term bullishness, and bring retest of 165.19 instead.
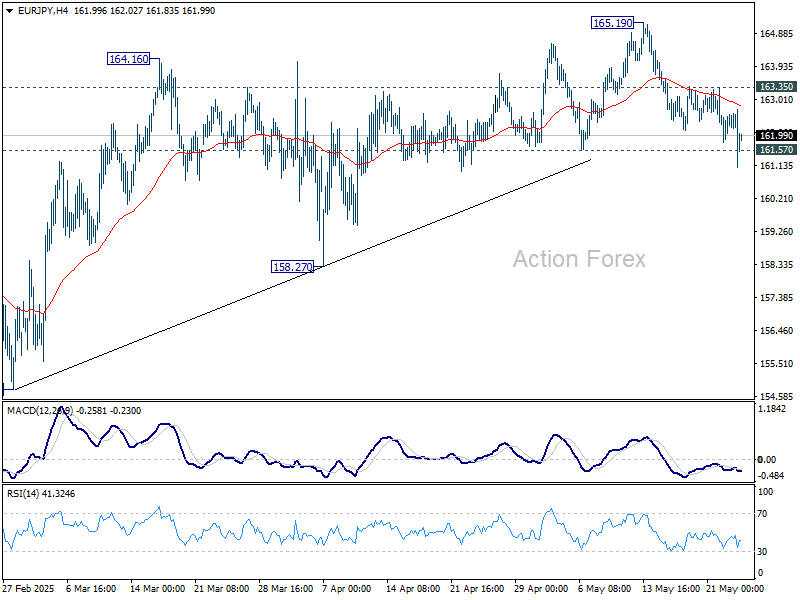
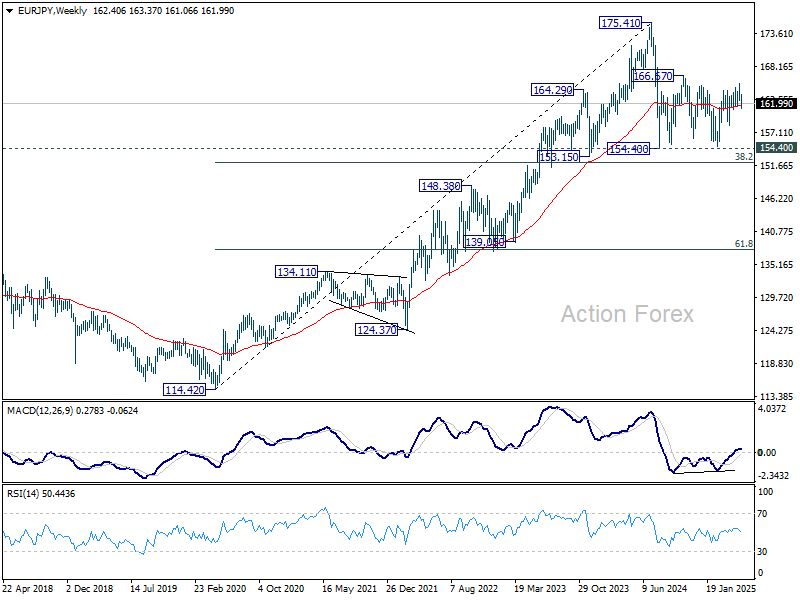
In the bigger picture, price actions from 175.41 are seen as correction to rally from 114.42 (2020 low). Strong support should be seen from 38.2% retracement of 114.42 to 175.41 at 152.11 to contain downside. However, sustained break of 152.11 will bring deeper fall even still as a correction.
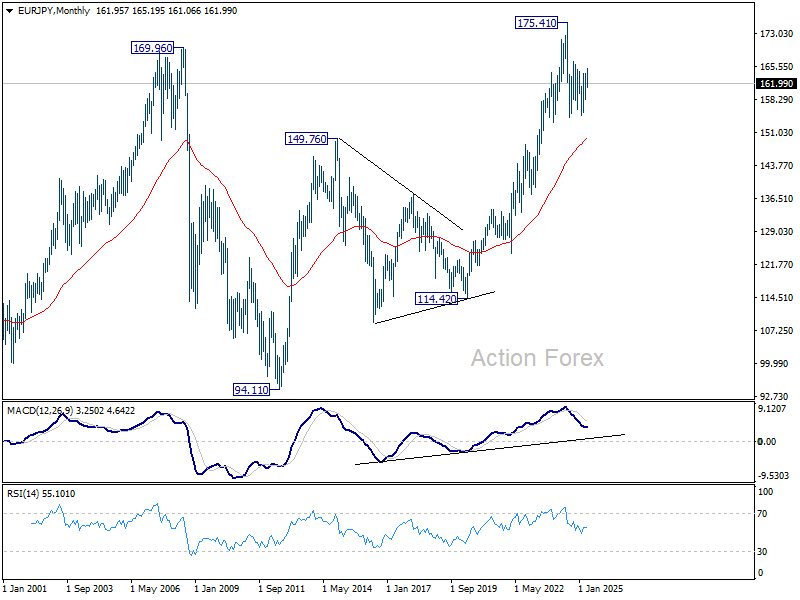
In the long term picture, while 175.41 is at least a medium term top, it's still early to conclude that up trend from 94.11 (2012 low) has completed. A medium term corrective phase is in progress with risk of deeper fall back to 55 M EMA (now at 149.91).
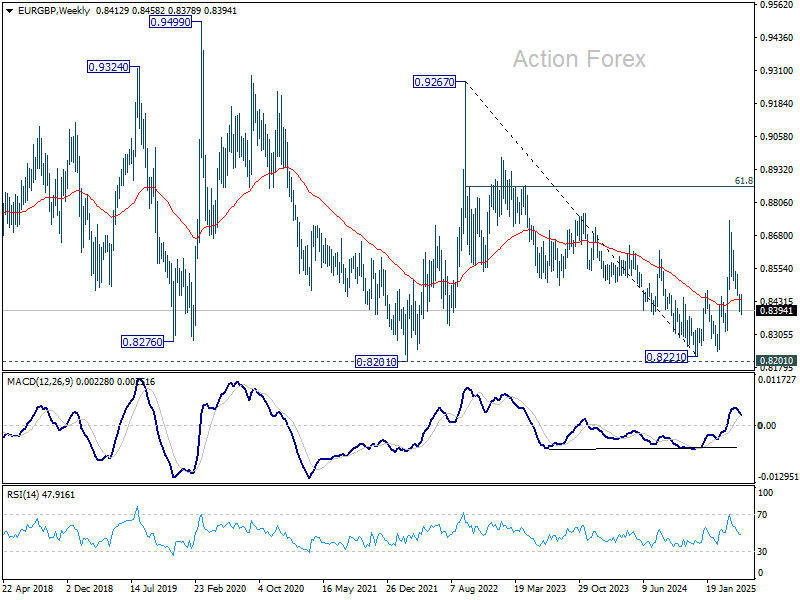
EUR/GBP Weekly Outlook
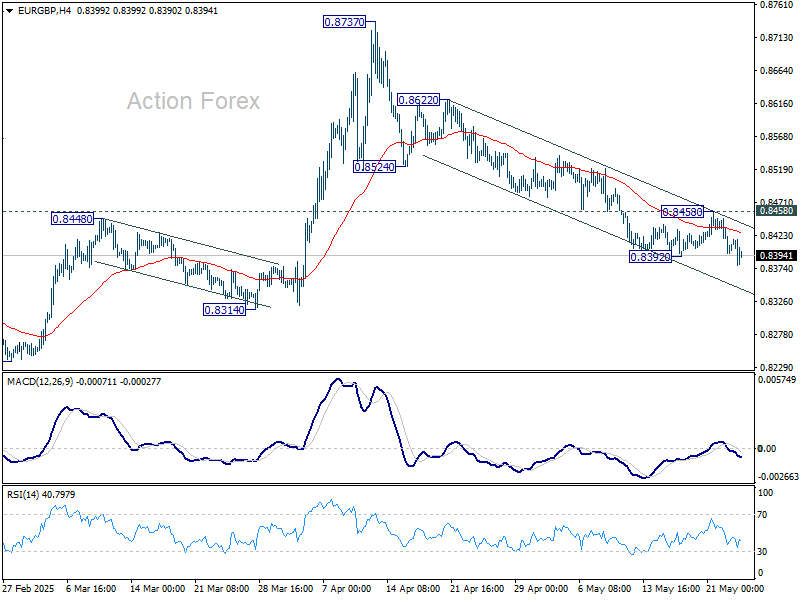
EUR/GBP's decline from 0.8737 is still in progress. With the late break of 0.8392 temporary low, initial bias is back on the downside this week. Further fall should be seen to 0.8314 support first, and then 0.8239 low. On the upside, above 0.8458 resistance should indicate short term bottoming, likely with bullish convergence condition in 4H MACD, and turn bias back to the upside for stronger rebound.
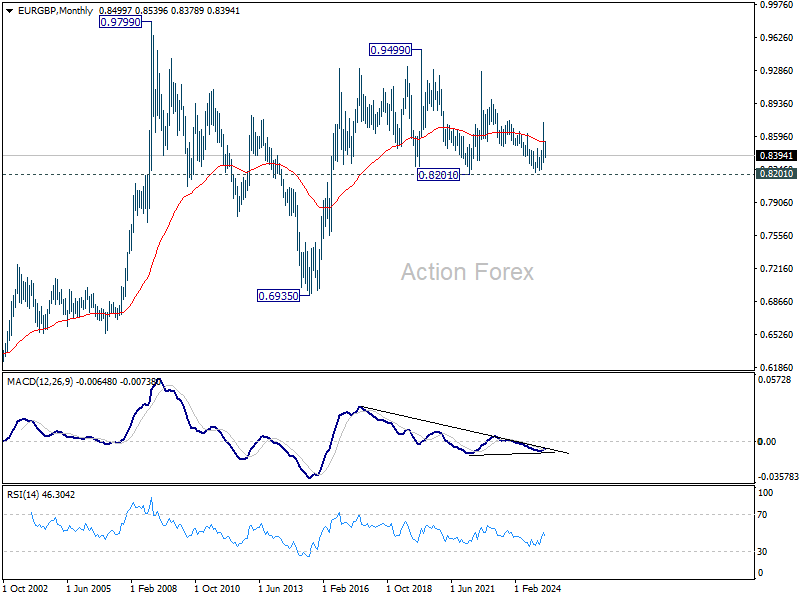
In the bigger picture, current development suggests that price actions from 0.8221 medium term bottom are merely forming a corrective pattern. However, there is no clear momentum to break through 0.8201 key support (2022 low) yet. Hence, range trading is expected between 0.8221/8737 for now.
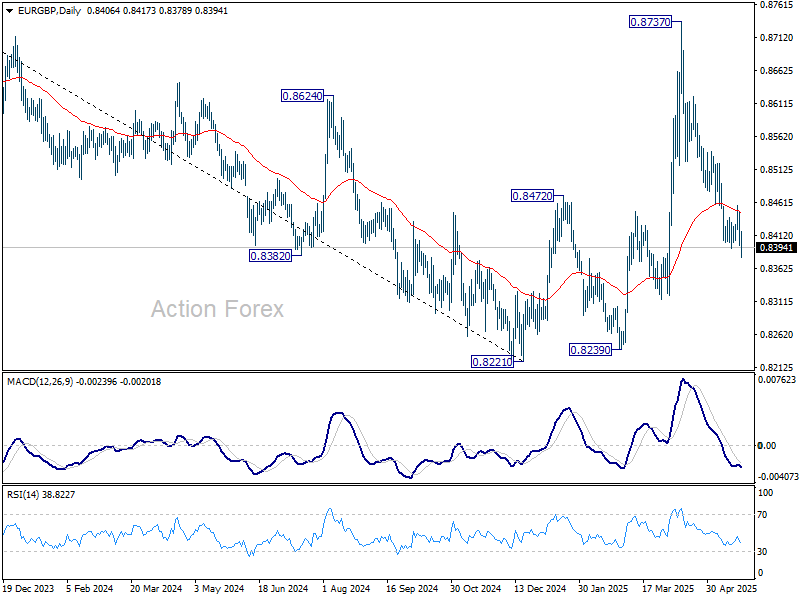
In the long term picture, price action from 0.9499 (2020 high) is seen as part of the long term range pattern from 0.9799 (2008 high). Range trading should continue between 0.8201 and 0.9499, until there is clear signal of imminent breakout.