Sample Category Title
EUR/USD Mid-Day Outlook
Daily Pivots: (S1) 1.1303; (P) 1.1339; (R1) 1.1402; More...
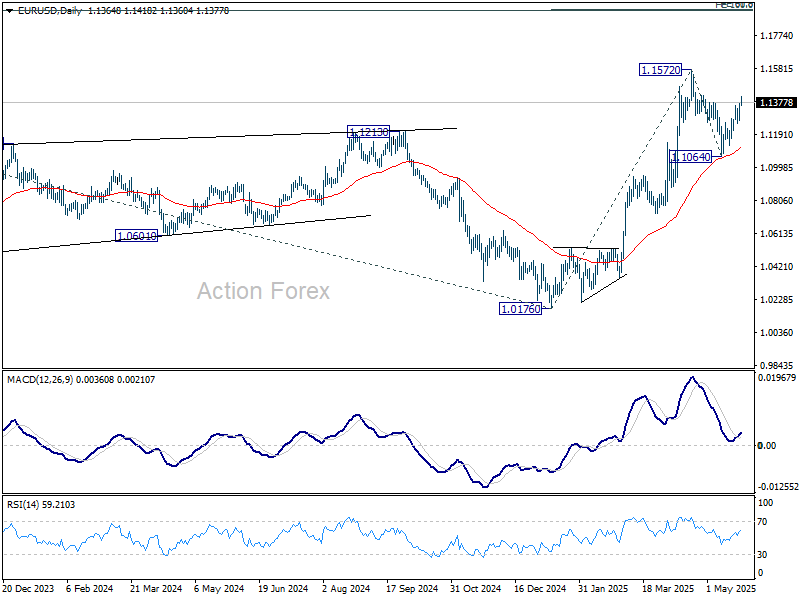
Intraday bias in EUR/USD remains on the upside for the moment. Correction from 1.1572 should have completed at 1.1064. Further rise should be seen to retest 1.1572 first. Decisive break there will resume larger up trend to 61.8% projection of 1.0176 to 1.1572 from 1.1064 at 1.1927. On the downside, below 1.1255 minor support will turn intraday bias neutral, and probably extend the corrective pattern with another falling leg.
In the bigger picture, rise from 0.9534 long term bottom could be correcting the multi-decade downtrend or the start of a long term up trend. In either case, further rise should be seen to 100% projection of 0.9534 to 1.1274 from 1.0176 at 1.1916. This will now remain the favored case as long as 55 W EMA (now at 1.0858) holds.
Risk Appetite Returns After Trump Backs Off Immediate EU Tariff Threat
Global markets are showing tentative signs of relief after US President Donald Trump walked back his threat to impose a 50% tariff on the European Union. The abrupt shift to reinstate a July 9 deadline for negotiations has helped ease investor concerns for now. Stocks in Germany and France are trading modestly higher in European session, though the UK market remains closed for holiday. US equity futures are also pointing to a firmer open, suggesting a rebound from last week's tariff-induced selloff. This shift in tone has also taken some steam out of safe-haven flows. Gold prices dipped slightly as investors rotated back into risk assets.
The European Commission confirmed that trade representatives from both sides are scheduled to talk later today, describing the development as a “new impetus”. A Commission spokesperson noted that both parties have agreed to fast-track negotiations and remain in close contact, providing hope that a workable framework could still be reached before the "old" deadline.
In the currency markets, the mildly risk-on environment is supporting higher-beta currencies. Kiwi and Aussie are leading the pack, with Sterling also gaining some traction. On the other hand, traditional safe havens like Yen, Swiss Franc are under modest pressure, while Dollar is also weak. Euro and Loonie positioning in the middle.
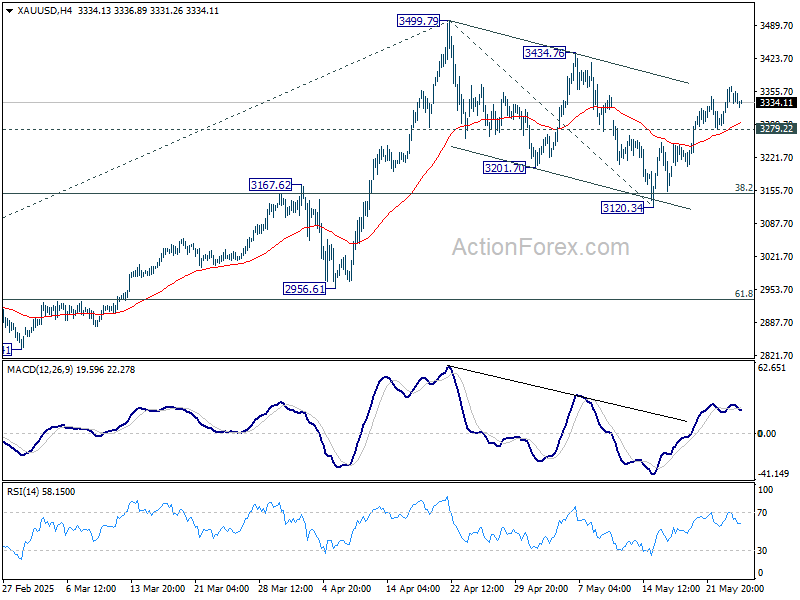
For Gold, as long as 3279.22 support holds, the bullish case for Gold still holds. That is, correction from 3499.79 should have completed with three waves down to 3120.34. Further rise should be seen to retest 3499.79 next. Firm break there will resume larger up trend. Nevertheless, break of 3279.22 will dampen this case and extend the corrective pattern with another falling leg.
In Europe, the UK is on holiday. DAX is up 1.45% at the time of writing, CAC i sup 0.97%. Germany 10-year yield is up 0.011 at 2.583. Earlier in Asia, Nikkei rose 1.00%. Hong Kong HSI fell -1.35%. China Shanghai SSE fell -0.05%. Singapore Strait Times fell -0.18%. Japan 10-year JGB yield fell -0.052 to 1.496.
Fed Kashkari: Uncertainty to delay policy at least until September
Minneapolis Fed President Neel Kashkari warned today that major shifts in US trade policies are clouding the outlook for monetary policy, making it difficult for the Fed to move on interest rates before September.
While “anything is possible,” Kashkari said in an interview with Bloomberg TV, he’s unsure whether the picture will be “clear enough” by then. Much hinges, he added, on whether trade negotiations between the US and its partners yield concrete deals in the coming months, which could “provide a lot of the clarity we are looking for.”
The uncertainty, Kashkari explained, is weighing on economic activity. He emphasized the stagflationary nature of the tariff shock, noting that its impact will depend on both the scale and duration of the levies.
On financial markets, Kashkari acknowledged that rising US Treasury yields might reflect a broader reassessment by global investors about the risks of holding American assets. He suggested that the current bond market reaction could signal a new global paradigm.
EUR/USD Mid-Day Outlook
Daily Pivots: (S1) 1.1303; (P) 1.1339; (R1) 1.1402; More...
Intraday bias in EUR/USD remains on the upside for the moment. Correction from 1.1572 should have completed at 1.1064. Further rise should be seen to retest 1.1572 first. Decisive break there will resume larger up trend to 61.8% projection of 1.0176 to 1.1572 from 1.1064 at 1.1927. On the downside, below 1.1255 minor support will turn intraday bias neutral, and probably extend the corrective pattern with another falling leg.
In the bigger picture, rise from 0.9534 long term bottom could be correcting the multi-decade downtrend or the start of a long term up trend. In either case, further rise should be seen to 100% projection of 0.9534 to 1.1274 from 1.0176 at 1.1916. This will now remain the favored case as long as 55 W EMA (now at 1.0858) holds.
Gold Halts Rally as US Signals Willingness to Discuss Trade Terms with EU
The price of gold fell on Monday to $3,346 per troy ounce, pausing its recent upward trend as investors assessed the implications of a phone call between the US and the EU.
Key factors driving gold’s movement
Demand for safe-haven assets weakened after US President Donald Trump announced plans to delay proposed 50% tariffs on European goods. While he had initially intended to impose the levies from 1 June, he set a new deadline of 9 July to allow time for negotiations with the European Union.
However, trade risks persist and remain a focal point for markets. Last Friday, Trump warned Apple Inc. that its products could face 25% tariffs if iPhones are manufactured outside the US.
Gold had surged nearly 5% last week amid escalating trade uncertainty and growing concerns over the US economic and fiscal outlook.
Adding to market apprehension, Trump’s new tax bill – already passed by the House of Representatives and now awaiting a Senate vote – could expand the US budget deficit by nearly $3 trillion over the next decade. A final vote is expected by August.
Technical analysis: XAU/USD
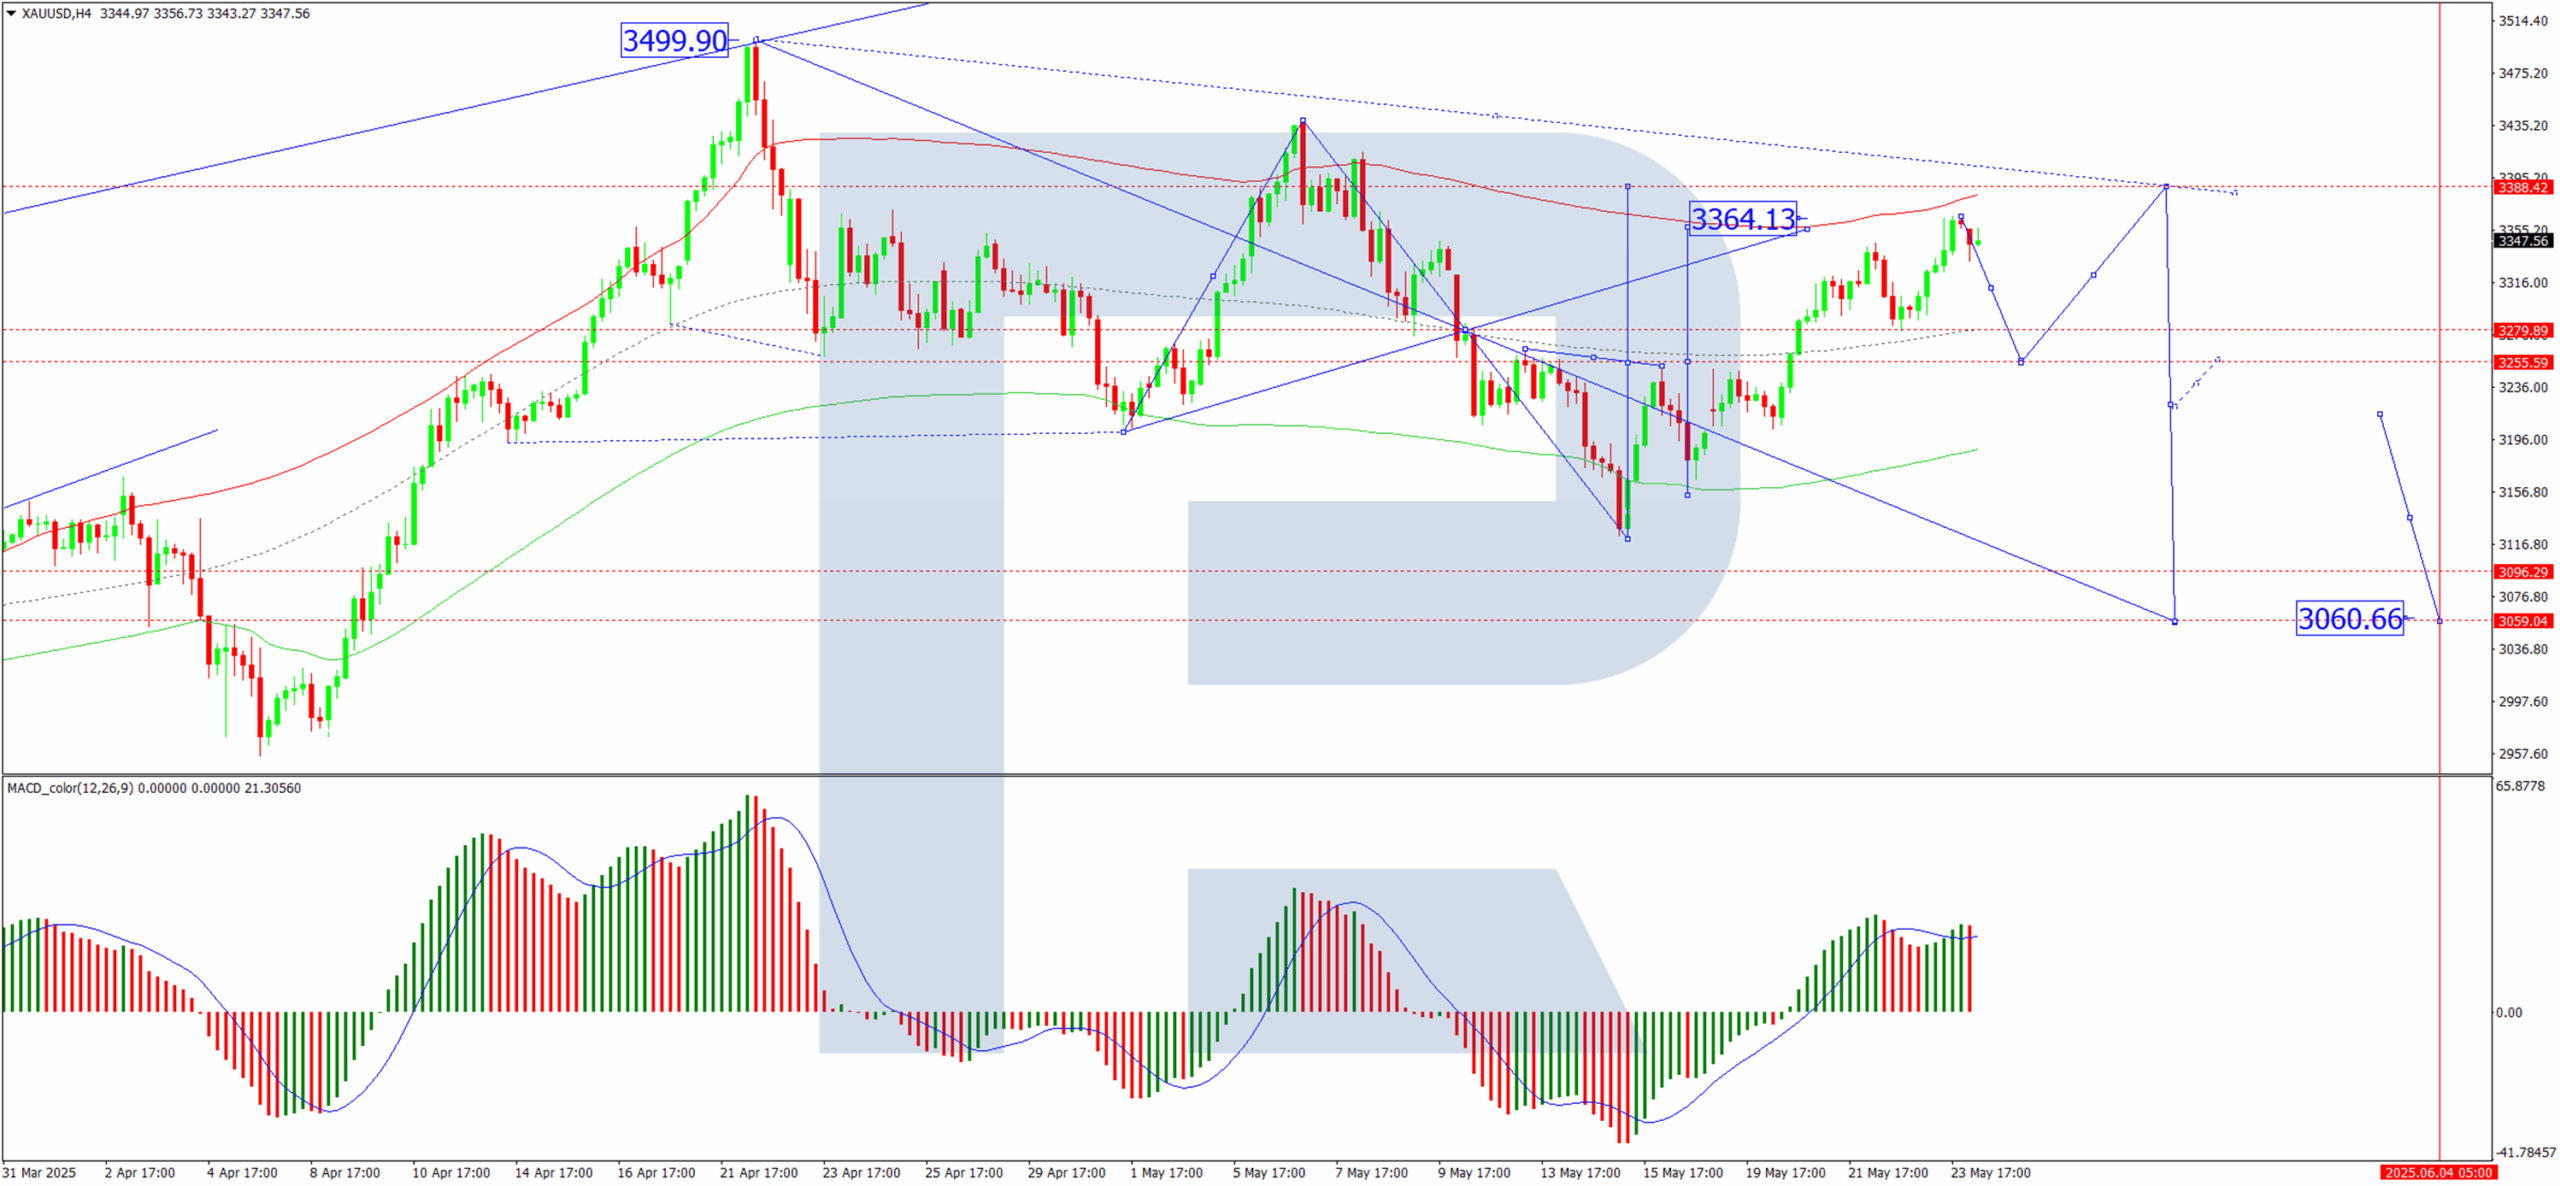
On the H4 chart, XAU/USD found support at 3,280 before rallying to 3,364. A corrective pullback towards 3,255 is possible today, followed by a potential upward move to 3,388. This scenario is supported by the MACD indicator, whose signal line has exited the histogram zone and is now pointing decisively downward.
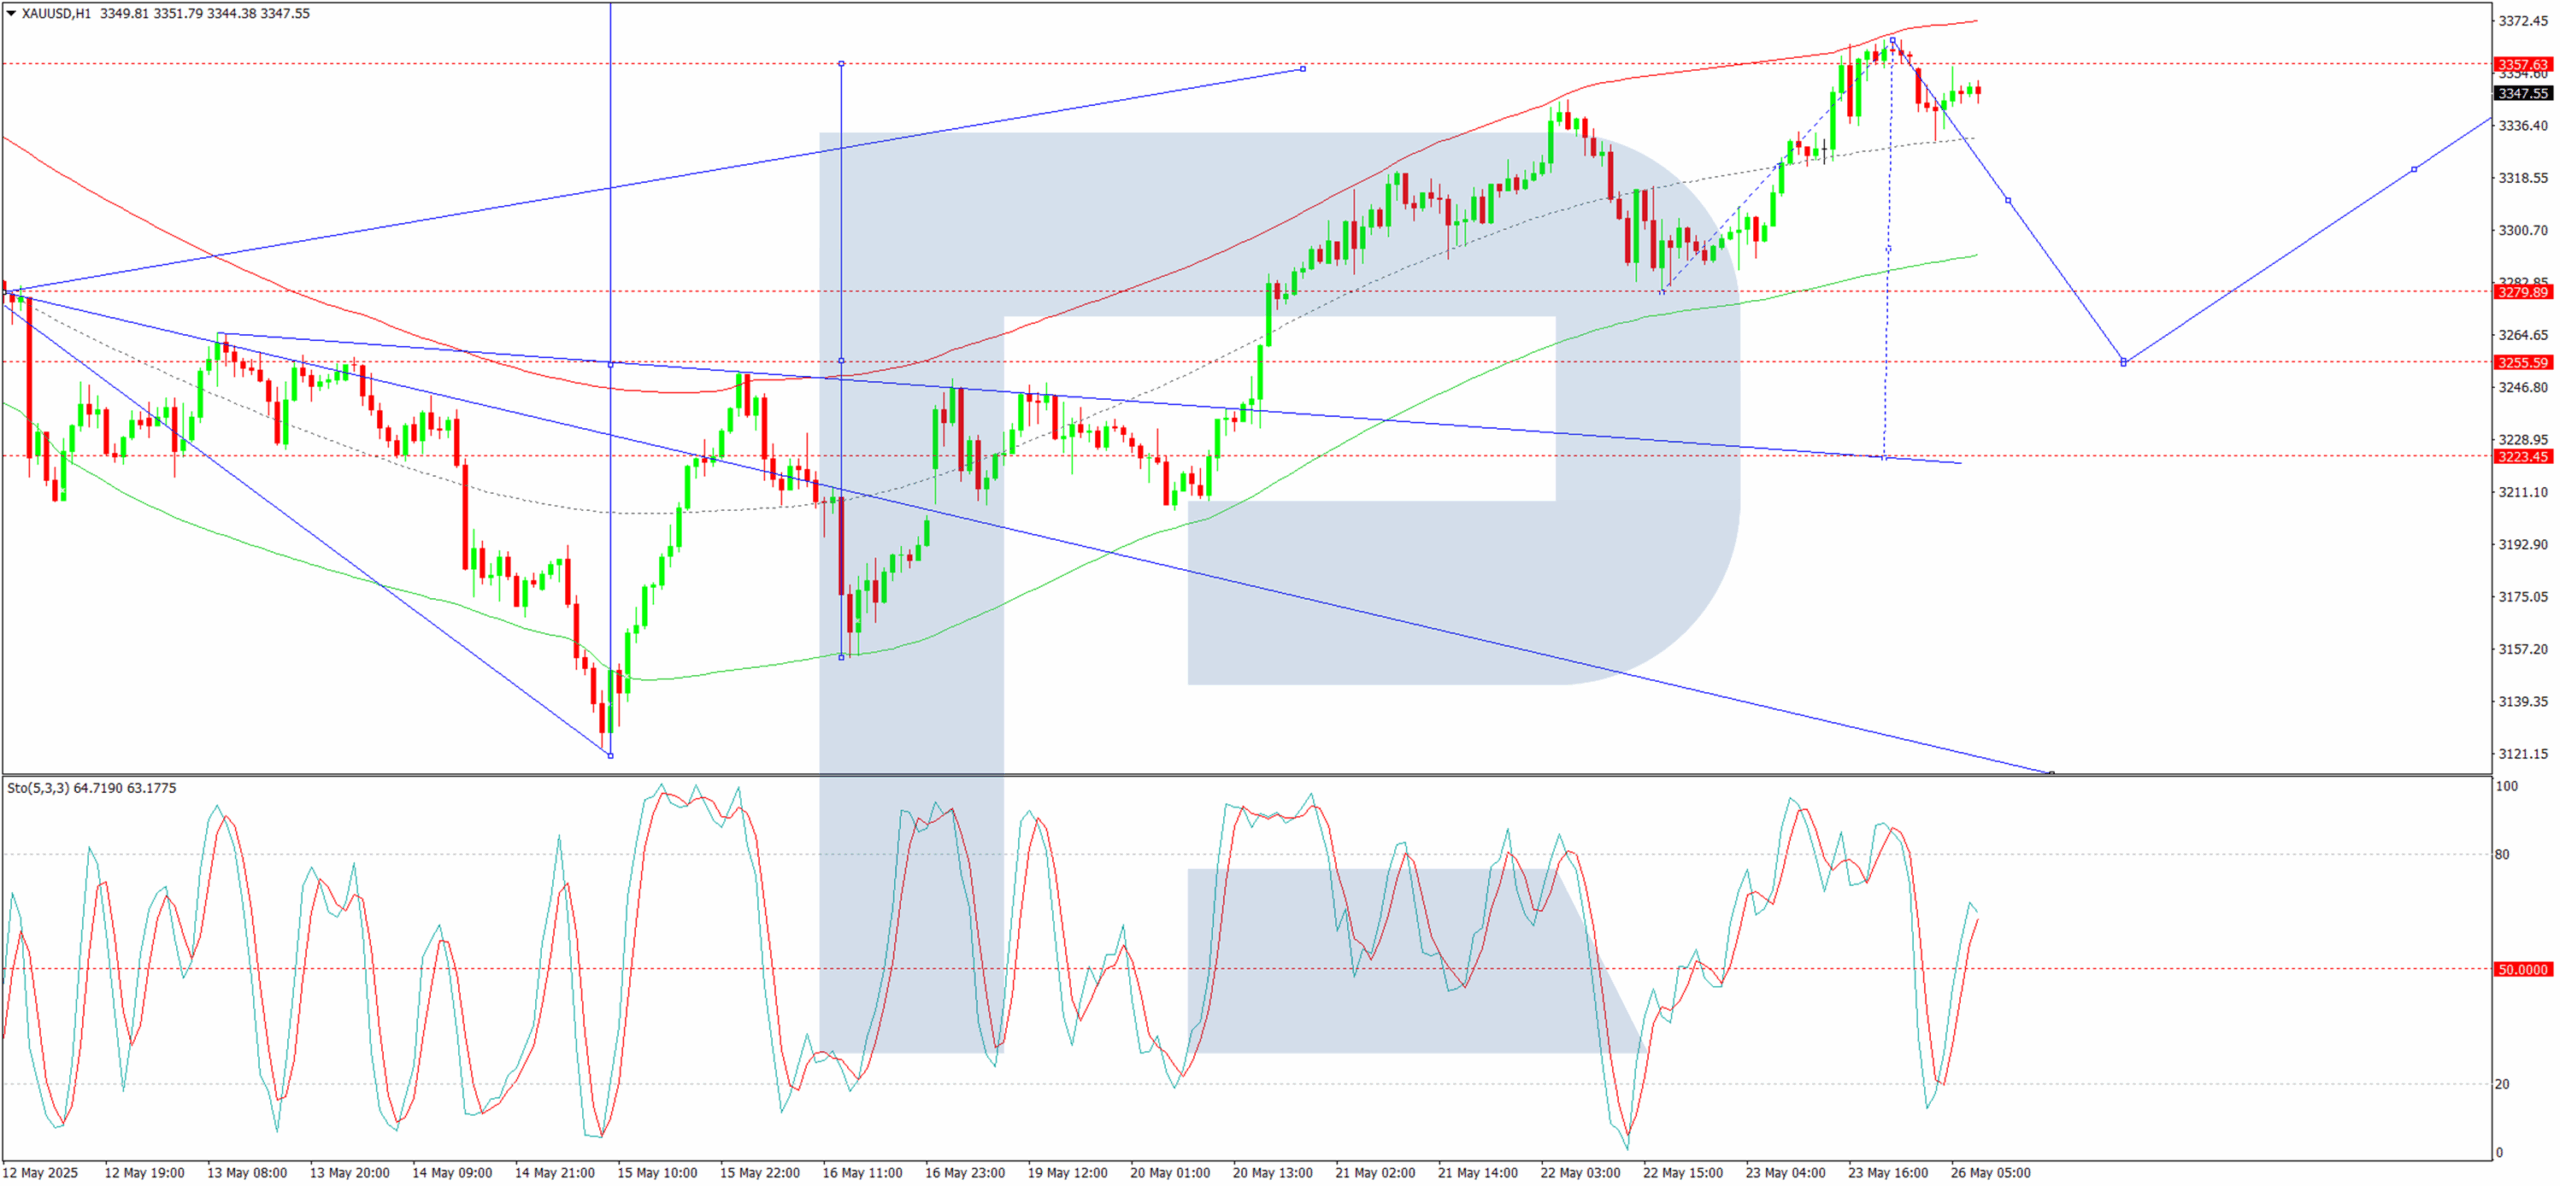
On the H1 chart, the market has completed its local corrective target. A further decline to at least 3,255 is anticipated today, after which another upward wave may develop towards 3,388. Bullish momentum would likely be exhausted at that point, with the entire rally regarded as a correction within the broader downtrend. Once this correction concludes, a resumption of the downtrend may follow, with a potential decline to 3,222 and an eventual extension towards 3,060. This bearish outlook is corroborated by the Stochastic oscillator, whose signal line has dipped below 80 and is trending sharply downward towards 20.
Conclusion
Gold’s rally has stalled as markets digest shifting US-EU trade dynamics, though lingering risks and technical indicators suggest further volatility ahead.
Crypto Market Let Off Steam Over the Weekend and Ready to Move Upwards
Market Picture
The Crypto Market cap rose by 6.5% from last week’s level to $3.43 trillion. However, since Friday, the market has taken a pause and moved further sideways, falling to $3.35—the upper boundary of the previous resistance. Market capitalisation has been building up in small steps upwards, which looks like the formation of a solid base typical of the early stages of bullish momentum.
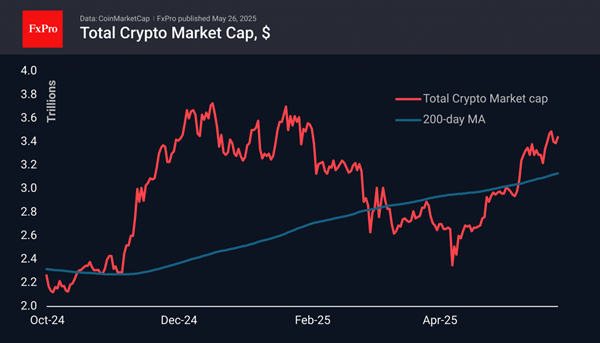
The sentiment index is at 73, having pulled back from extreme greed territory. The market is balancing around the current mark, letting off steam after strong bounces, which is also helping to extend the rally, albeit at a slower pace.
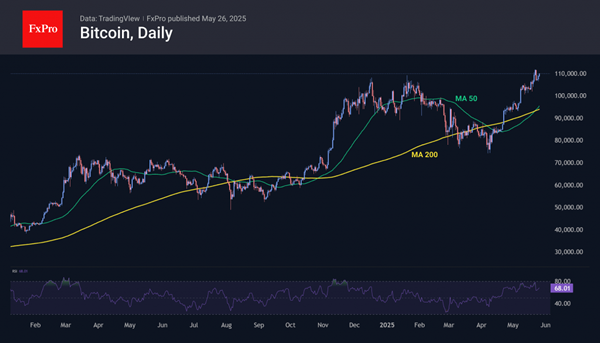
Bitcoin recharged over the weekend, retreating to $106.5K. As of Monday morning, it is trying again to break above $110.0K. At the end of last week, the Relative Strength Index touched the 80 level on the daily timeframes, indicating overbought conditions, but the subsequent retreat cleared the way for a rally. However, whether the coin goes there will depend on the dynamics of global markets, where the focus remains on the US and Japanese bond markets.
News Background
Significant inflows into US spot bitcoin ETFs have continued for five consecutive weeks. According to SoSoValue, net inflows into spot BTC-ETFs totalled $2.75bn last week, bringing the total amount invested since January 2024 to $44.53bn.
Inflows into spot Ethereum-ETFs in the US have continued for 4 out of the last 5 weeks, totalling $248.3 million last week, bringing the total since the ETF’s launch in July 2024 to $2.76 billion.
Strategy announced the launch of a new $2.1bn Class A preferred share offering programme. The funds are expected to go predominantly towards additional bitcoin investments.
According to the WSJ, major US banks are in talks to jointly issue a stablecoin. The initiative aims to counter the growing influence of the crypto industry.
Former IMF chief economist Kenneth Rogoff said cryptocurrency is increasingly being used in the global shadow economy, undermining the US dollar’s dominance. He noted that the dollar is gradually surrendering its position to the yuan and euro.
EUR/USD: Hits One-Month High on Fresh Twist in US-EU Tariff Story
EURUSD rose to one-month high on Monday after receiving fresh boost from the latest US/EU trade tariffs.
President Trump shocked markets again after announcing 50% tariffs on all imports from EU as from June1, with unexpected change of its plans over the weekend, to put tariffs on hold until July 9 and allow for talks between two sides, providing relief and fueling risk appetite.
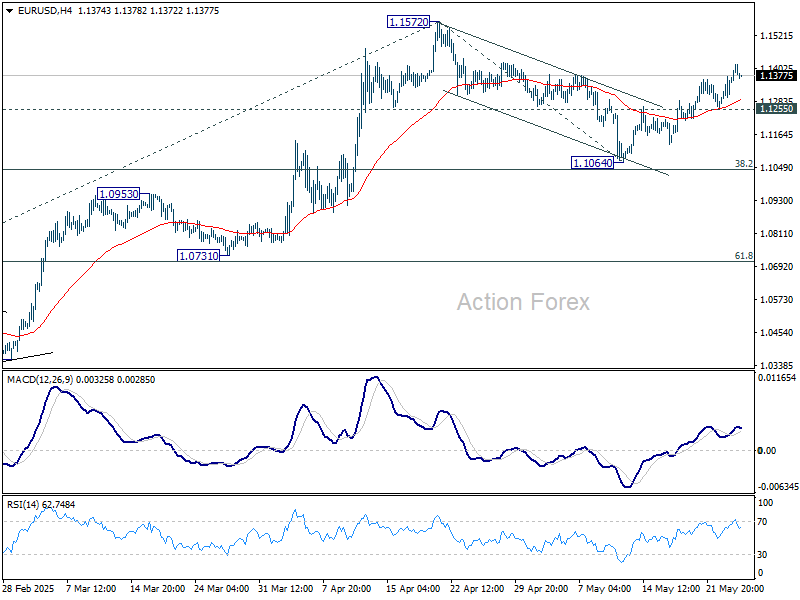
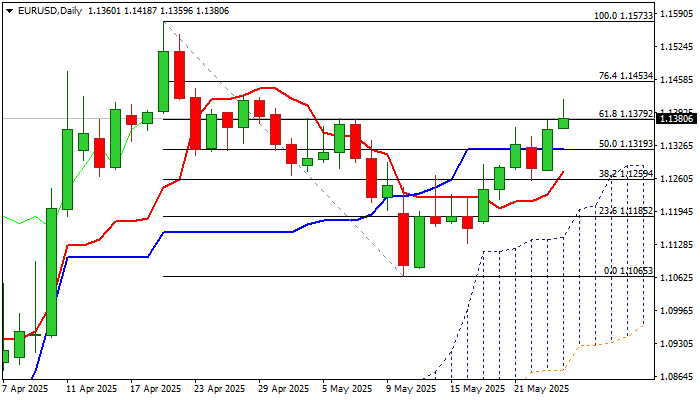
The pair broke above Fibo 61.8% of 1.1573/1.1065 correction and cracked round-figure 1.1400 barrier, though quick pullback (shown on hourly chart) warns of increased headwinds above 1.14.
Overbought stochastic on daily chart contributes to the scenario however, dips are likely to be shallow and mark positioning for fresh push higher as overall picture is bullish (rising thick daily cloud continues to underpin the advance, daily Tenkan/Kijun-sen are converging and about to form a bull-cross that would verify positive signal.
Dips should find firm ground at 1.1320 (daily Kijun-sen) to keep bulls in play for fresh attempt through 1.1400 zone and extension towards targets at 1.1453 (Fibo 76.4%) and 1.1500 (psychological).
Res: 1.1400; 1.1418; 1.1453; 1.1500
Sup: 1.1359; 1.1320; 1.1300; 1.1270
DAX Stock Index Rises Over 20% Year-to-Date
The German DAX 40 index (Germany 40 mini on FXOpen) is showing significantly stronger performance than other major global stock indices as of the end of May. For comparison, since the beginning of 2025:
→ The tech-heavy Nasdaq 100 has remained largely flat;
→ The S&P 500 is down by 1%;
→ Japan’s Nikkei 225 has fallen by approximately 4.5%.
Why Is Germany’s Stock Index Climbing?
The rally may be driven by a combination of factors, including:
→ An ambitious fiscal stimulus programme launched by the German government, featuring substantial public investment in defence and infrastructure development.
→ A dovish monetary policy stance from the European Central Bank (ECB) amid slowing inflation. Expectations of further interest rate cuts in 2025 have made equities more attractive than bonds, drawing capital into the stock market.
Technical Analysis of the DAX 40 Chart (Germany 40 mini on FXOpen)
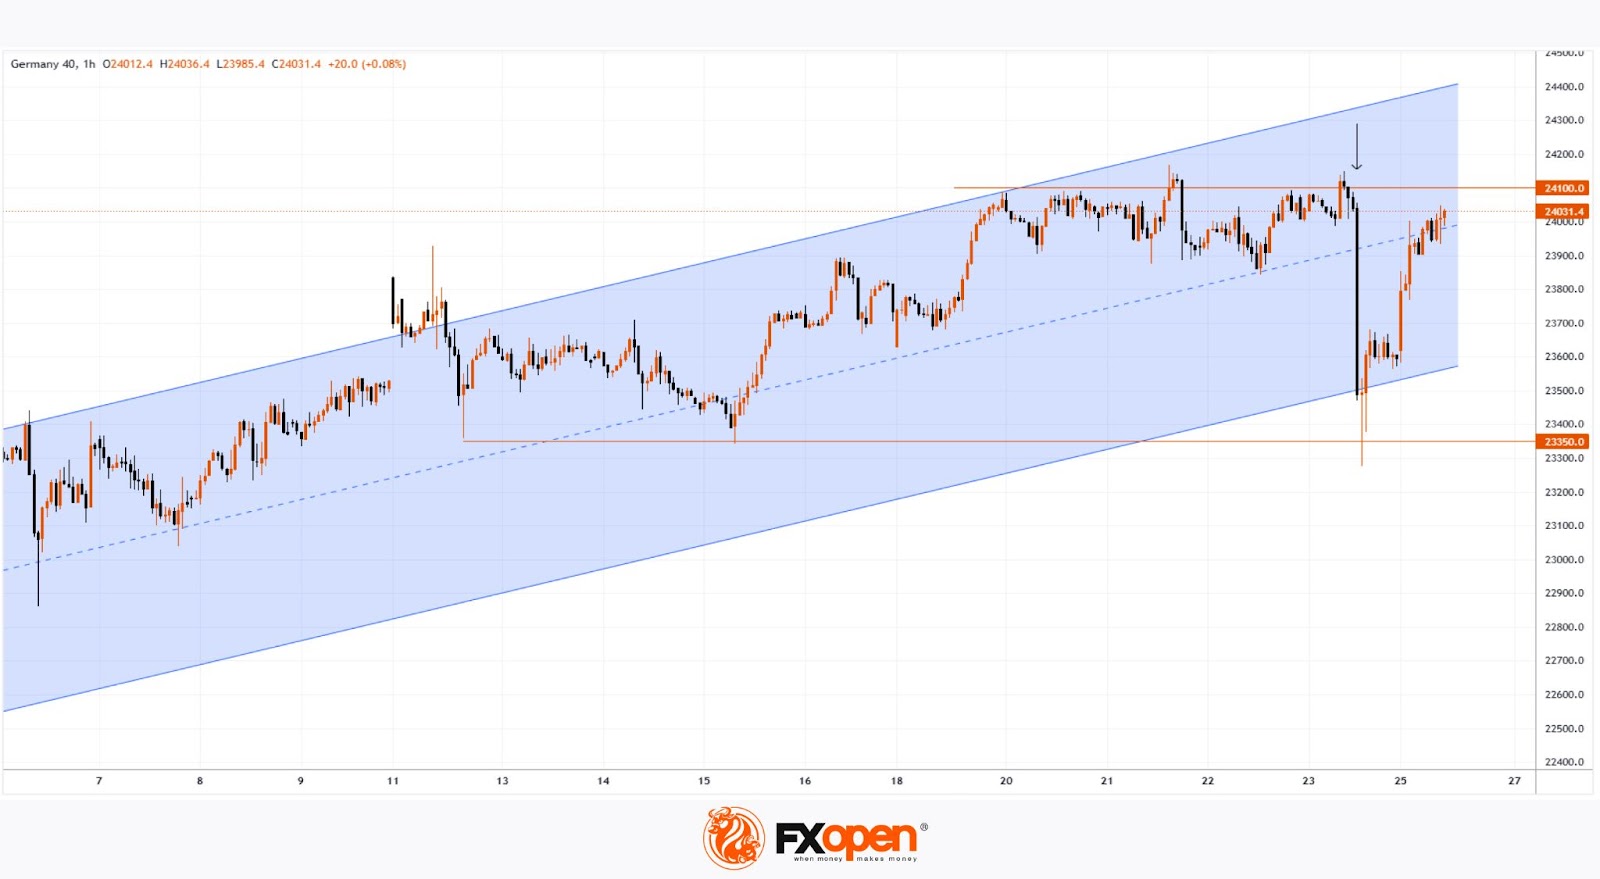
These fundamental drivers have supported the formation of an upward trend channel (marked in blue), with the median line acting as a key area of support.
The DAX stock index experienced a sharp drop on Friday (highlighted by the arrow) after the US President unexpectedly announced 50% tariffs on EU imports, citing slow progress in trade negotiations. By Sunday, however, Trump postponed the tariffs until 9 June following a “constructive conversation” with European Commission President Ursula von der Leyen.
Since then, the price has:
→ Rebounded from the lower boundary of the channel, which is reinforced by support at the 23,350.0 level;
→ Approached the 24,100 level — a strong resistance zone this month.
Given the uncertainty sparked by Trump’s impulsive policy shifts, investors may be shifting capital from US to European markets, further supporting the DAX 40’s position as a leader among global stock indices.
Trade global index CFDs with zero commission and tight spreads. Open your FXOpen account now or learn more about trading index CFDs with FXOpen.
This article represents the opinion of the Companies operating under the FXOpen brand only. It is not to be construed as an offer, solicitation, or recommendation with respect to products and services provided by the Companies operating under the FXOpen brand, nor is it to be considered financial advice.
EUR/USD Rises as Trump Hits the Snooze Button Again
- EUR/USD moves higher as Trump delays 50% tariffs on EU goods.
- Short-Term bias is positive, but key resistance is nearby at 1.1420.
EUR/USD started the week on a positive note after investors woke up to news that President Trump would delay the implementation of 50% tariffs on EU goods to July 9, from the previously scheduled June 1, to allow more time for negotiations after a call with Commission President Ursula von der Leyen.
This move aligns with the U.S. president's usual negotiation tactics, following the announcement of aggressive reciprocal tariffs a month ago. Nevertheless, EURUSD managed to capitalize on the headlines, advancing toward the lower boundary of the broken bullish channel at 1.1415 ahead of a speech by ECB President Christine Lagarde.
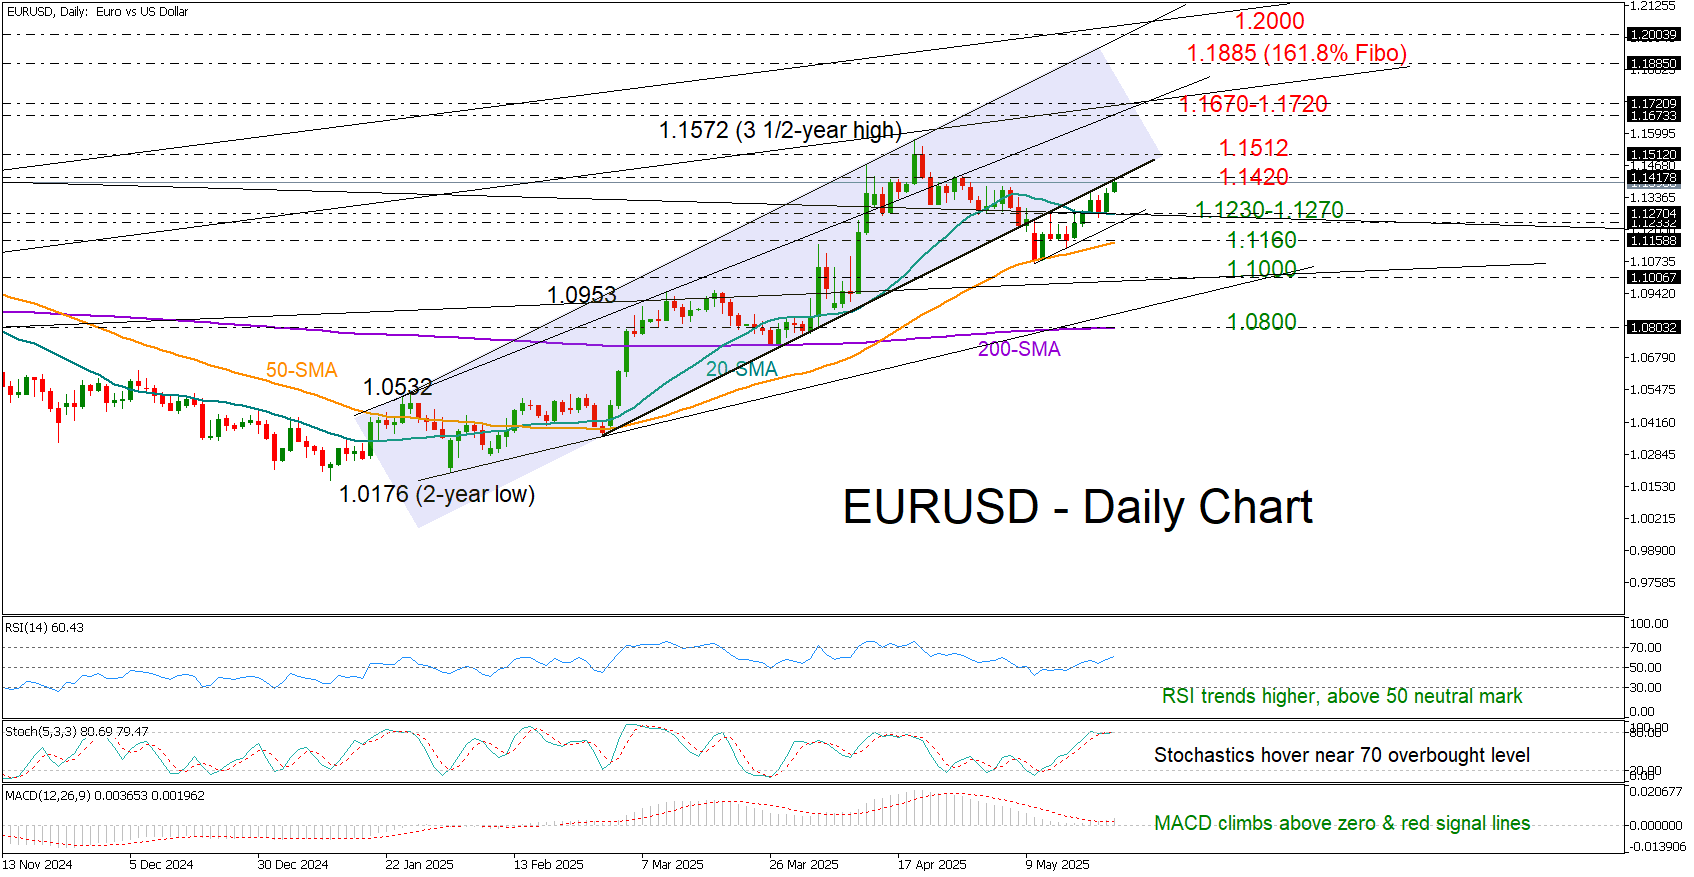
Technically, the short-term bias remains tilted to the bullish side, as the RSI continues to rise above its neutral 50 mark and the MACD is gaining ground above both its red signal line and the zero level. However, with the stochastic oscillator hovering near its overbought mark of 70, some caution may be warranted.
A decisive close higher could allow the pair to re-test April’s barrier around 1.1512. If this level is breached convincingly, the rally could extend towards the constraining trendline zone of 1.1670–1.1720. Further up, bulls may target the 161.8% Fibonacci extension of the previous downleg at 1.1885, ahead of the key psychological level of 1.2000.
In the event of a bearish reversal near 1.1420, the pair could find support between the 20-day simple moving average (SMA) at 1.1270 and the 1.1230 area. The 50-day SMA remains a critical pivot point near 1.1160; a break below this level could trigger a deeper decline toward the 1.1000 round level.
In summary, EUR/USD has more upside potential, pending a sustainable move above 1.1415 to trigger the next bullish wave.
EUR/USD Hits Key Resistance Level
Although financial markets in both the US and the UK are closed for a public holiday today, Donald Trump is keeping traders on their toes. According to a fresh Reuters report, the US President has backed down from his threat to impose 50% tariffs on EU goods from 1 June, following a phone call from European Commission President Ursula von der Leyen, who urged him to allow time to “reach a mutually beneficial deal”.
This development has boosted the euro while weighing on the US dollar.
As today's EUR/USD chart shows, the euro has risen to its highest level against the dollar since early May. But can the upward trend continue?
EUR/USD Technical Analysis
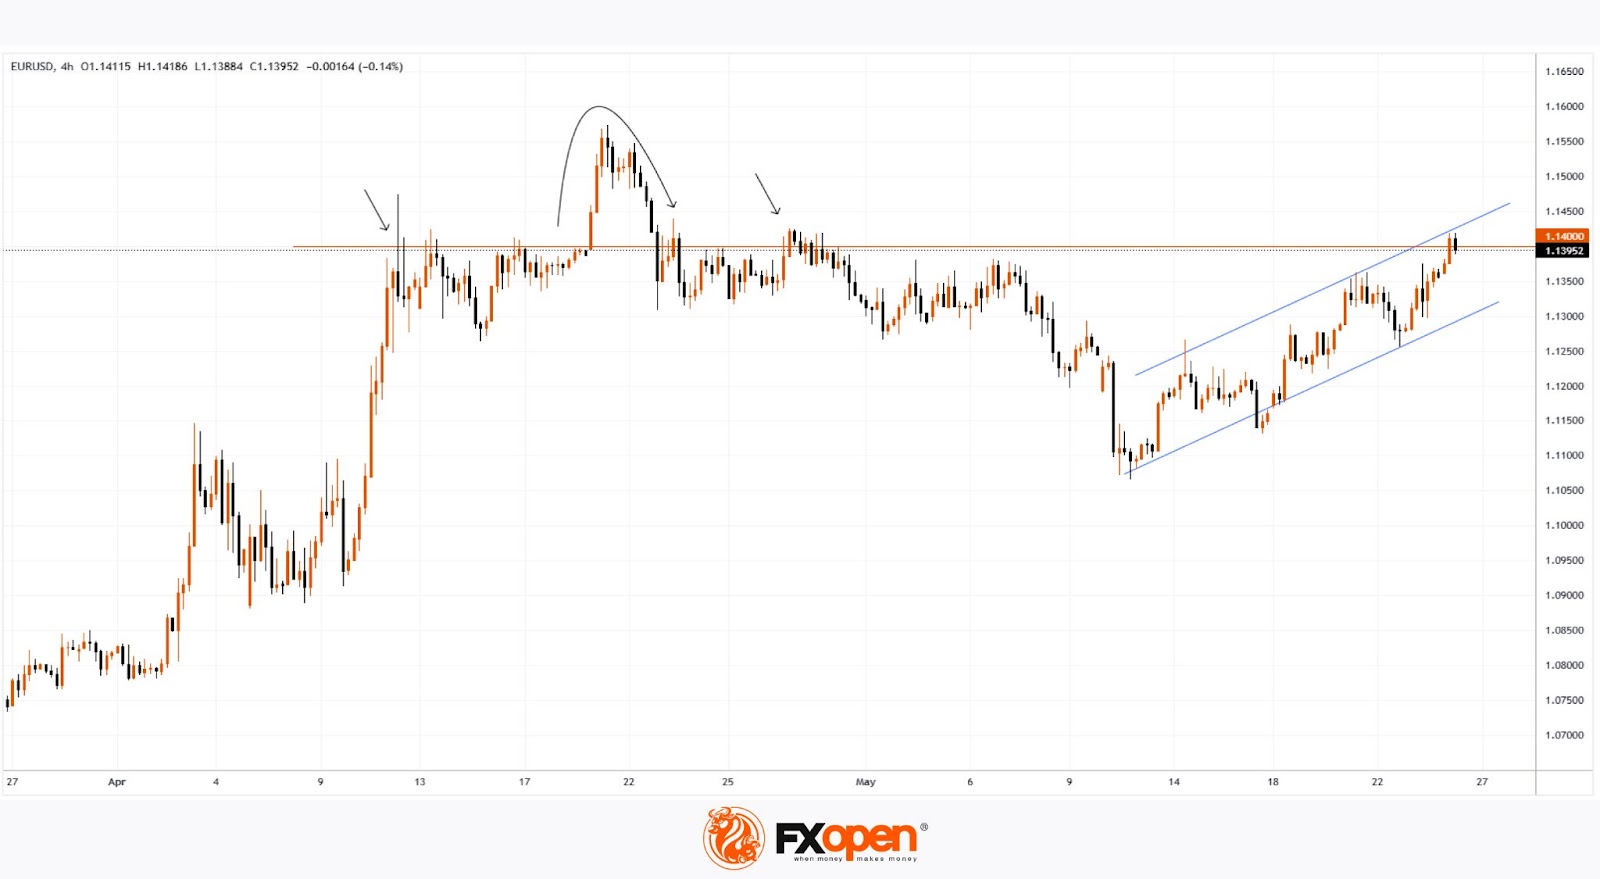
The ascending trend channel (highlighted in blue) confirms that bullish sentiment currently dominates. However, the EUR/USD chart also presents two bearish arguments worth noting:
→ The price has reached the upper boundary of the channel, which may act as resistance.
→ The 1.1400 level could also serve as resistance. Note how aggressively bears resisted upward movement in April: even when it appeared that the level had been clearly broken from below, the price failed to hold above it for long.
Given this, it is reasonable to suggest that EUR/USD bears may once again become active — particularly if the fundamental backdrop supports them.
Trade over 50 forex markets 24 hours a day with FXOpen. Take advantage of low commissions, deep liquidity, and spreads from 0.0 pips. Open your FXOpen account now or learn more about trading forex with FXOpen.
This article represents the opinion of the Companies operating under the FXOpen brand only. It is not to be construed as an offer, solicitation, or recommendation with respect to products and services provided by the Companies operating under the FXOpen brand, nor is it to be considered financial advice.
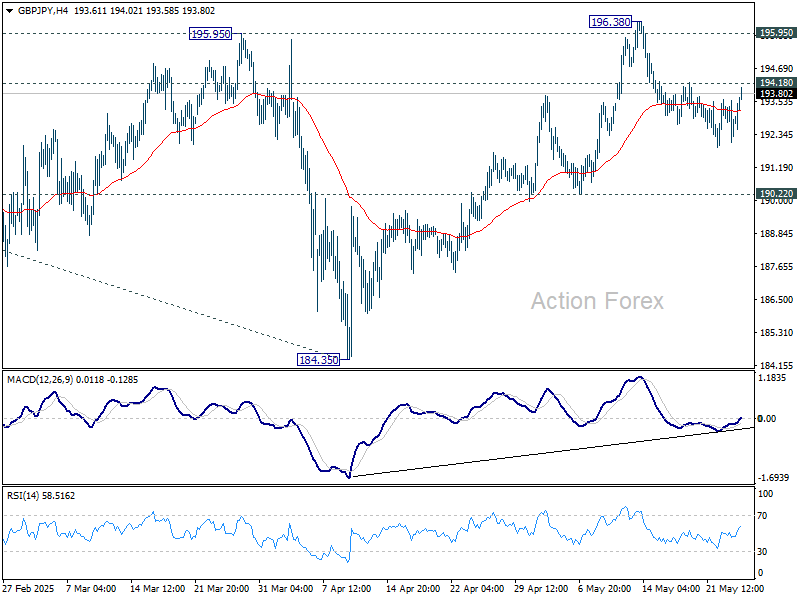
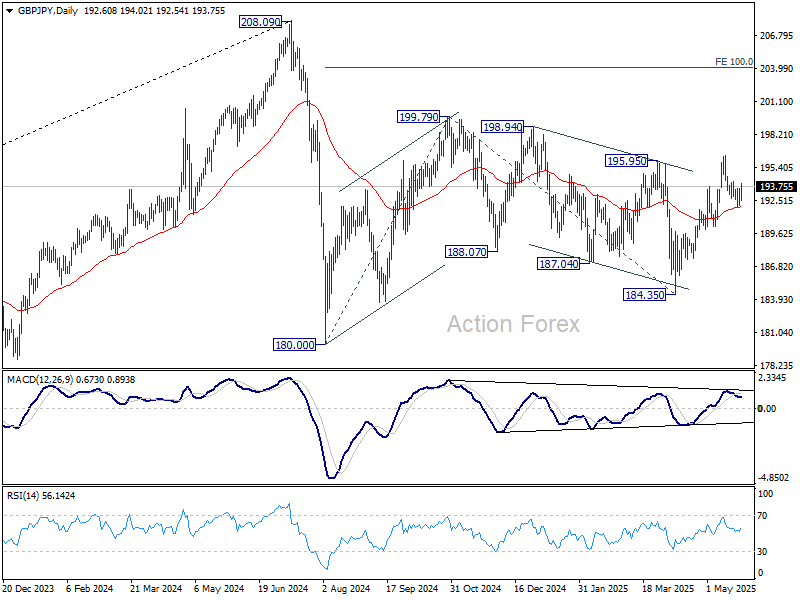
GBP/JPY Daily Outlook
Daily Pivots: (S1) 192.19; (P) 192.88; (R1) 193.68; More...
Intraday bias in GBP/JPY remains neutral at this point. While pullback from 196.38 might extend lower, further rally will remain in favor as long as 190.22 support holds. On the upside, above 194.18 resistance will suggest that the pull back has completed and bring stronger rise back to 196.38. However, sustained break of 190.22 will indicate near term reversal.
In the bigger picture, price actions from 208.09 are seen as a correction to rally from 123.94 (2020 low). Strong support should be seen from 38.2% retracement of 123.94 to 208.09 at 175.94 to contain downside. However, sustained break of 175.94 will bring deeper fall even still as a correction.
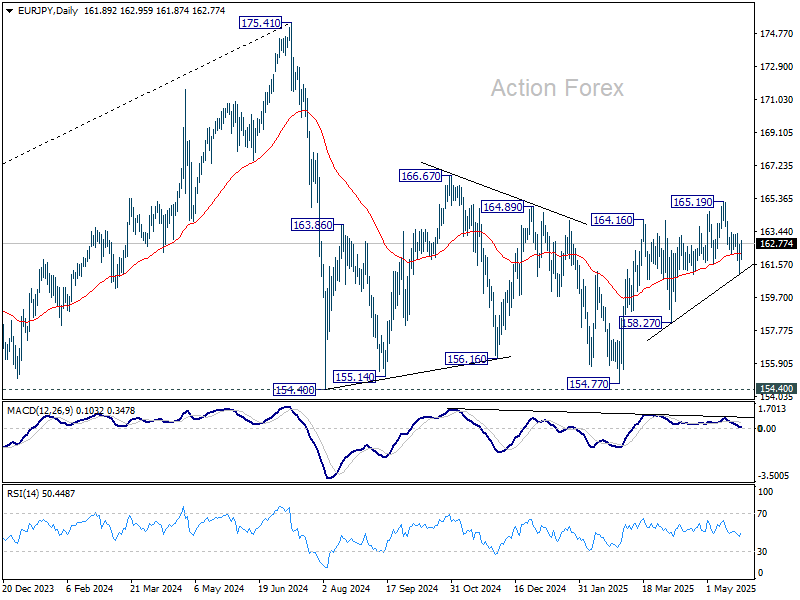
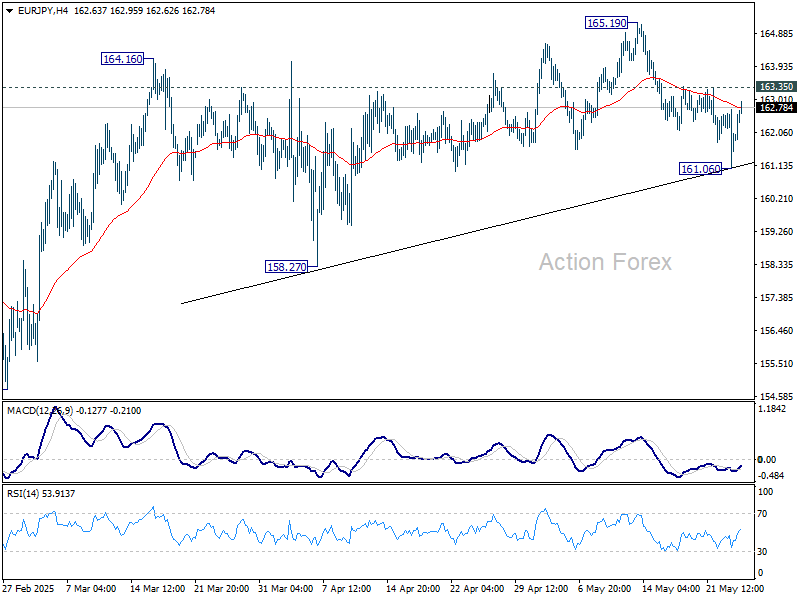
EUR/JPY Daily Outlook
Daily Pivots: (S1) 161.16; (P) 161.96; (R1) 162.82; More...
Intraday bias in EUR/JPY is turned neutral first with current recovery. On the downside, break of 161.06 will resume the fall from 165.19 to 158.27 support next. Nevertheless, on the upside, break of 163.35 resistance will revive near term bullishness, and bring retest of 165.19 instead.
In the bigger picture, price actions from 175.41 are seen as correction to rally from 114.42 (2020 low). Strong support should be seen from 38.2% retracement of 114.42 to 175.41 at 152.11 to contain downside. However, sustained break of 152.11 will bring deeper fall even still as a correction.