Sample Category Title
S&P 500 Wave Analysis
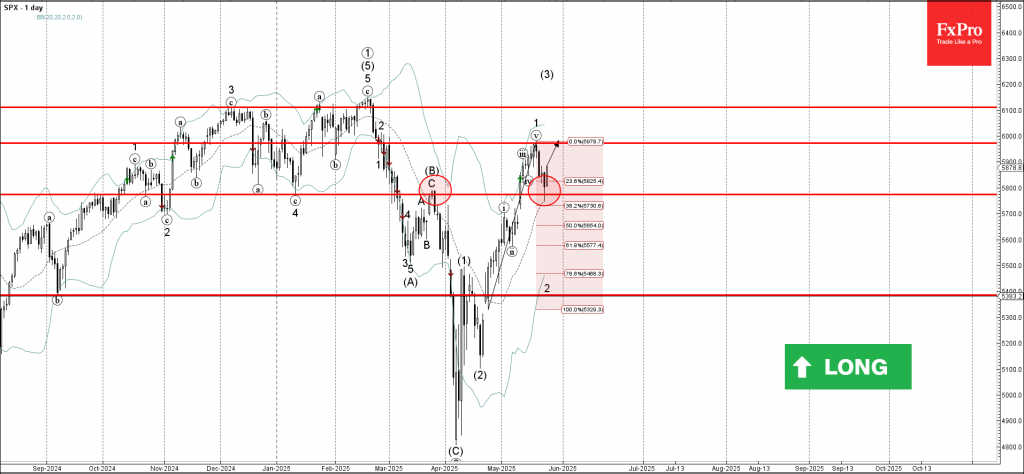
S&P 500: ⬆️ Buy
- S&P 500 reversed from support level 5775,00
- Likely to rise to resistance level 5970,00
S&P 500 index recently reversed up from the pivotal support level 5775,00 (former resistance from March, which formed the daily Japanese candlesticks reversal pattern Evening Star).
The support level 5775,00 was strengthened 20-day moving average and by the 38.21% Fibonacci correction of the previous upward impulse from April.
S&P 500 index can be expected to rise to the next resistance level 5970,00, top of the previous minor impulse wave 1 from the middle of May.
Bitcoin Wave Analysis
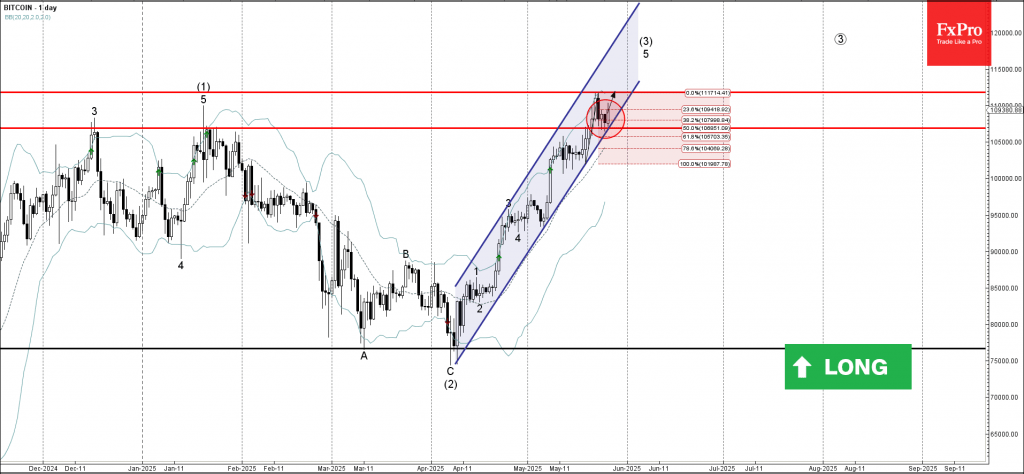
Bitcoin: ⬆️ Buy
- Bitcoin reversed from support level 106850,00
- Likely to rise to resistance level 111830.00
Bitcoin cryptocurrency pair recently reversed up from the support level 106850,00 (which has been reversing the price during the last few trading sessions), intersecting with the 50% Fibonacci correction of the previous upward impulse from last week.
The support level 106850,00 was further strengthened by the support trendline of the sharp daily up channel from the start of April.
Bitcoin cryptocurrency can be expected to rise to the next resistance level 111830.00, which reversed the price earlier this month.
Platinum Wave Analysis
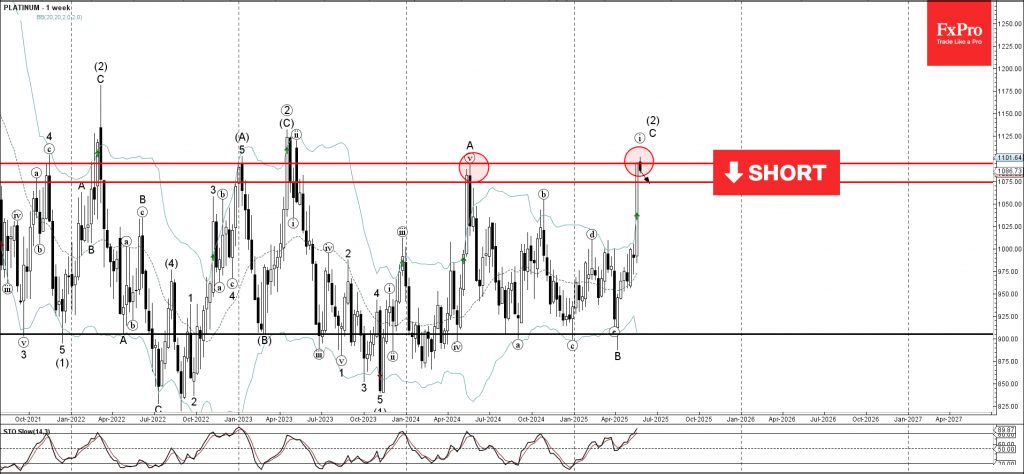
Platinum: ⬇️ Sell
- Platinum reversed from long-term resistance level 1095,00
- Likely to fall to support level 1075.00
Platinum recently reversed down from the major long-term resistance level 1095,00 (former yearly high from 2024), which stopped the previous weekly impulse wave A.
The resistance level 1095,00 was strengthened by the upper daily and the weekly Bollinger Bands.
Given the strength of the resistance level 1095,00 and the overbought weekly Stochastic, Platinum can be expected to fall to the next support level 1075.00.
The Power of Elliott Wave Blue Boxes: GBPUSD’s Perfect Bounce
In this technical blog, we will look at the past performance of the 1-hour Elliott Wave Charts of GBPUSD. In which, the rally from 13 January 2025 low is unfolding as an impulse sequence & showed a higher high sequence therefore, called for an extension higher to take place. We knew that the structure in GBPUSD should remain supported & extend higher. So, we advised members not to sell the pair & buy the dips in 3, 7, or 11 swings at the blue box areas. We will explain the structure & forecast below:
GBPUSD 1-Hour Elliott Wave Chart From 5.08.2025
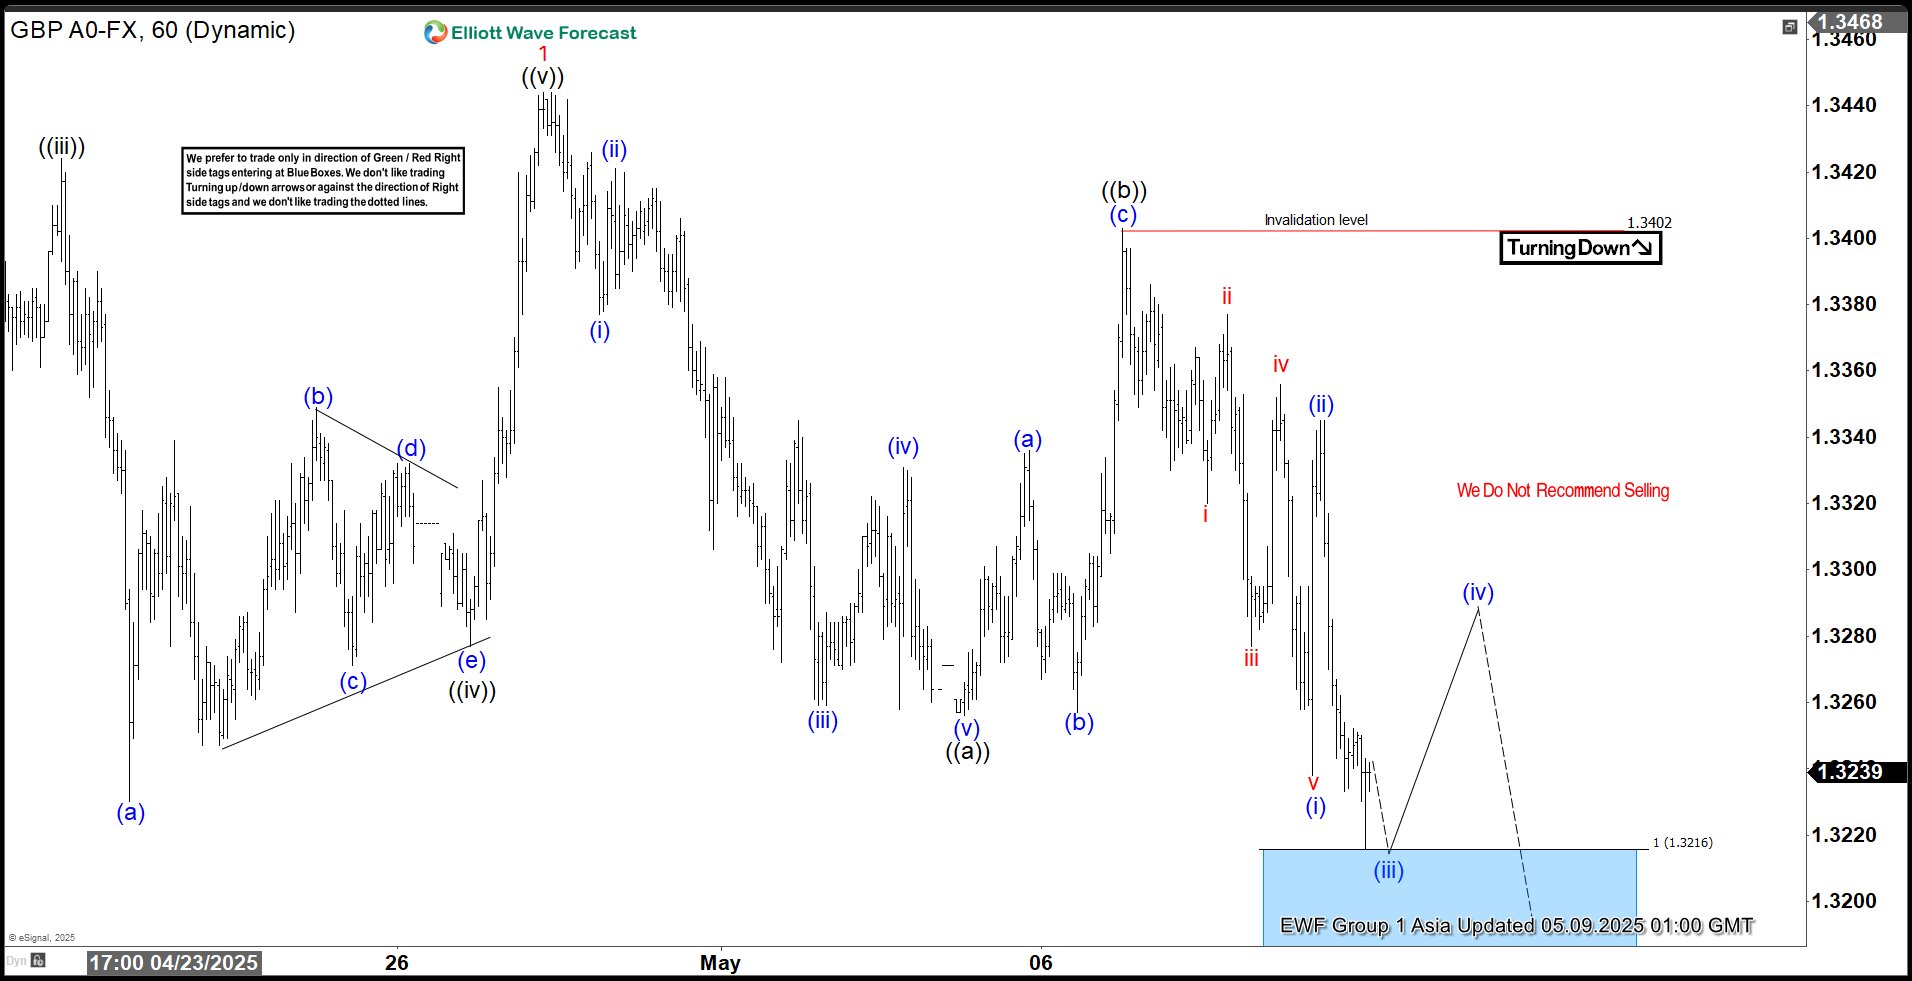
Here’s the 1-hour Elliott wave Chart from the 5.09.2025 Asia update. In which, the rally to $1.3443 high completed wave 1 & made a pullback in wave 2. The internals of that pullback unfolded as Elliott wave zigzag correction where wave ((a)) ended at $1.3257 low. Then a bounce to $1.3403 high-ended wave ((b)) & started the next leg lower in wave ((c)) towards $1.3216- $1.3100 blue box area. From there, buyers were expected to appear looking for new highs ideally or for a 3-wave bounce minimum.
GBPUSD Latest 1-Hour Elliott Wave Chart From 5.26.2025
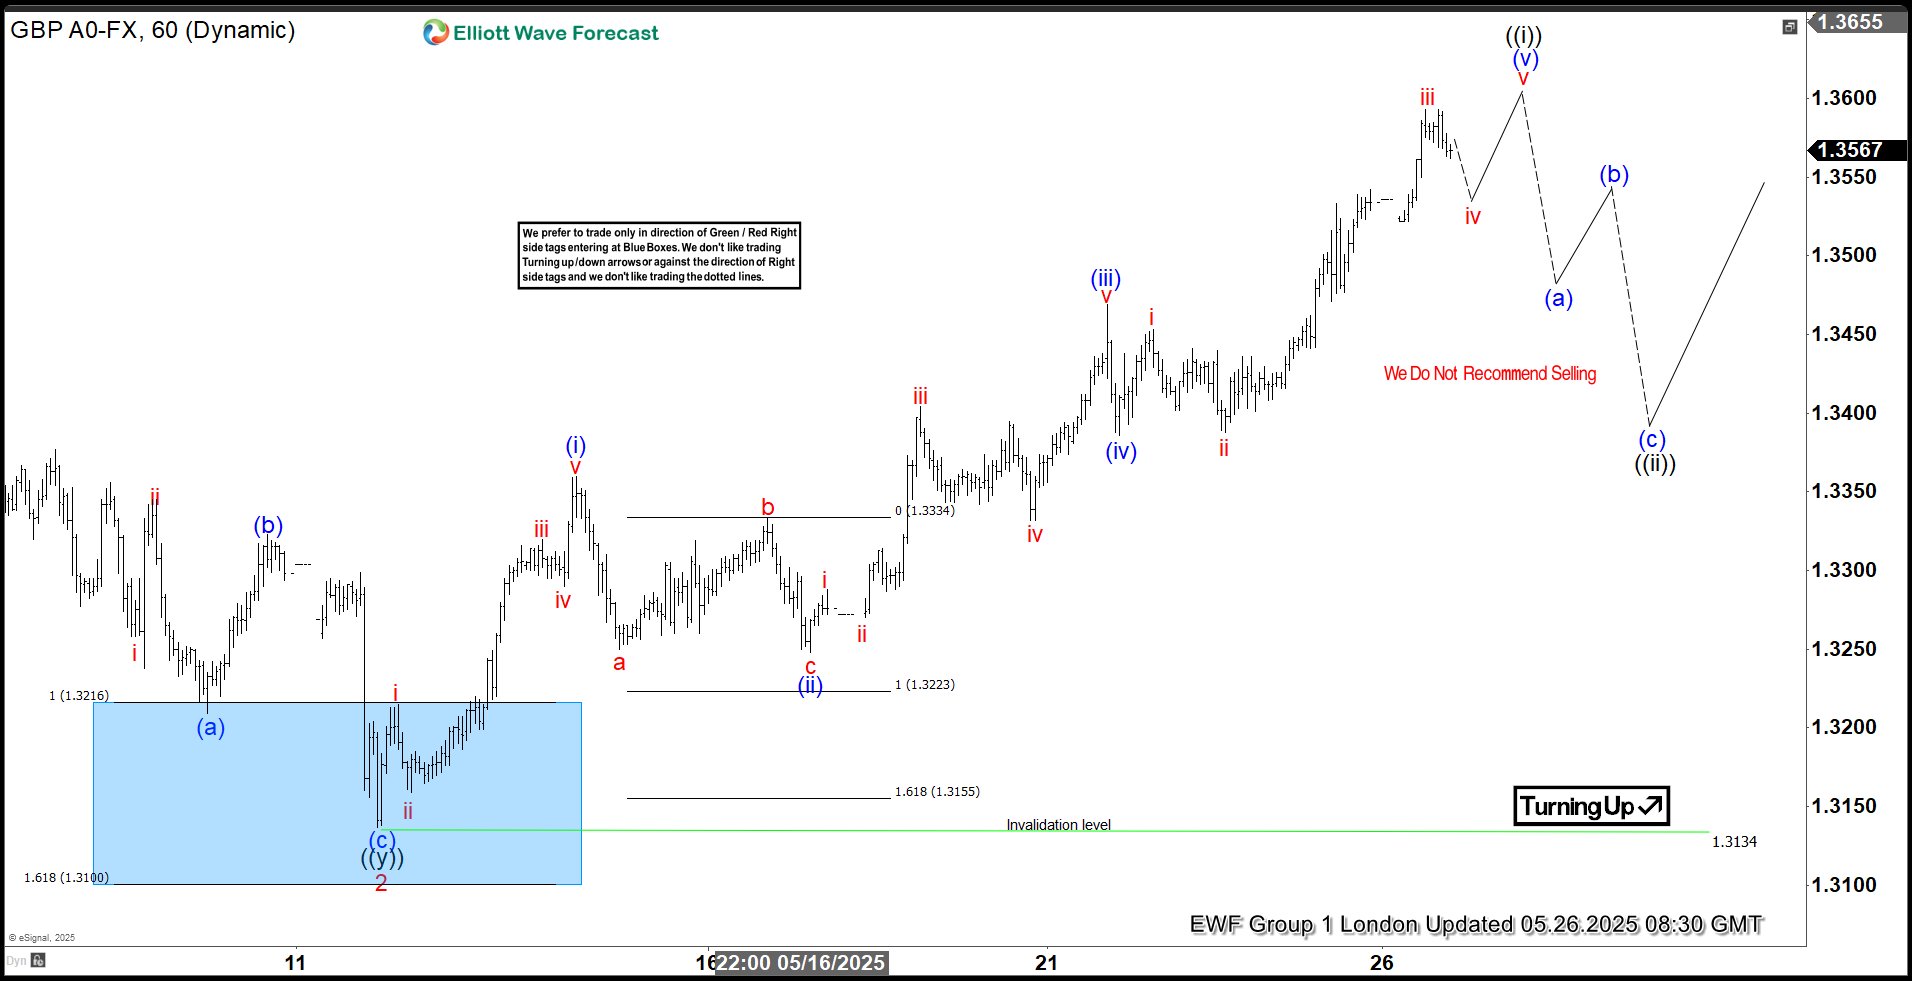
This is the latest 1-hour Elliott wave Chart from the 5.26.2025 London update. In which the pair is showing a strong reaction higher taking place, right after ending the correction within the blue box area. Allowed members to create a risk-free position shortly after taking the long position at the blue box area. Since then, the pair has already made a new high above $1.3443 high confirming the next extension higher targeting $1.3819- $1.4044 area higher.
ECB’s Lagarde: Fracturing global order a risk, but also an opportunity for Euro
ECB President Christine Lagarde said in a speech today that the global economic order is "fracturing", as multilateralism gives way to bilateral power struggles and protectionism. She highlighted that even Dollar's dominant role in the global financial system is no longer assured
Lagarde cautioned that this fragmentation poses serious risks for Europe’s economic security and resilience. However, she emphasized that these challenges could be turned into opportunities if Europe adopts the right policy responses, especially when it comes to expanding the "international role" of the Euro.
As the second-most widely held currency, accounting for roughly 20% of global FX reserves compared to Dollar’s 58%, Euro is well positioned to take on a greater global role.
Doing so would bring tangible benefits: lower borrowing costs for EU governments and businesses, reduced vulnerability to FX swings, and greater insulation from external financial coercion or sanctions.
Sunset Market Commentary
Markets
European markets have to find out the direction of travel on their own as the US (Memorial Day) and UK markets (Spring Bank Holiday) enjoy a long weekend. In addition, there were no data with market moving potential scheduled for release. European investors were ‘happy’ as president Trump during the weekend made another U-turn after on Friday ‘recommending’ 50% tariffs on European imports as soon as June 1. A weekend phone call with EC Commission President Ursula von der Leyen put the negotiation deadline back at July 9. EMU equities understandably reacted with a relieve rally reversing a part but not all of Friday’s setback (Eurostoxx 50 +1.1%). This feels like a technical rebound, but lacks conviction. Already before Friday’s setback (European and US) equities showed signs running into resistance. Trumps U-turn only illustrates that there is still a lot of work to do to bring some trust and a more structured approach to the US-EU negotiation table. It would be an outright miracle if there wouldn’t be new hick-ups in the run-up to July 09. The trade-theme since Friday again came to the forefront as a driver for trading, but it remains ‘pari passu’ with the topic of debt sustainability. Despite the risk-off, the US 30-y yield on Friday still closed north of 5.0%. After a risk-off decline on Friday, German ST yields today rebound 3.0 bps (2-y) but the long very long end even declines further (30-y -1.0 bp). As is the case for equities, the rebound (in yields) for sure doesn’t reverse Friday’s decline. The restoration of July 09 as the trade talks deadline also isn’t enough for markets to really question expectations for a ‘pre-emptive’ 25 bps rate cut at next week’s ECB meeting. ECB’ Simkus (Lithuania) today reconfirmed he sees room for a rate cut next week as risks of inflation dropping below the ECB goal have increased due to trade frictions and a stronger euro. Especially next week’s ECB updated (inflation) forecasts will be interesting lecture for market watchers. Similar picture or even slightly worse for the US dollar. Trade-driven risk-off most often is a negative for the US currency and a risk-on rebound doesn’t help. The DXY index morning even declined further to test the 98.70 area, but regained some ground to trade still marginally lower compared to Friday (99.05). EUR/USD holds Friday’s gains (1.137). The yen slightly underperforms at 143.
News & Views
Polish retail sales (at constant prices) rose by 6.2% M/M in April to be 7.6% higher in Y/Y-terms. Consensus expected a more modest increase (+2.1% M/M & +3.4% Y/Y). YTD 2025 sales increased by 3.3% Y/Y. Compared with April 2024, retail sales rose most for “motor vehicles, motorcycles & parts” (+14.9% Y/Y), “furniture radio, TV & household appliances” (+13.2% Y/Y) and “food, beverages & tobacco products” (+9.7% Y/Y). In April 2025, the value of retail sales via internet increased by 7.1% compared to a year ago. The share of sales via internet in total sales was the same as in the previous year (8.8%). The Polish zloty trades stronger against the euro today (EUR/PLN < 4.25), though that’s more linked to general (positive) risk sentiment than the data. This week’s Polish calendar is backloaded with May inflation numbers (Friday) and the second round of presidential elections (Sunday). Especially the latter has market-moving potential. PM Tusk’s candidate Trzaskowski and PiS candidate Nawrocki go neck-and-neck. A Trzaskowski win would enable Tusk to enroll his pro-EU agenda and should support the zloty. A Nawrocki win – he outperformed expectations in the first round - implies more clashes with the government and will weigh on PLN.
Czech consumer (100.7 from 97.7 vs 98.2 consensus) and business confidence (101 from 96.5 vs 96.9) both surged in May, lifting the aggregate indicator from 96.7 to 101, its highest level since May 2022. Especially businesses turn less pessimistic when compared to the past couple of years. On a sectoral-level, improved business sentiment in industry (+3.9 pts) and selected services (+6.6 pts) outweighed deteriorations in trade (-1.8 pts) and construction (-1.7 pts). Consumers turned less pessimistic on the overall economic situation and their own financial situation over the next 12 months. EUR/CZK is today testing the YtD low around 24.85.
USD/JPY Mid-Day Outlook
Daily Pivots: (S1) 141.93; (P) 143.07; (R1) 143.72; More...
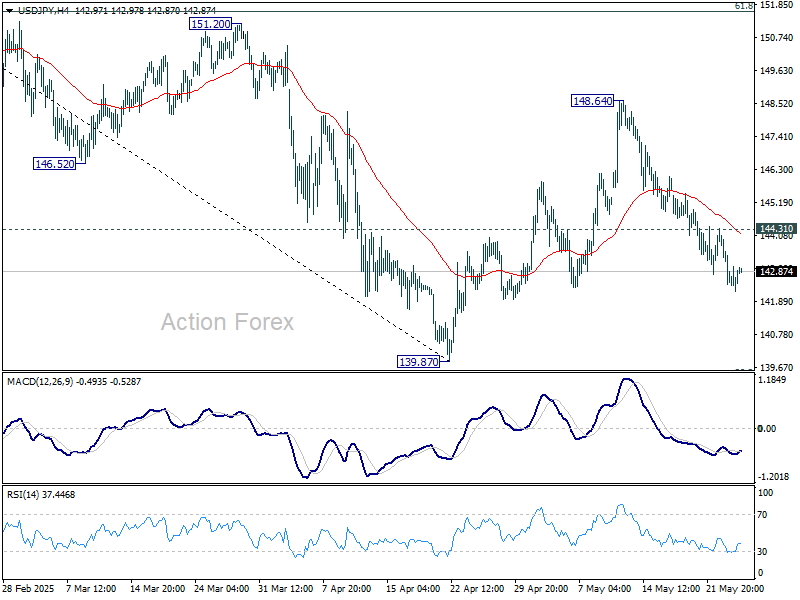
Intraday bias in USD/JPY stays on the downside at this point. Fall from 148.64 is in progress for retesting 139.87. On the upside, above 144.31 minor resistance will turn intraday bias neutral again and bring consolidations first, before staging another decline.
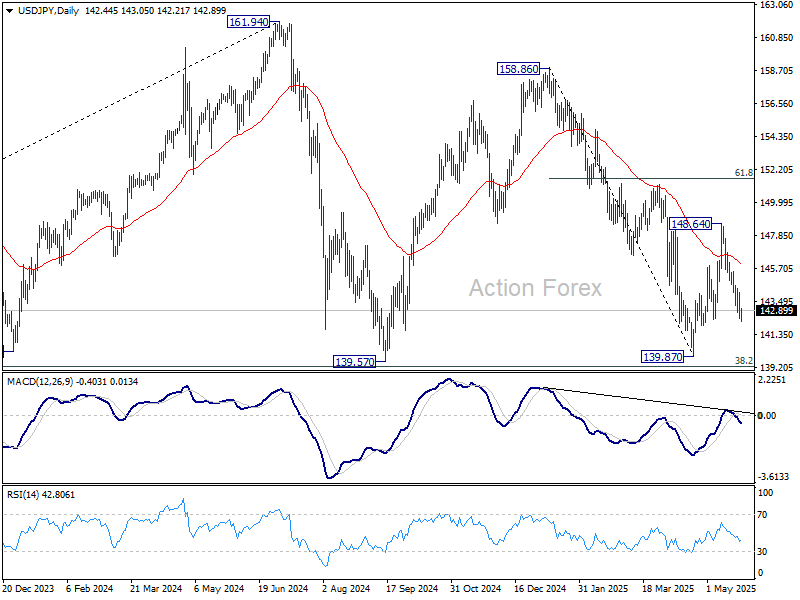
In the bigger picture, price actions from 161.94 are seen as a corrective pattern to rise from 102.58 (2021 low), with fall from 158.86 as the third leg. Strong support should be seen from 38.2% retracement of 102.58 to 161.94 at 139.26 to bring rebound. However, sustained break of 139.26 would open up deeper medium term decline to 61.8% retracement at 125.25.
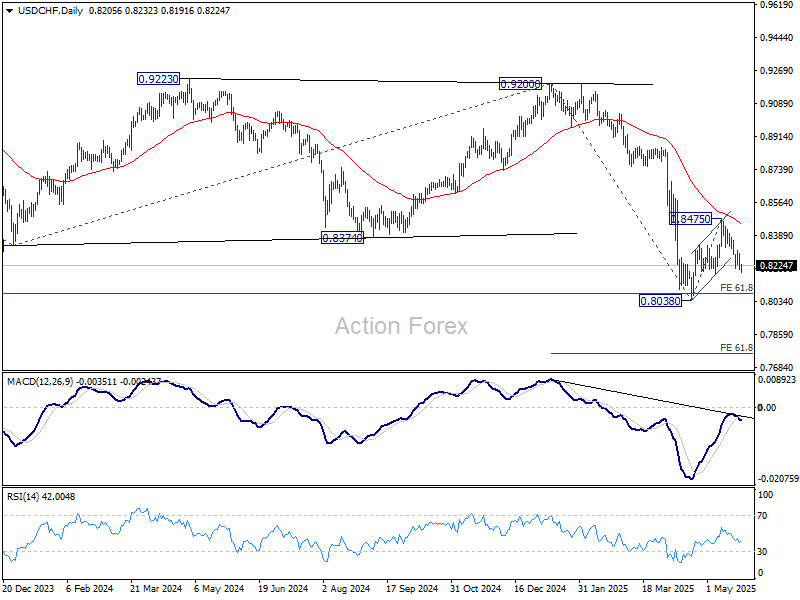
USD/CHF Mid-Day Outlook
Daily Pivots: (S1) 0.8179; (P) 0.8238; (R1) 0.8273; More….
Intraday bias in USD/CHF stays on the downside for the moment. Fall from 0.8475 is in progress for retesting 0.8038 low. Firm break there will resume larger down trend to 61.8% projection of 0.9200 to 0.8038 from 0.8475 at 0.7757 next. On the upside, above 0.8305 minor resistance will turn intraday bias neutral again.
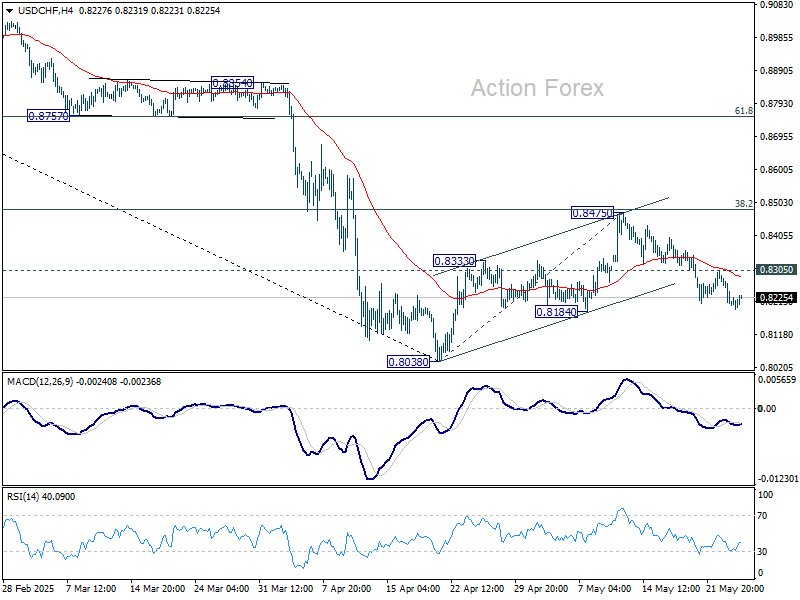
In the bigger picture, long term down trend from 1.0342 (2017 high) is still in progress and met 61.8% projection of 1.0146 (2022 high) to 0.8332 from 0.9200 at 0.8079 already. In any case, outlook will stay bearish as long as 55 W EMA (now at 0.8713) holds. Sustained break of 0.8079 will target 100% projection at 0.7382.
GBP/USD Mid-Day Outlook
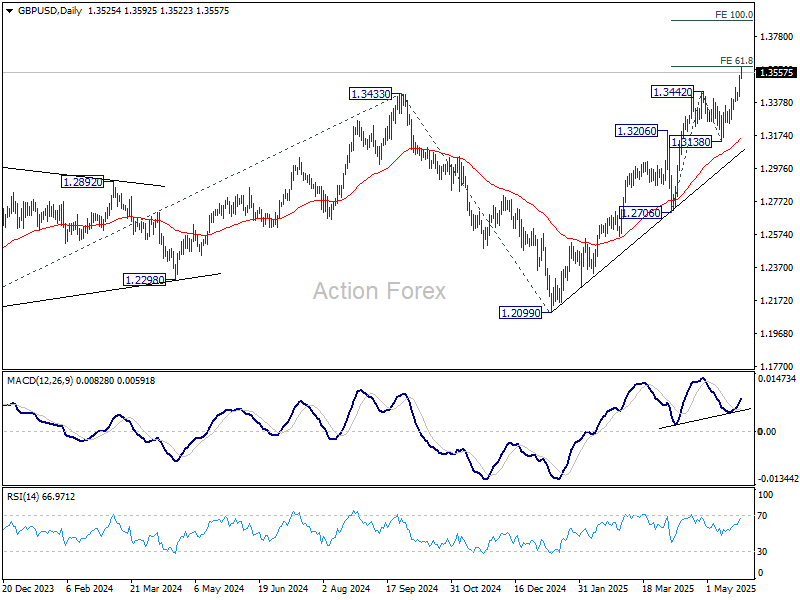
Daily Pivots: (S1) 1.3451; (P) 1.3496; (R1) 1.3587; More...
Intraday bias in GBP/USD remains on the upside for the moment. Firm break of 61.8% projection of 1.2706 to 1.3442 from 1.3138 at 1.3593 will target 100% projection at 1.3874. On the downside, below 1.3468 minor support will turn intraday bias neutral first. But retreat should be contained well above 1.3138 support to bring another rally.
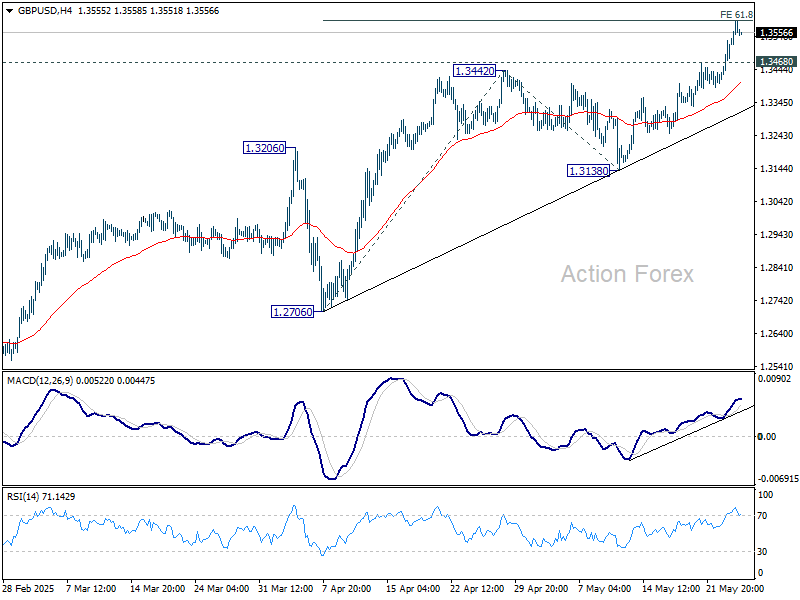
In the bigger picture, up trend from 1.3051 (2022 low) is in progress. Next medium term target is 61.8% projection of 1.0351 to 1.3433 from 1.2099 at 1.4004. Outlook will now stay bullish as long as 55 W EMA (now at 1.2870) holds, even in case of deep pullback.