Sample Category Title
USDJPY Forming a Bottom at 140 with Upside Potential to 160+
The media often focuses on the impact of America’s debt problems on the dollar, but events in Japan have every chance to be more dramatic. Japan is buried under a debt burden exceeding 230% of GDP. This is double the average burden for developed countries and by a wide margin exceeds the nearest major peers (Greece at 142%, Italy at 137%, and the US at 122%), if we exclude small countries like Sudan, Singapore, and the like.
High debt limits a government’s ability to absorb risk, much like an overloaded car: the difference may be subtle on a smooth road, but it becomes glaring on a rough one. At a time when even the solvency of the US is in question, it should come as no surprise that investors are asking the same question of other debtors.
In practical terms, this means pressure on the price of long-term bonds as traders demand higher yields. Yields on 30-year notes rose to 3.20% last week, although they have now been pushed back to 2.85%, a dramatic change from the plateau at 0.65% from mid-2020 to late 2021. That’s still higher than we saw in the period before zero interest rates began, when the peak area was near 2.6% between 2006 and 2008.
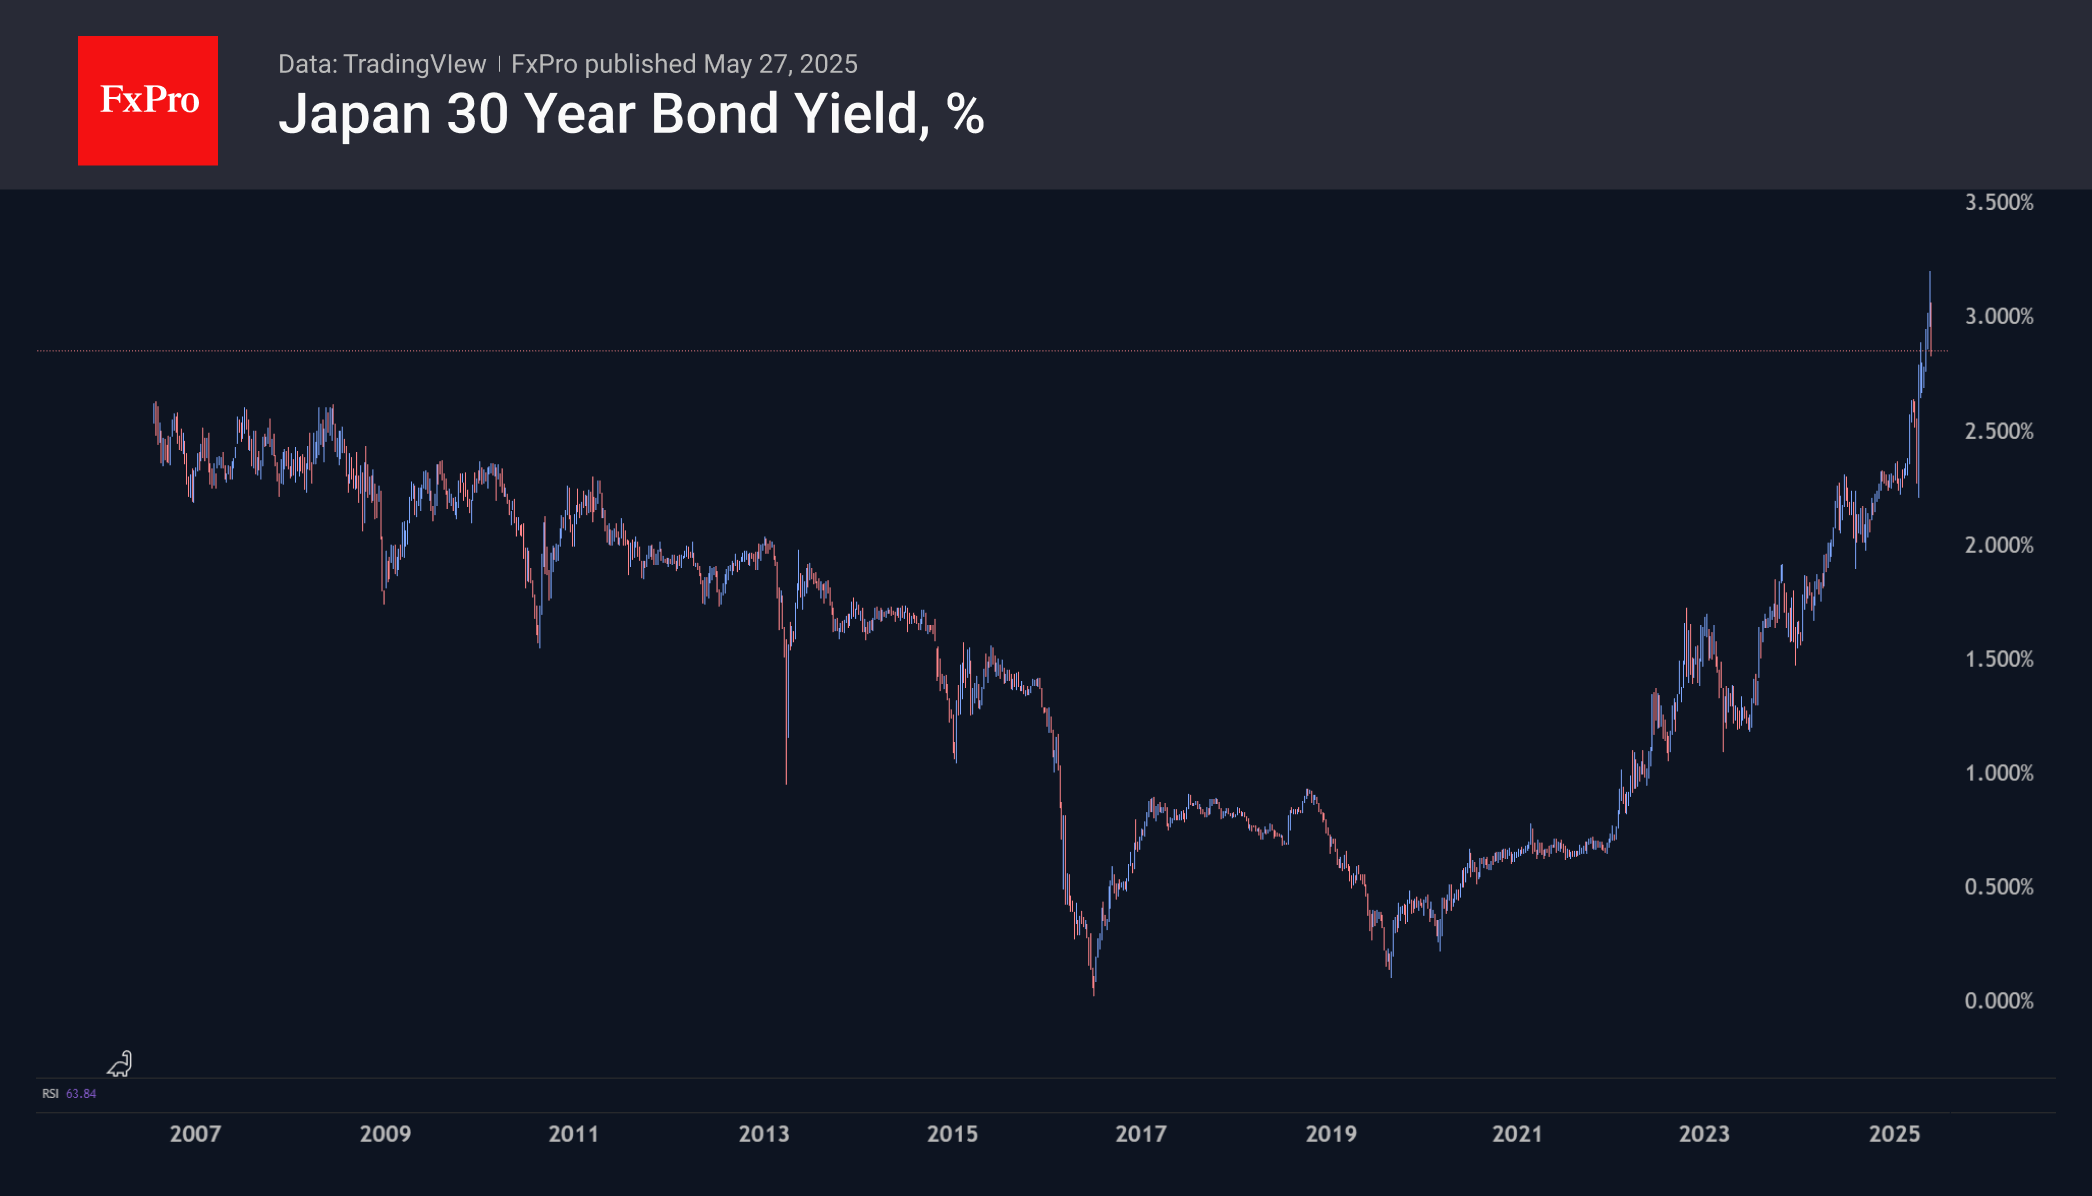
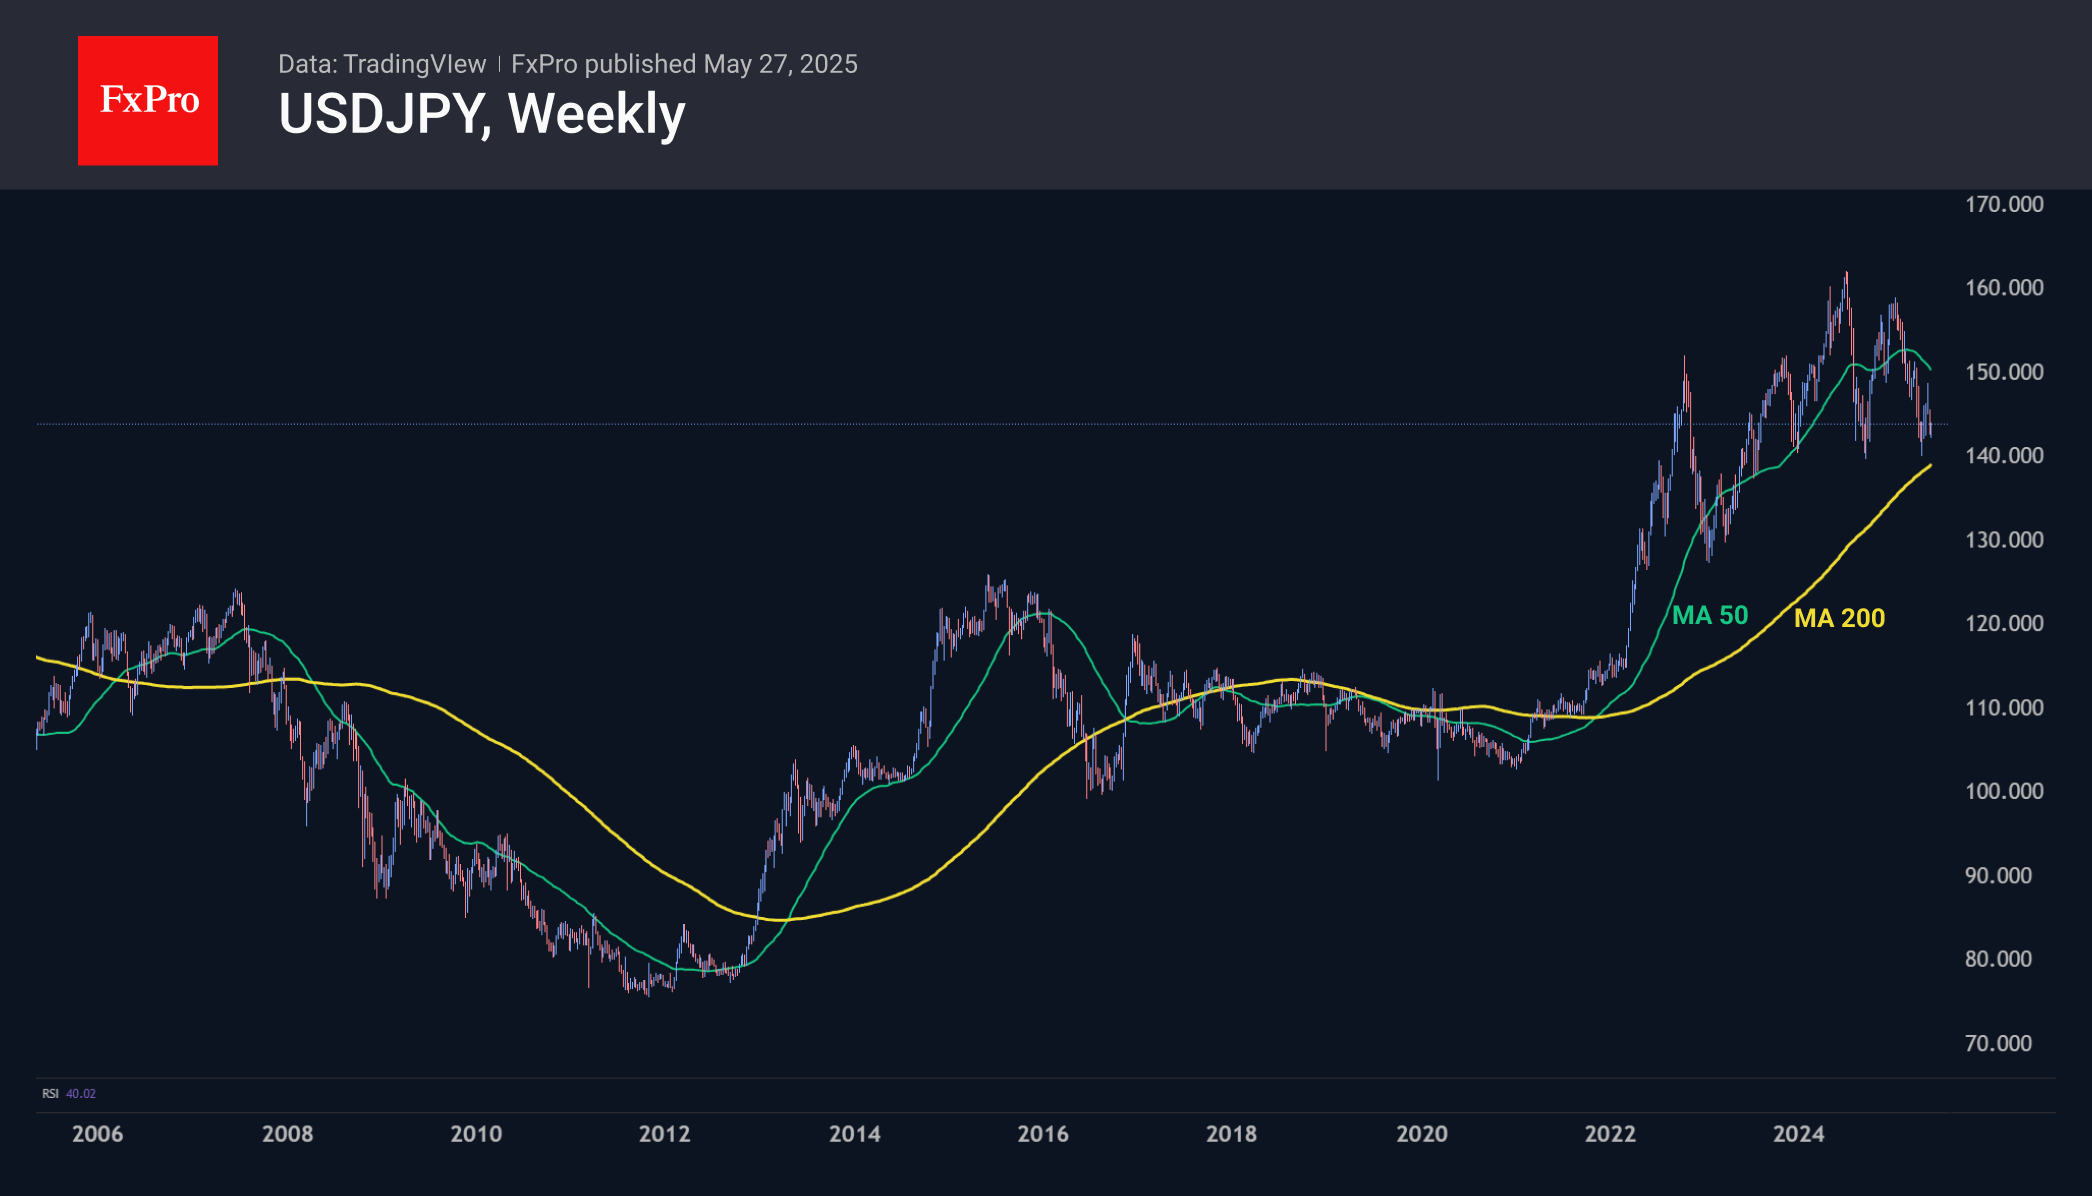
Since these are not just numbers for investors, but a serious increase in the government’s debt servicing costs, we should expect a reversal in monetary policy. The Bank of Japan has been gently moving away from negative rate territory and reducing the intensity of QQE for the past few years. This included helping to stabilise a currency that had reached its lowest level against the dollar since 1987. Acting the opposite of the Fed, the Bank of Japan has seen USDJPY decline 11% from a peak of 162 to 140 last month.
That is, Japan needs to support the bond market through a return to massive QQE and a declaration of a reversal in monetary policy. There is room for such a move as the yen has retreated from its lows. Moreover, for export-oriented Japan, a weaker yen will help boost exports, which in the face of trade wars could be crucial for rising import prices.
If we are right, USDJPY is close to forming a long-term bottom and reversing to the upside, the beginning of which we may have seen at the start of this week. The pair bounced from 140 in 2023 and 2024, and we see signs of a reversal now. At its lows at 142 at the start of the week, the USDJPY was less than 2% away from its 200-week average, a major long-term trend line, the exceeding of which triggered the last rally in 2021. USDJPY may not face any meaningful upside obstacles until the 158-160 area, which could take 3 to 6 months if we focus on the past few impulses.
Yen Sides as BOJ Core Inflation Higher than Expected, US Durable Goods Expected to Plunge
The Japanese yen is down for a second straight day. In the European session, USD/JPY is trading at 144.14, up 0.91% on the day.
BoJ core CPI beats forecast, hits 2.4%
BoJ core CPI rose to 2.4% in April, after three straight readings of 2.2% and above the market estimate of 2.3%. This was the highest level since Jan. 2024. Japan's Services PPI also rose to 3.1% in April, lower than the upwardly revised 3.3% gain but above the market estimate of 3.0%.
This release comes on the heels of Japan's core CPI, which jumped in April to 3.5% from 2.4%, the highest level in two years. Core inflation has held above the Bank of Japan's 2% target for over three years but the central bank has been very slow to raise interest rates.
Governor Ueda said on Tuesday that the BoJ would adjust its rate policy "as needed" if economic expectations are met, a vague reference but still an acknowledgement that the next move will be a rate hike. The markets expect the BoJ to maintain its wait-and-see mode for some time, with a rate hike unlikely before September at the earliest.
The BoJ has revised lower its growth and inflation projections to the current economic uncertainties, particularly those related to US trade policy. The central bank meets next on June 17 and is widely expected to hold its policy settings steady.
US core durable goods expected to plunge
US markets are back in action after the Memorial Day holiday on Monday. US Durable Goods Orders are expected to slide by 7.8% in April, after a 7.5% gain in March, which was the fastest pace of growth since July 2020. As well, The Conference Board Consumer Confidence index, which has fallen steadily fallen this year, is expected to improve to 87.0 from 86.0.
USD/JPY Technical
- USD/JPY faces resistance at 144.58 and 146.58
- 143.50 and 141.50 are the next support levels
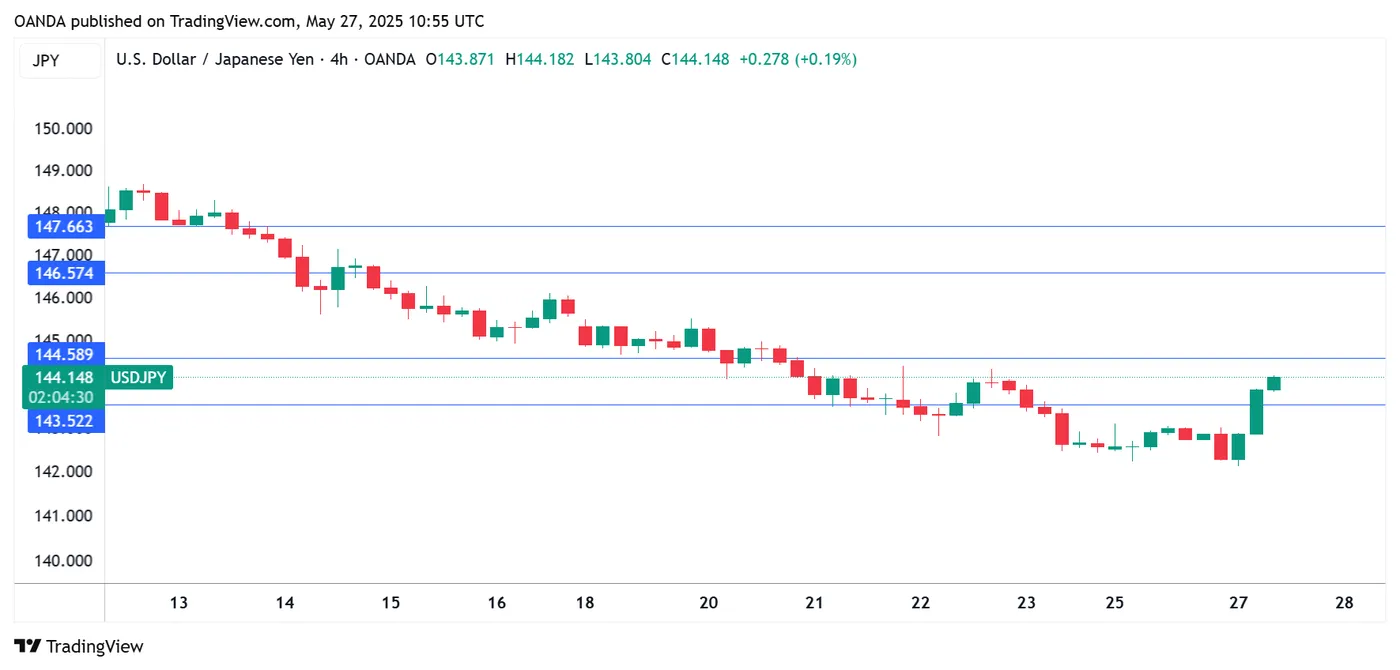
USDJPY 1-week Chart, May 27, 2025
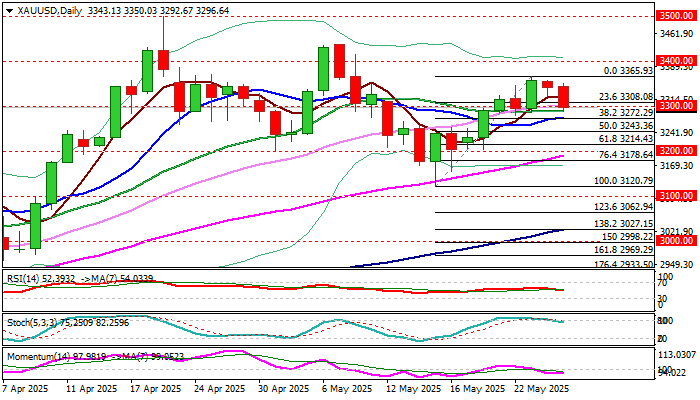
XAU/USD: Gold Eases on Firmer Dollar, Larger Bulls Expected to Remain Intact
Gold price fell on Tuesday morning, as dollar firmed across the board. Fresh weakness emerged after a double failure at pivotal Fibo barrier ($3355, 61.8% of $3500/$3120) with overbought stochastic contributing to negative technical signals.
Dips cracked strong $3300 support zone (Fibo 23.6% of $3120/$3365 / psychological / 20DMA) but were unable to register a clear break lower so far that adds to initial signals of consolidation / limited correction, before larger bulls regain traction.
The notion is supported by growing uncertainty over darkening US fiscal outlook, Fed’s rate trajectory, US tariffs and overheated geopolitical situation that are supportive for safe haven demand.
Extended dips should not exceed support at $3277 (Fibo 38.2% / 10DMA) to mark a healthy correction and keep bulls in play for retest of $3355 and potential extension towards $3400/10 (round-figure / Fibo 76.4%).
Res: 3310; 3323; 3365; 3400.
Sup: 3290; 3277; 3265; 3250.
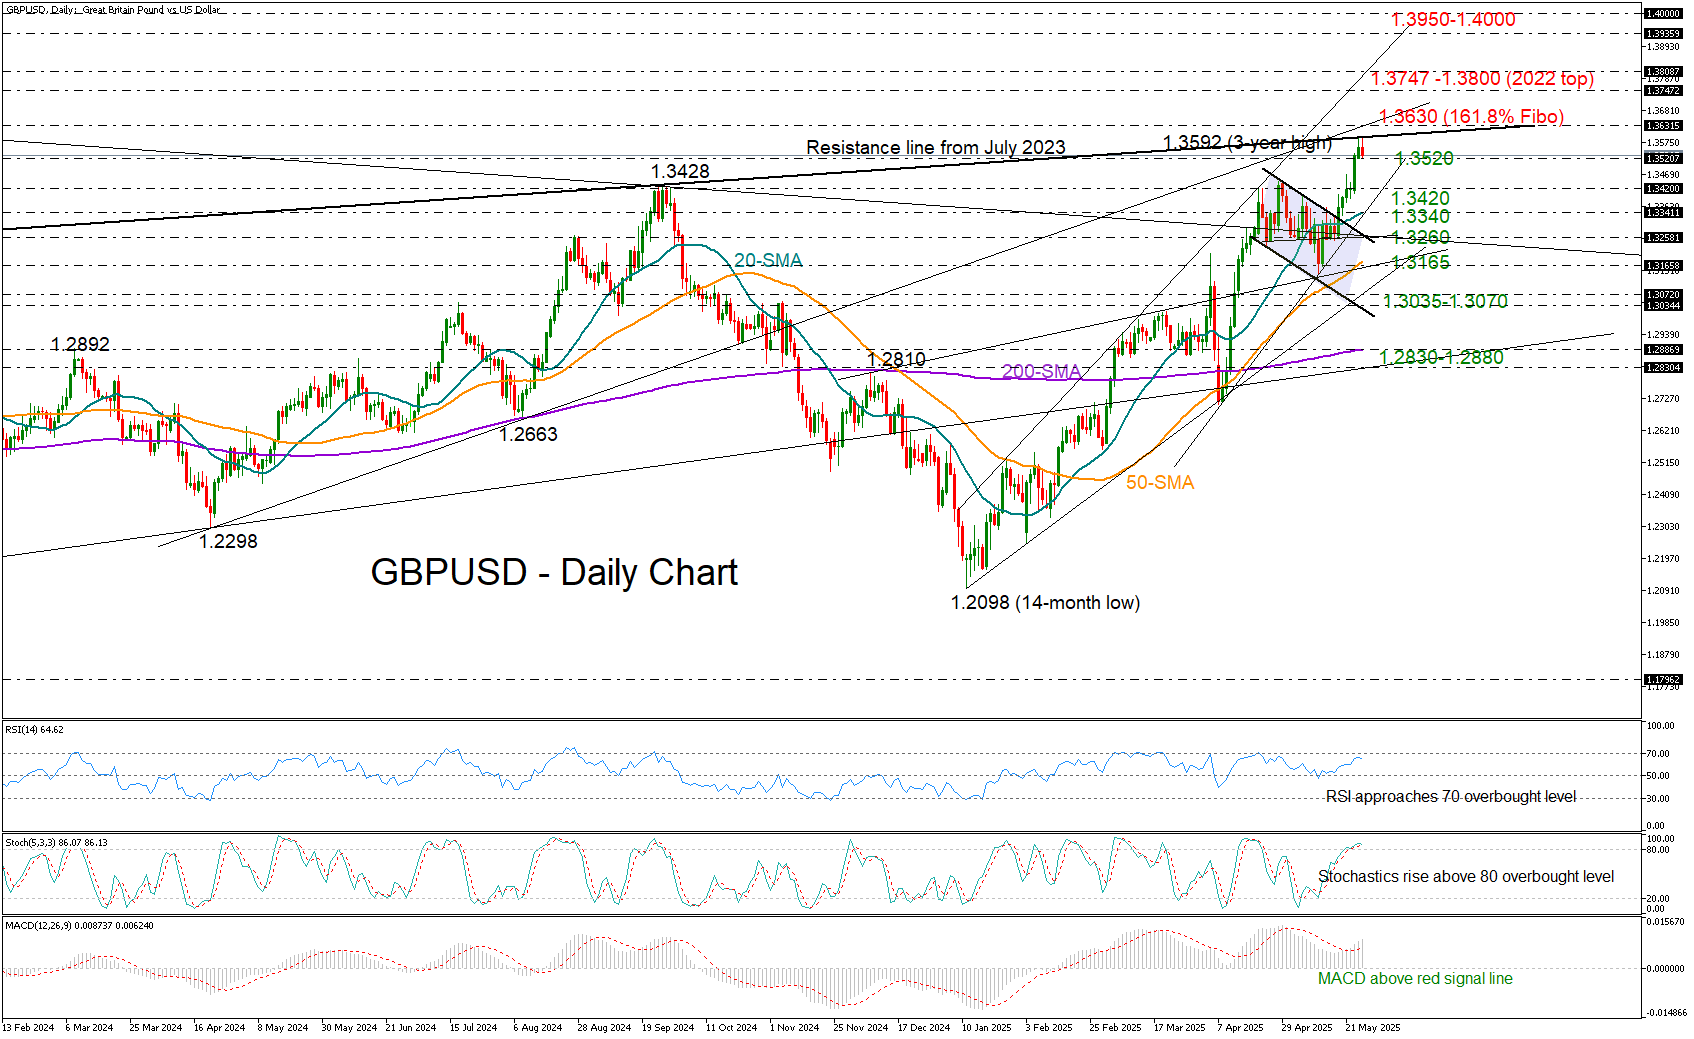
GBP/USD’s Bullish Streak Hits a Wall
- GBP/USD touches key resistance line near 1.3950.
- Overbought conditions emerge after impressive weekly rally.
GBP/USD was trading with softer positive momentum during Tuesday’s early European session, following a surge to a new three-year high of 1.3592 on Monday.
Stronger-than-expected CPI inflation and business PMI figures, combined with a weakening US dollar, triggered a fresh rally last week. However, with the pair now testing a tentative resistance line that connects the highs from July 2023 and September 2024 at 1.3590– after six consecutive winning sessions - a slowdown may be on the horizon. Notably, both the RSI and the stochastic oscillator are approaching overbought territory, increasing the likelihood of a near-term pullback.
If upside momentum fades and the pair retreats below the 1.3520 level, support could emerge near the 1.3420 area or closer to the 20-day simple moving average (SMA), currently positioned at 1.3340. A break below that level could trigger fresh selling pressure, potentially driving the pair down toward 1.3260.
On the upside, a decisive move above the threshold of 1.3590 – and further beyond the 1.3630 zone, where the 161.8% Fibonacci extension of the previous downtrend intersects with the rising trendline from April 2024 and the 2022 resistance region– could open the door to the 2022 peak of 1.3747 and the psychological 1.3800 level, which aligns with the 2025 resistance line. A continued advance could even target the 1.3950–1.4000 zone.
In summary, GBP/USD is currently testing a significant resistance area. With technical indicators signaling overbought conditions, the bullish momentum may pause in the short term.
GBP/USD in a Strong Position: Sterling Rallies on Trade News and Robust Data
The GBP/USD pair surged to 1.3569 on Tuesday, reaching its highest level since February 2022, as the pound capitalised on positive trade developments and strong economic indicators.
Key factors driving GBP/USD movement
The pound's rally stems from improved market sentiment following US President Donald Trump's decision to postpone the imposition of 50% tariffs on EU imports until 9 July. Initially set to take effect on 1 June, the delay has granted diplomats additional time to pursue constructive dialogue and negotiate potential compromises.
This reprieve has boosted global risk appetite, providing further support for the pound, which also drew strength from robust domestic economic data.
UK retail sales rose by 1.2% in April, marking the fourth consecutive monthly increase. These figures underscore the resilience of consumers despite ongoing tax hikes and trade tensions.
Meanwhile, inflation remains elevated at 3.5%, exceeding forecasts and raising some concerns.
The base-case scenario suggests the Bank of England is likely to cut interest rates by 50 basis points by August, with a further reduction possible before the end of the year.
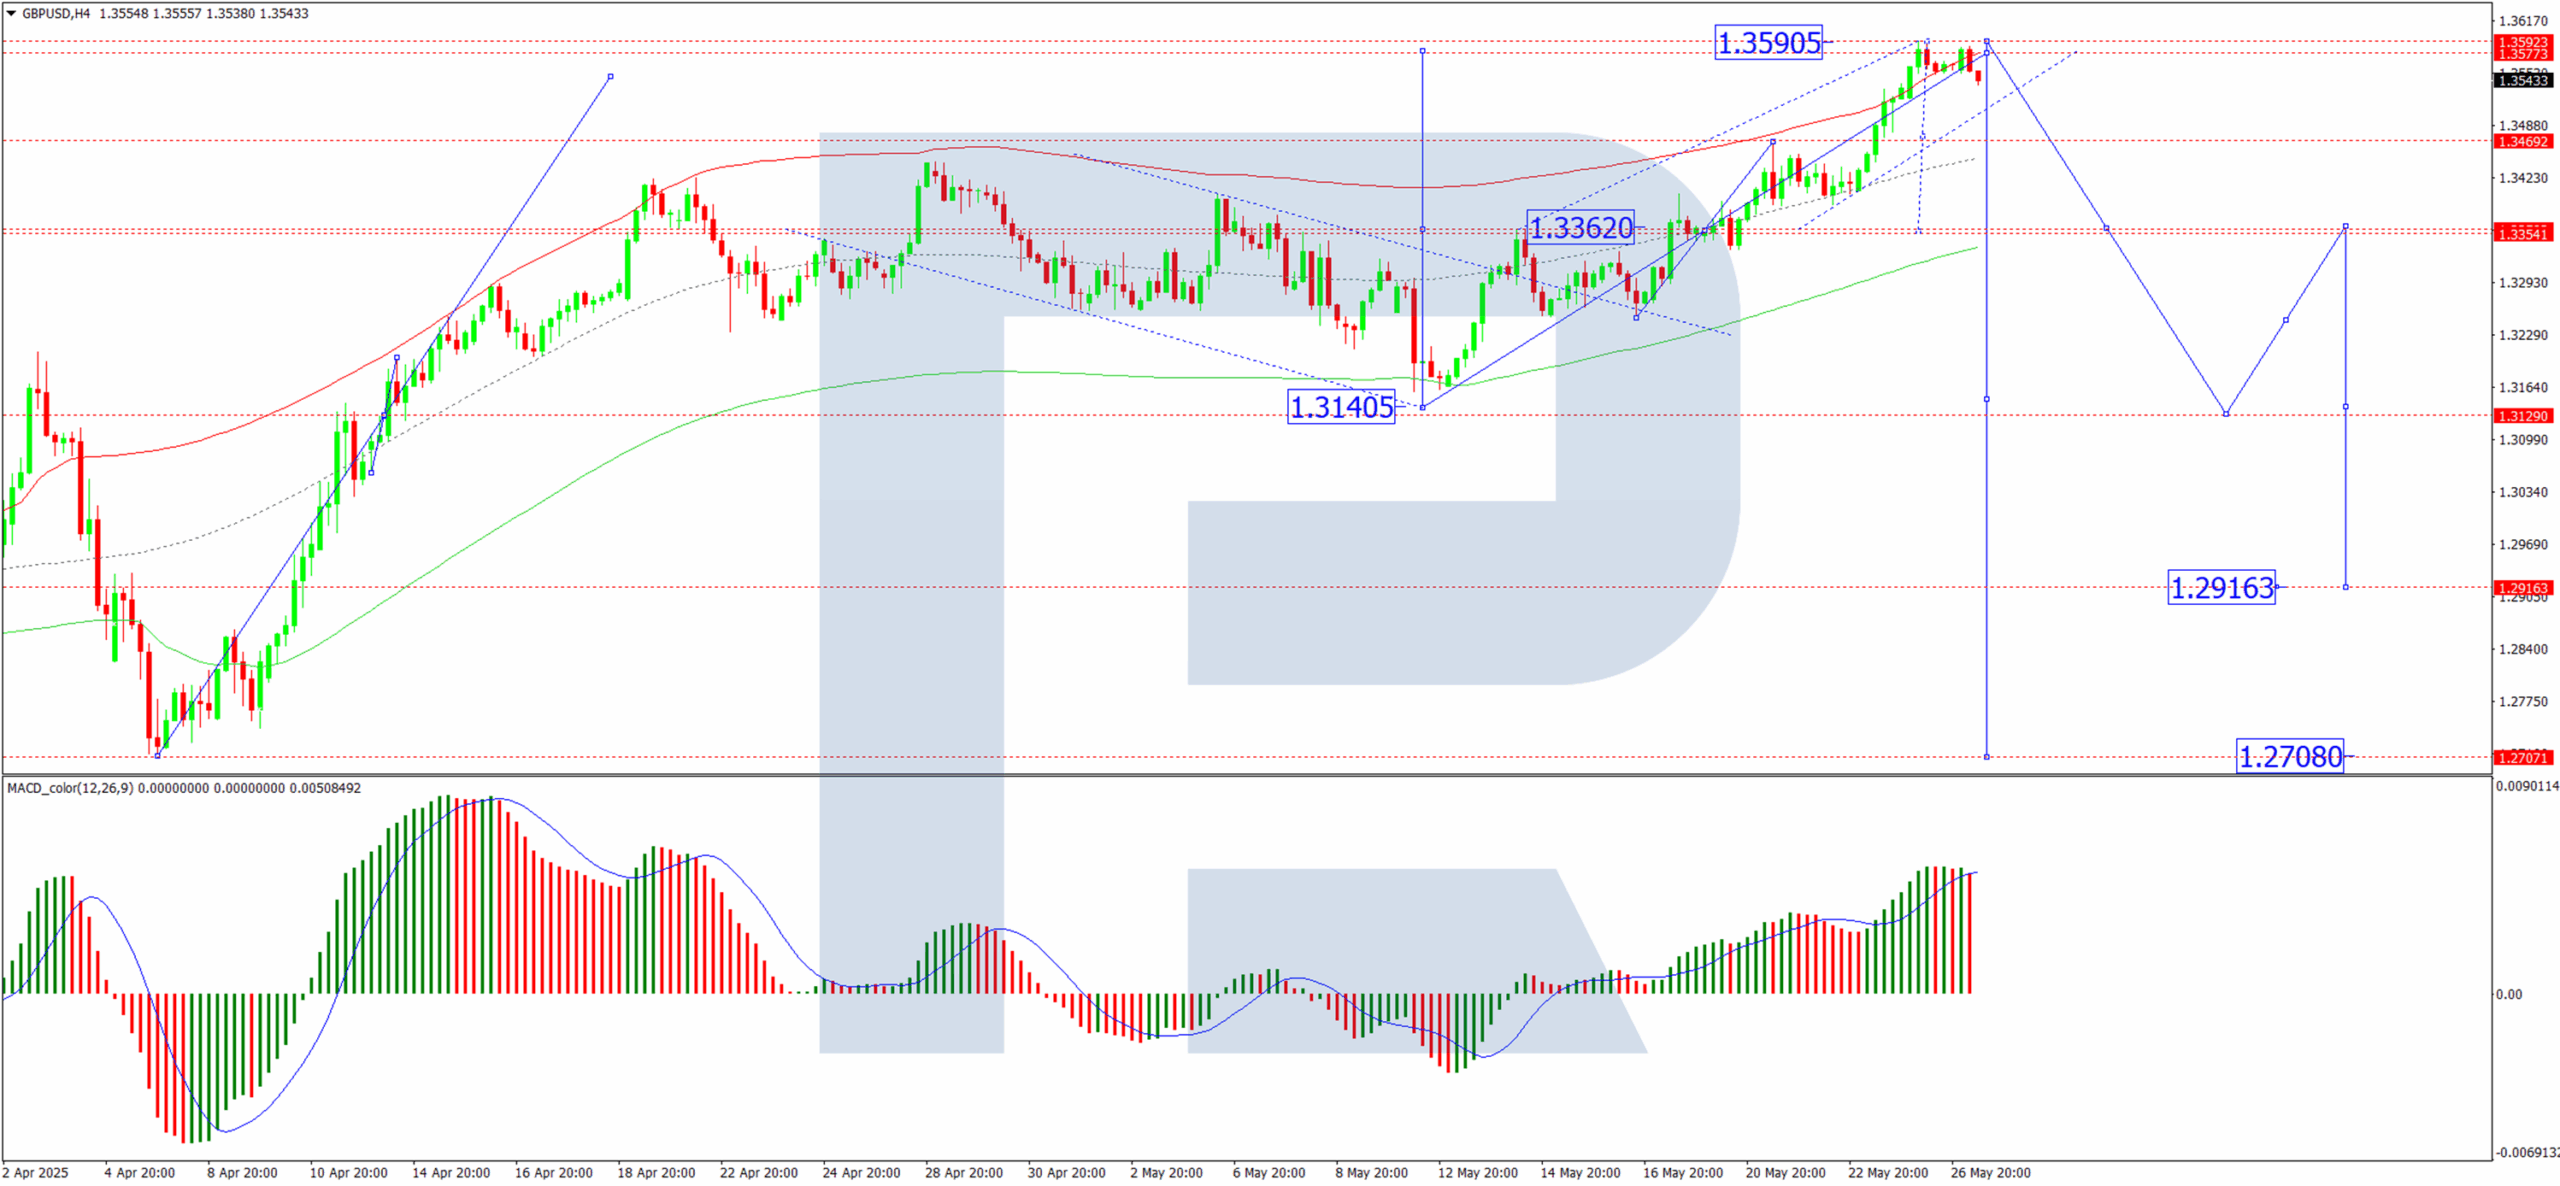
Technical analysis: GBP/USD
H4 Chart:
On the H4 chart, GBP/USD has formed a consolidation range below the 1.3590 level. Today, the pair broke downward out of this range, signalling the likely start of a bearish wave towards 1.3360. A breach of this level could extend the downtrend towards 1.3140, with 1.3360 as the initial target. This scenario is technically supported by the MACD indicator, whose signal line has exited the histogram area and is trending sharply downward.
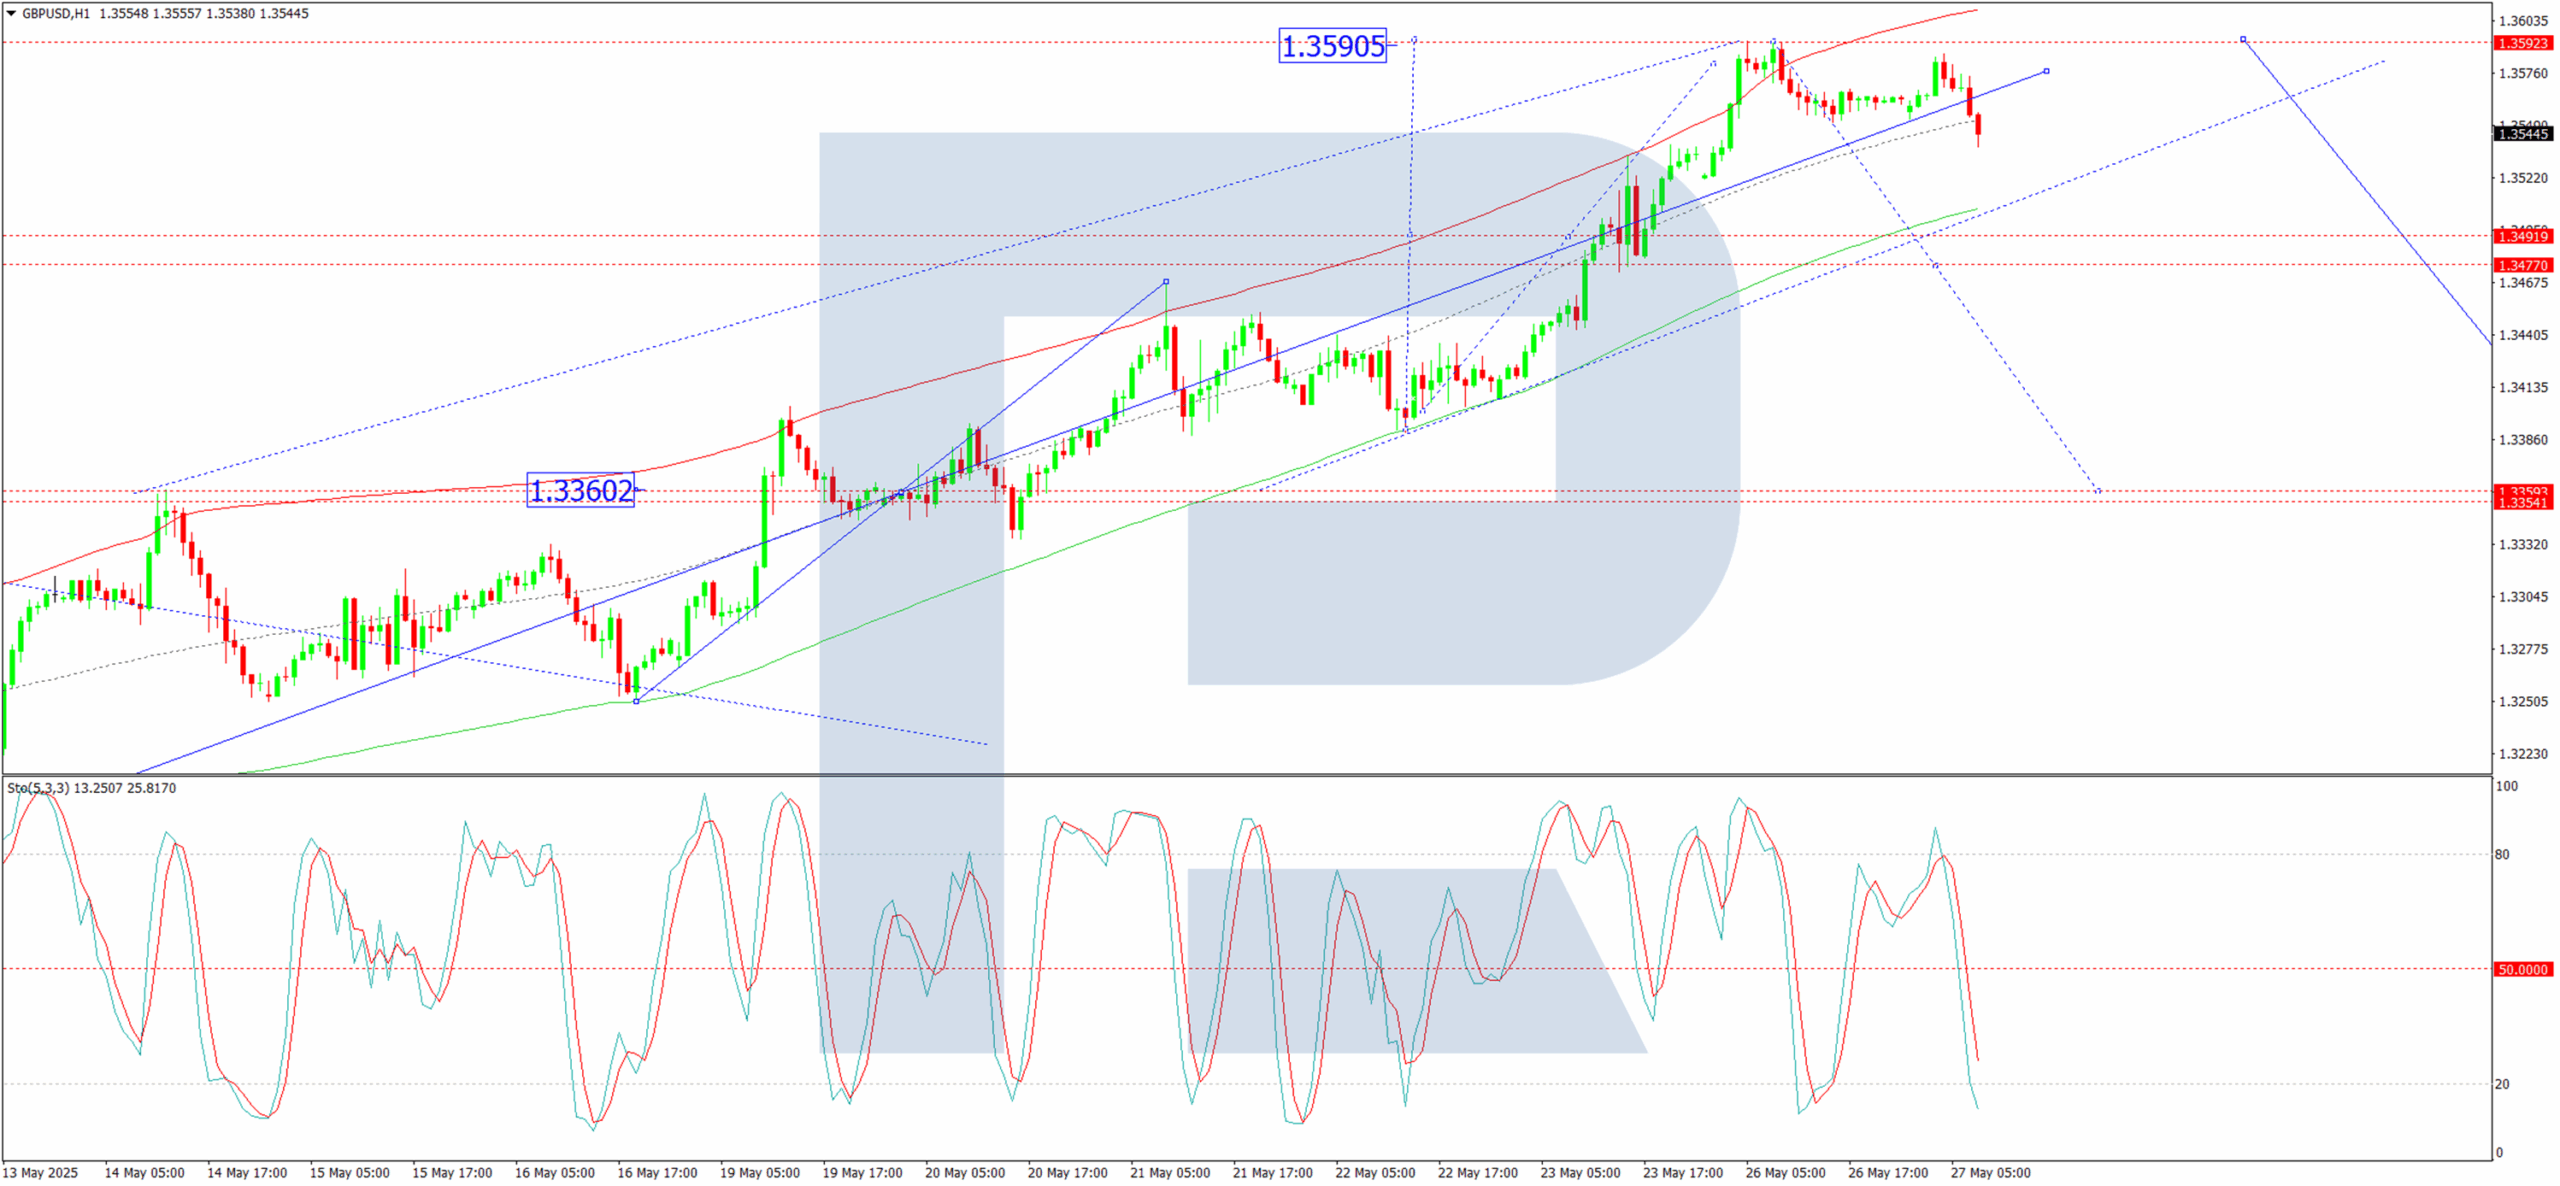
H1 Chart:
On the H1 chart, GBP/USD previously consolidated around 1.3490 before breaking upward and nearly exhausting its bullish potential at 1.3590. Today, the pair formed a new consolidation range below 1.3590 before breaking downward again. We now anticipate a continuation of the bearish movement towards 1.3360. This outlook is corroborated by the Stochastic oscillator, whose signal line remains below 50 and is descending sharply towards 20.
Conclusion
The pound's recent gains reflect a combination of improved risk sentiment and strong UK economic data. However, persistent inflation and expectations of BoE rate cuts introduce downside risks. Technically, GBP/USD shows bearish momentum, with key support levels at 1.3360 and 1.3140 in focus.
Analysing the Volatility Spike on the USD/JPY Chart
The USD/JPY chart offers plenty of noteworthy insights for analysis:
→ A one-month low was recorded today (marked by the arrow);
→ This was followed by a sharp upward reversal, with a series of large bullish candlesticks forming on the intraday chart.
Why Is USD/JPY Moving Sharply Today?
The primary driver appears to be recent statements from Bank of Japan Governor Kazuo Ueda.
According to Trading Economics, this morning Ueda:
→ warned of rising core inflation risks linked to increasing food prices;
→ indicated that the Bank of Japan is prepared to adjust its monetary policy in order to achieve a stable inflation target.
Latest data show that Japan’s core inflation unexpectedly rose to 3.5% — the highest level in two years — reinforcing the case for further rate hikes. However, what's particularly striking is that despite Ueda’s hawkish tone, the yen is weakening.
Technical Analysis of the USD/JPY Chart
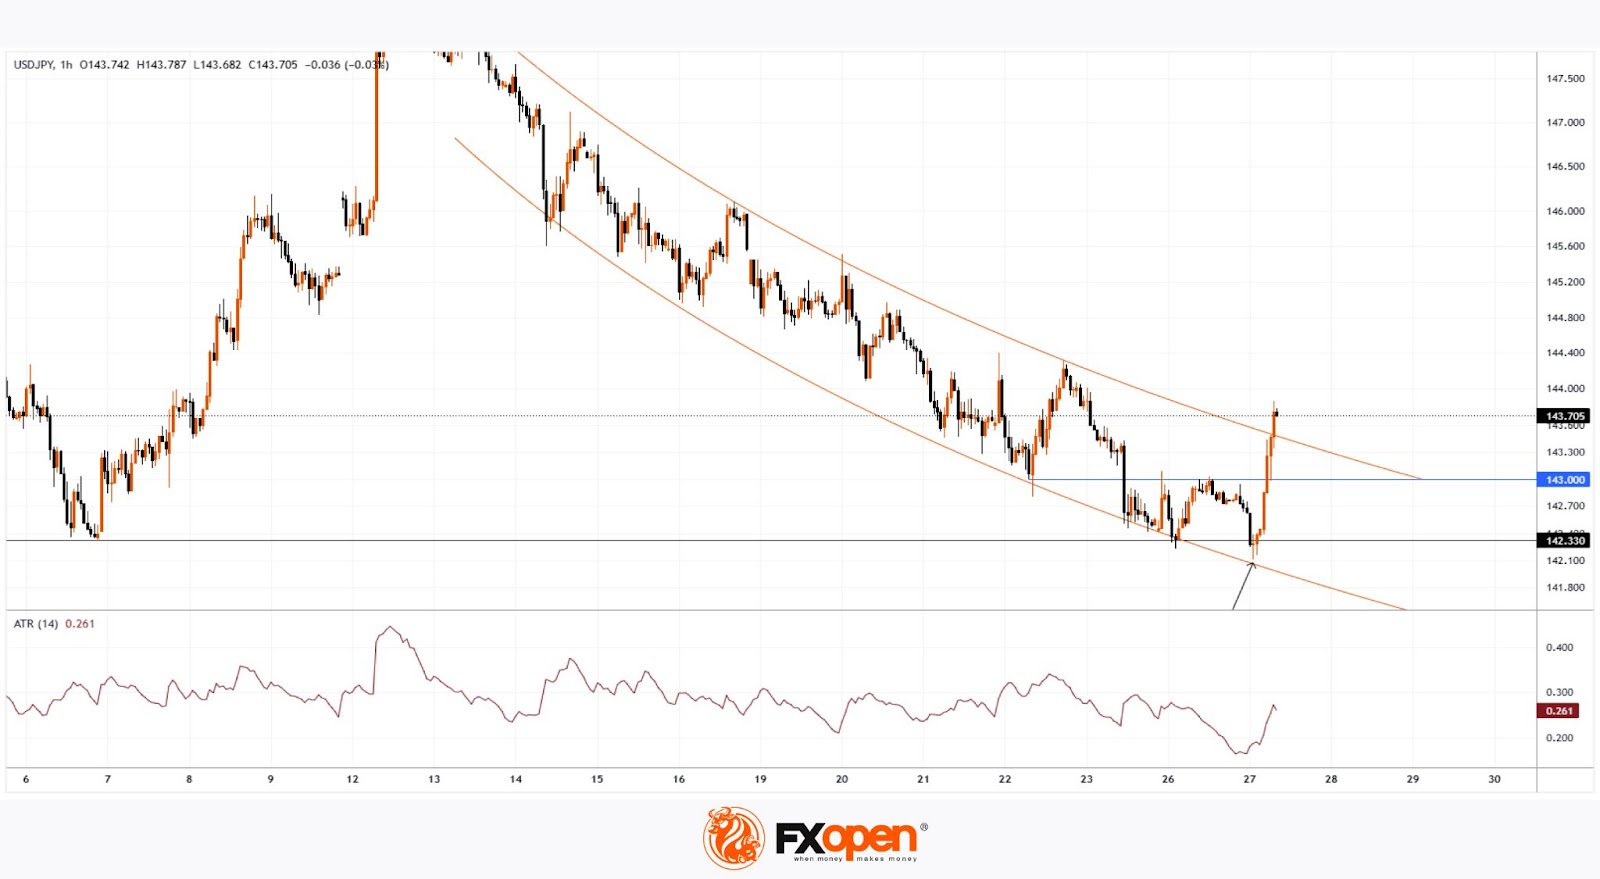
Yen fluctuations formed a downward trajectory (marked in orange) in the second half of May, partly driven by US dollar weakness. Following a period of relative calm, the market has shifted into high gear — the ATR indicator is climbing sharply from multi-month lows, breaking through resistance at the 143.0 level.
This aggressive price action on the USD/JPY chart today suggests we may be witnessing an attempted bullish breakout from the channel. In light of this, it is possible that the surge in volatility reflects a fundamental shift in market sentiment — one that could potentially lead to the development of an upward trend.
Trade over 50 forex markets 24 hours a day with FXOpen. Take advantage of low commissions, deep liquidity, and spreads from 0.0 pips. Open your FXOpen account now or learn more about trading forex with FXOpen.
This article represents the opinion of the Companies operating under the FXOpen brand only. It is not to be construed as an offer, solicitation, or recommendation with respect to products and services provided by the Companies operating under the FXOpen brand, nor is it to be considered financial advice.
Fed’s Kashkari leans cautious on tariff shock, favors holding rates to anchor inflation expectations
Speaking at the IMES conference in Japan, Minneapolis Fed President Neel Kashkari addressed the growing internal debate within Fed over how to respond to the inflationary effects of new US tariffs.
He noted that some policymakers advocate “looking through” these price shocks, viewing them as "transitory", akin to a one-time upward shift in the price level rather than persistent inflation. That approach would favor cutting interest rates to support economic activity during the adjustment period.
However, Kashkari expressed skepticism toward this lenient view. He emphasized that trade negotiations are "unlikely to be resolved quickly"., warning of a prolonged period of elevated uncertainty and the risk of retaliatory measures.
Tariffs on intermediate goods could lead to delayed but persistent inflationary pressure as cost increases pass through to final goods over time.
Given these risks, Kashkari said he finds the case for holding rates steady more persuasive, especially in light of the need on "defending long-run inflation expectations".
While current policy is likely "only modestly restrictive", he argued that caution is warranted until the full effects of tariffs become clearer.
ECB’s Villeroy and Simuks Signal June rate cut
Comments from ECB Governing Council members today reinforced expectations for a rate cut in June, as inflation continues to moderate across the Eurozone.
French central bank chief François Villeroy de Galhau noted that policy normalization is “probably not complete,” and hinted that the upcoming ECB meeting is likely to deliver further action. He pointed to France’s May inflation reading of just 0.6% as a "very encouraging sign of disinflation in action"
Separately, Lithuania’s Gediminas Šimkus struck a dovish tone, stating that the balance of inflation risks has shifted to the downside, citing trade frictions with the US and a stronger Euro as deflationary forces. He added that current borrowing costs sit at the upper bound of the neutral range, leaving room for more rate reductions.
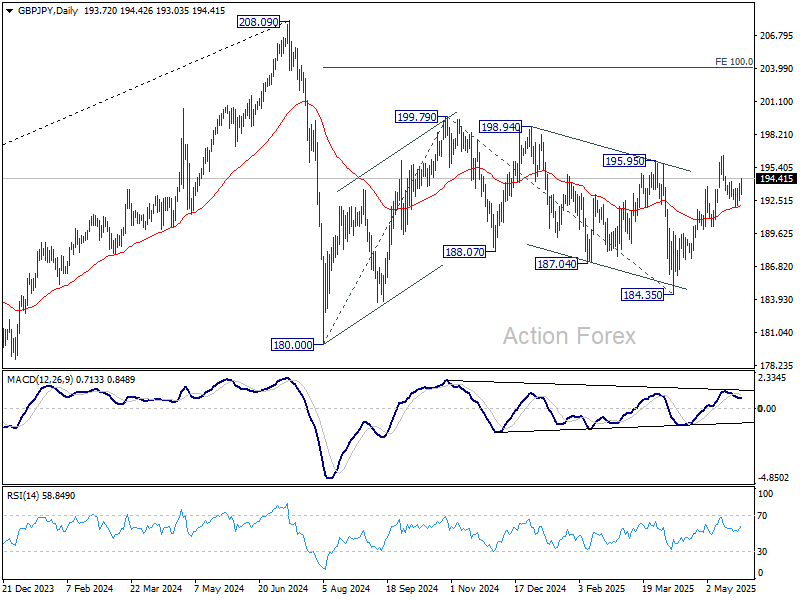
GBP/JPY Daily Outlook
Daily Pivots: (S1) 192.96; (P) 193.50; (R1) 194.29; More...
Break of 194.18 minor resistance suggests that GBP/JPY's pullback from 196.38 has completed at 191.867. Intraday bias is back on the upside for 196.38 resistance next. For now, risk will stay on the upside as long as 191.86 support holds.
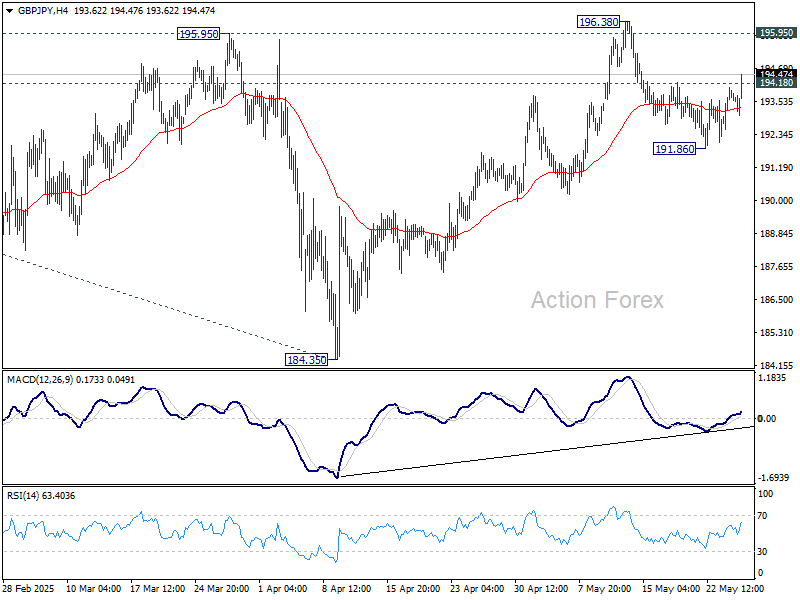
In the bigger picture, price actions from 208.09 are seen as a correction to rally from 123.94 (2020 low). Strong support should be seen from 38.2% retracement of 123.94 to 208.09 at 175.94 to contain downside. However, sustained break of 175.94 will bring deeper fall even still as a correction.
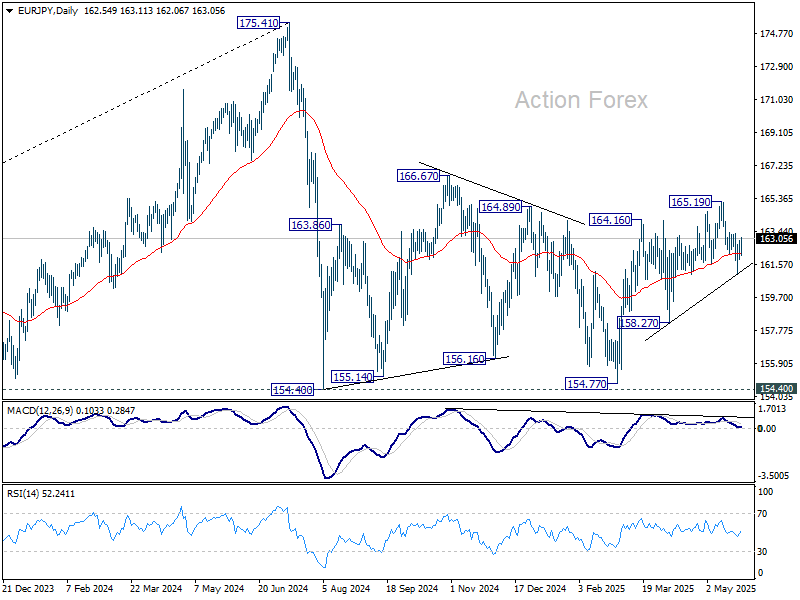
EUR/JPY Daily Outlook
Daily Pivots: (S1) 162.04; (P) 162.51; (R1) 163.11; More...
Intraday bias in EUR/JPY remains neutral at this point. Above 163.35 minor resistance will suggest that fall from 165.19 has completed as a correction, and rise from 154.77 is still in progress. Intraday bias will be turned back to the upside for 165.19 next. On the downside, break of 161.06 will resume the fall from 165.19 to 158.27 support.
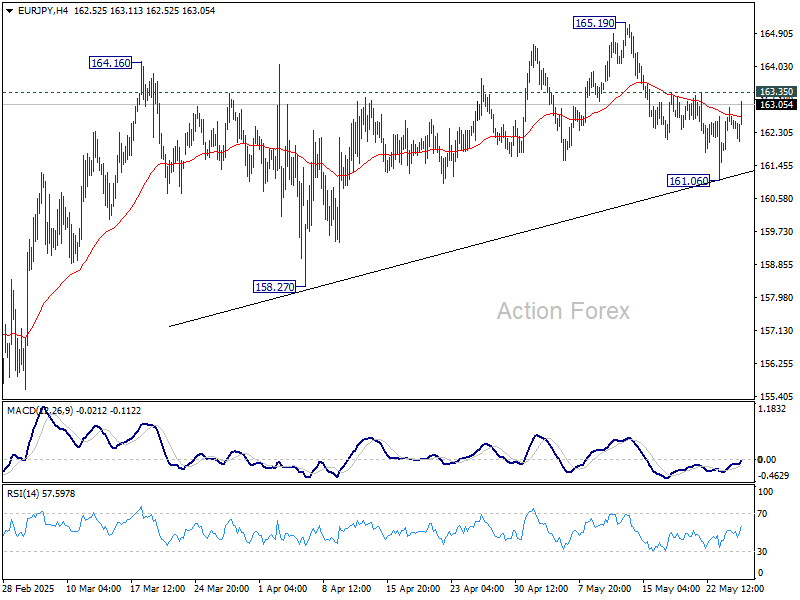
In the bigger picture, price actions from 175.41 are seen as correction to rally from 114.42 (2020 low). Strong support should be seen from 38.2% retracement of 114.42 to 175.41 at 152.11 to contain downside. However, sustained break of 152.11 will bring deeper fall even still as a correction.