
Sample Category Title
USD/CAD Daily Outlook
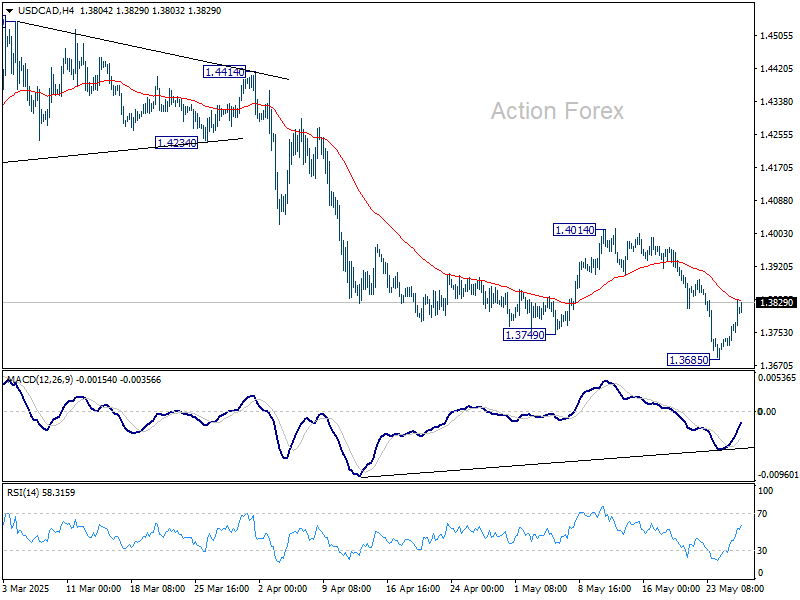
Daily Pivots: (S1) 1.3745; (P) 1.3791; (R1) 1.3859; More...
Intraday bias in USD/CAD remains neutral for consolidations above 1.3685 temporary low. Upside should be limited well below 1.4014 resistance to bring another fall. Break of 1.3685 will resume whole decline from 1.4791.
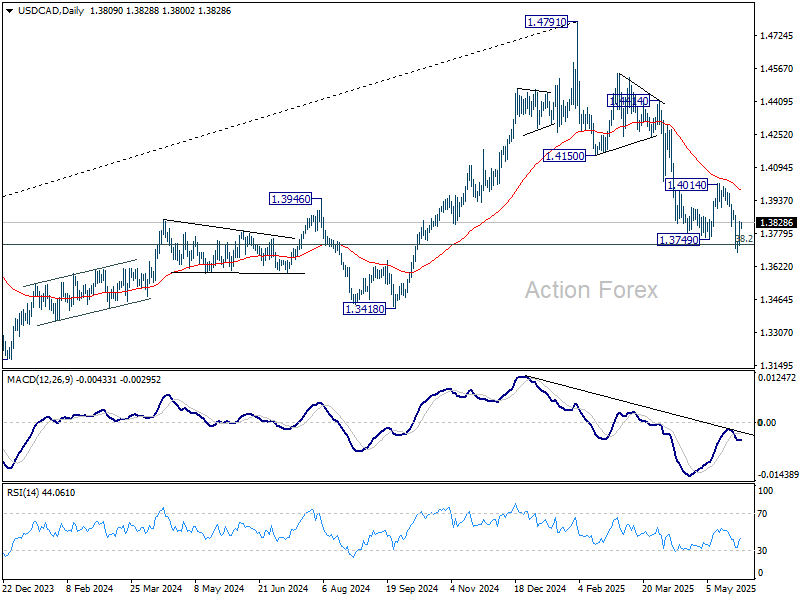
In the bigger picture, price actions from 1.4791 medium term top could either be a correction to rise from 1.2005 (2021 low), or trend reversal. In either case, further decline is expected as long as 1.4014 resistance holds. Firm break of 38.2% retracement of 1.2005 (2021 low) to 1.4791 at 1.3727 will pave the way back to 61.8% retracement at 1.3069.
AUD/USD Daily Report
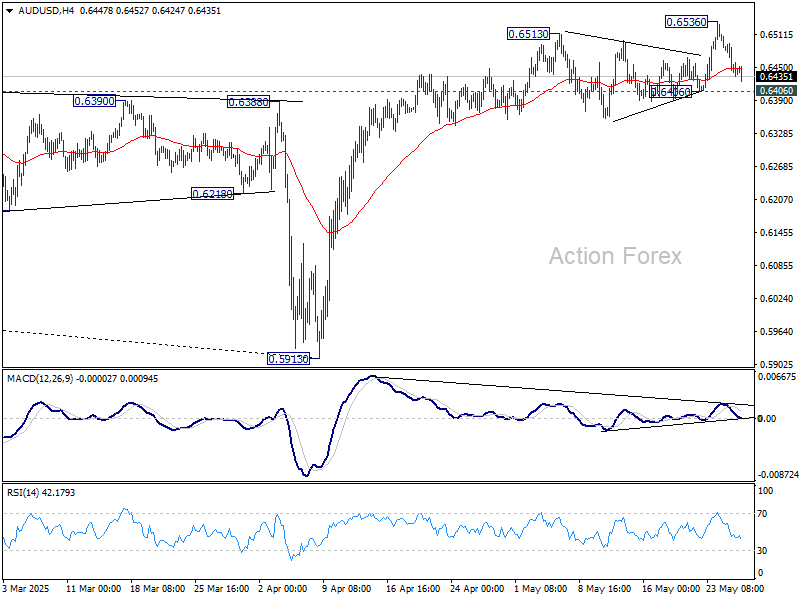
Daily Pivots: (S1) 0.6417; (P) 0.6460; (R1) 0.6484; More...
Intraday bias in AUD/USD remains neutral and further rally is expected as long as 0.6406 support holds. Break of 0.6536 will resume whole rally from 0.5913. However, firm break of 0.6406 will confirm short term topping, and turn bias back to the downside for 55 D EMA (now at 0.6376).
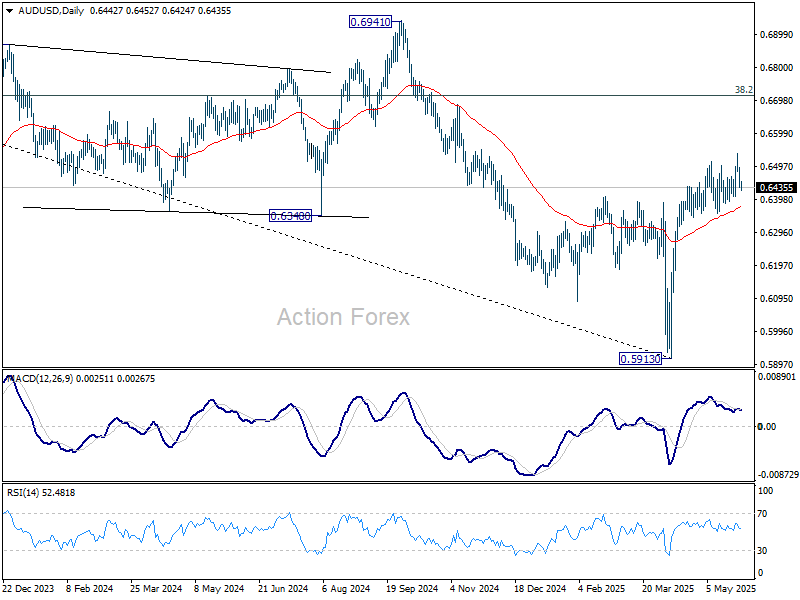
In the bigger picture, 55 W EMA (now at 0.6439) is considered taken out. A medium term bottom should already be in place at 0.5913. Rise from there could either be a corrective move, or reversing whole down trend from 0.8006 (2021 high). In either case, further rise is now expected as long as 55 D EMA (now at 0.6376) holds. Next target is 38.2% retracement of 0.8006 to 0.5913 at 0.6713.
EUR/USD Daily Outlook
Daily Pivots: (S1) 1.1299; (P) 1.1353; (R1) 1.1382; More...
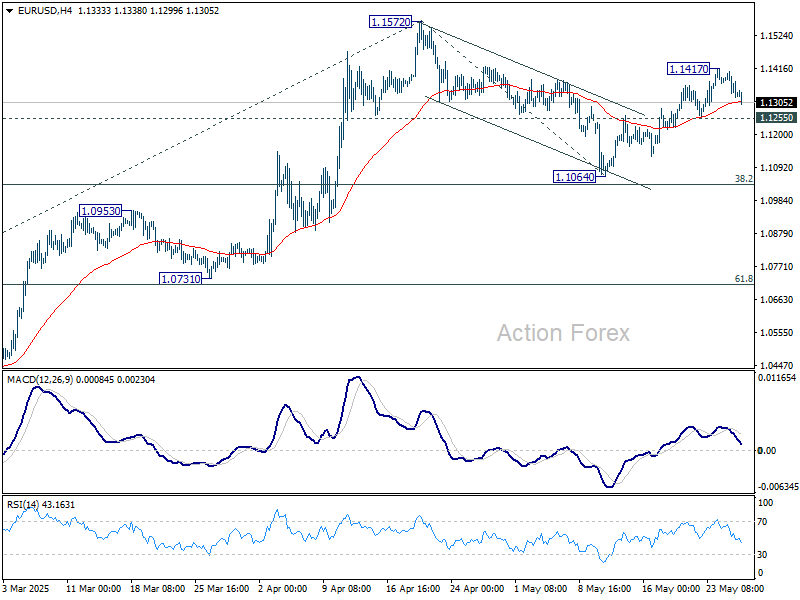
Intraday bias in EUR/USD remains neutral and further rise is still in favor as long as 1.1255 support holds. Above 1.1417 will bring retest of 1.1572 high first. Decisive break there will resume larger up trend to 61.8% projection of 1.0176 to 1.1572 from 1.1064 at 1.1927. On the downside, however, break of 1.1255 will turn bias back to the downside to extend the corrective pattern from 1.1572 with another falling leg.
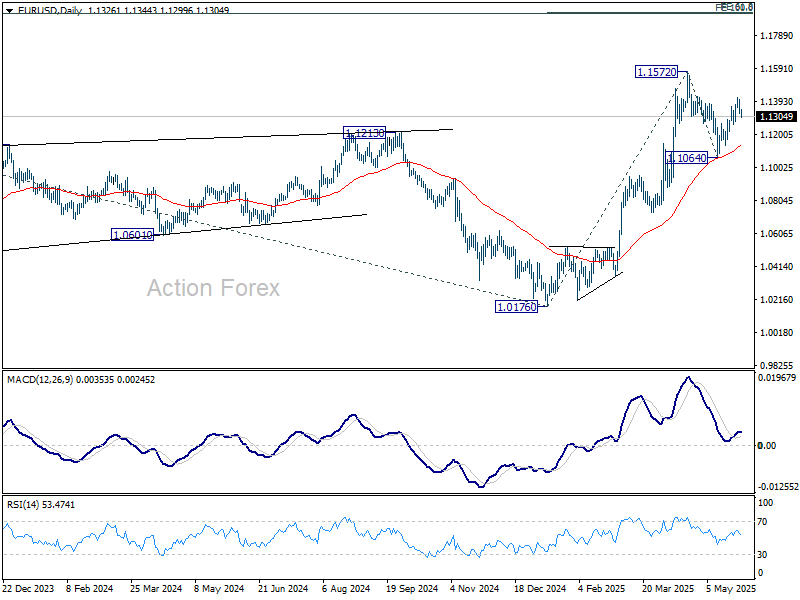
In the bigger picture, rise from 0.9534 long term bottom could be correcting the multi-decade downtrend or the start of a long term up trend. In either case, further rise should be seen to 100% projection of 0.9534 to 1.1274 from 1.0176 at 1.1916. This will now remain the favored case as long as 55 W EMA (now at 1.0858) holds.
GBP/USD Daily Outlook
Daily Pivots: (S1) 1.3476; (P) 1.3531; (R1) 1.3563; More...
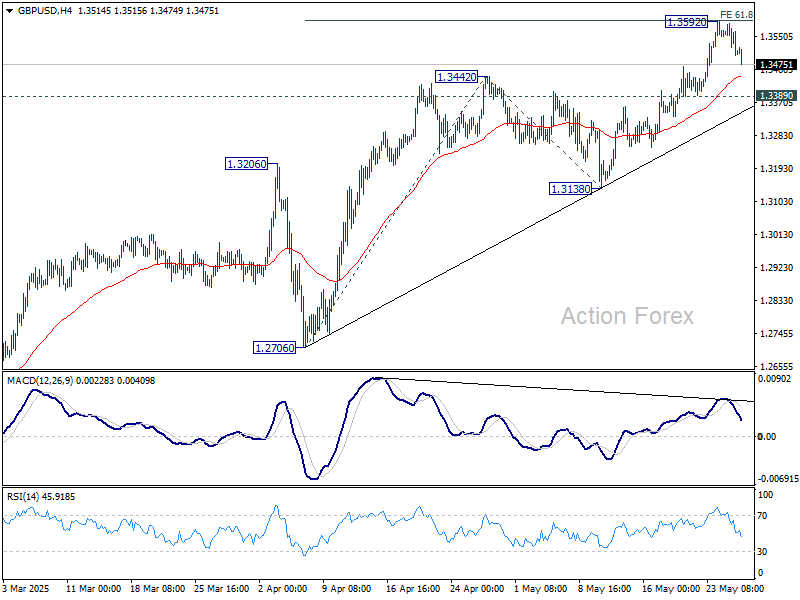
Intraday bias in GBP/USD remains neutral and more consolidations could be seen. Further rise is expected as long as 1.3389 minor support holds. On the upside, firm break of 1.3592 will resume larger rally for 100% projection of 1.2706 to 1.3442 from 1.3138 at 1.3874. However, decisive break of 1.3389 will confirm short term topping, and turn bias back to the downside for 1.3138 support instead.
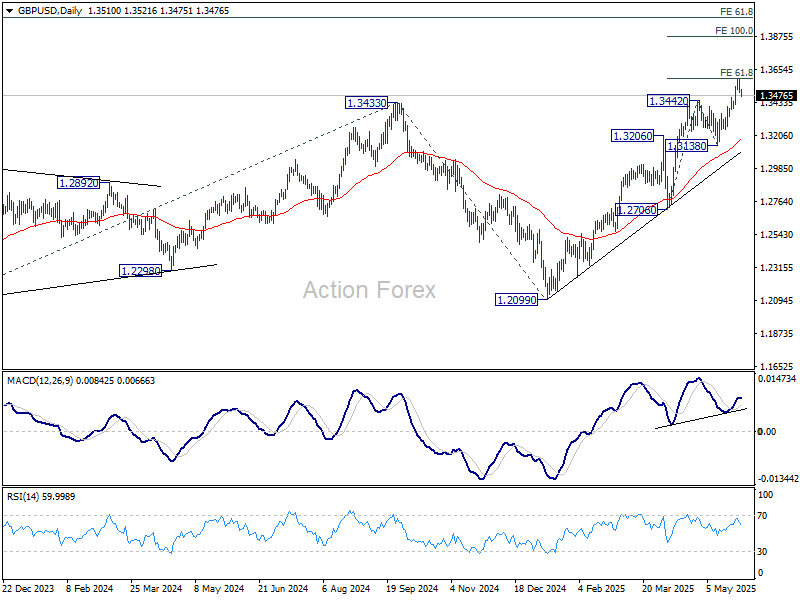
In the bigger picture, up trend from 1.3051 (2022 low) is in progress. Next medium term target is 61.8% projection of 1.0351 to 1.3433 from 1.2099 at 1.4004. Outlook will now stay bullish as long as 55 W EMA (now at 1.2870) holds, even in case of deep pullback.
USD/CHF Daily Outlook
Daily Pivots: (S1) 0.8214; (P) 0.8247; (R1) 0.8306; More….
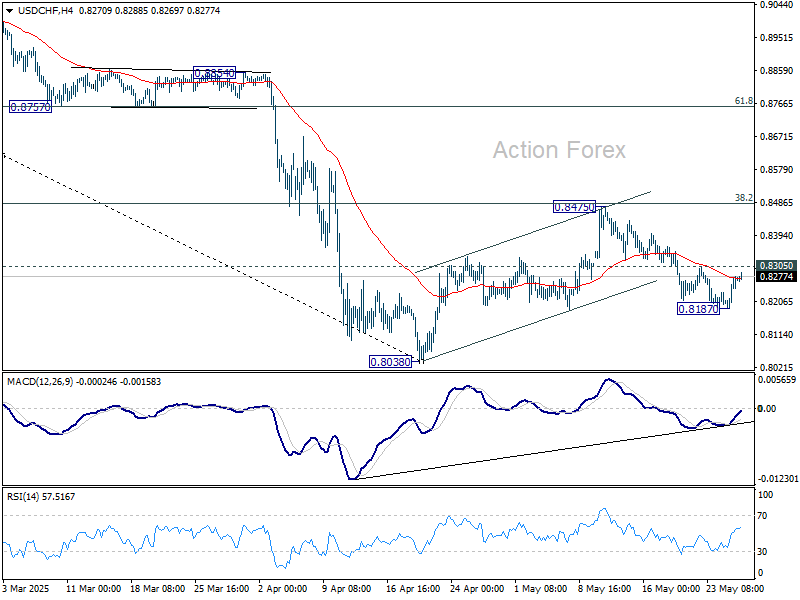
Intraday bias in USD/CHF remains neutral at this point. Another fall is in favor as long as 0.8305 minor resistance holds. Below 0.8187 will target a retest on 0.8038 low first. Firm break there will resume larger down trend. Nevertheless, sustained break of 0.8305 will argue that pullback from 0.8475 has completed, and turn bias back to the upside to extend the pattern from 0.8038 with another rising leg.
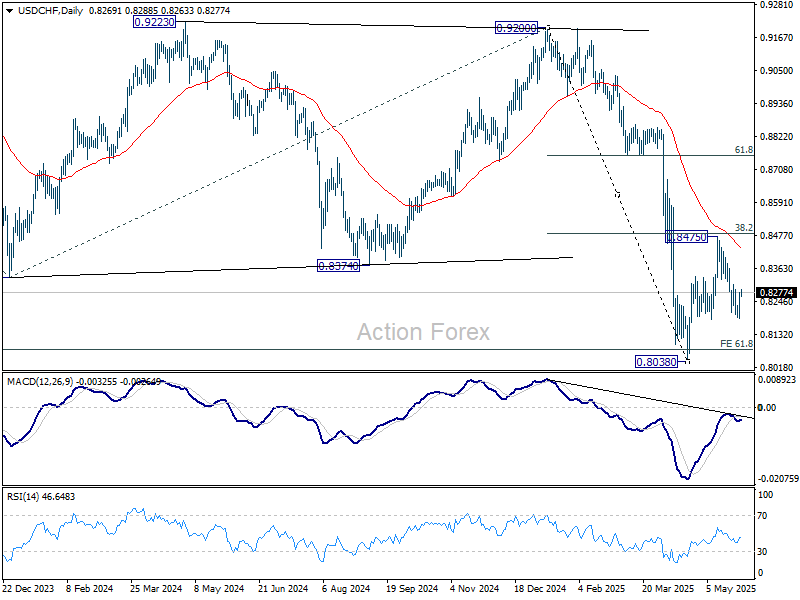
In the bigger picture, long term down trend from 1.0342 (2017 high) is still in progress and met 61.8% projection of 1.0146 (2022 high) to 0.8332 from 0.9200 at 0.8079 already. In any case, outlook will stay bearish as long as 55 W EMA (now at 0.8713) holds. Sustained break of 0.8079 will target 100% projection at 0.7382.
USD/JPY Daily Outlook
Daily Pivots: (S1) 142.83; (P) 143.64; (R1) 145.17; More...
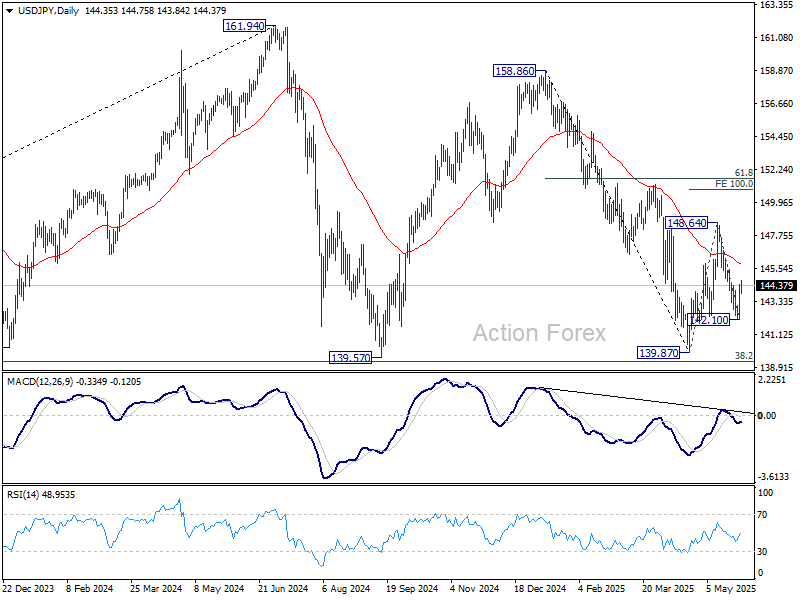
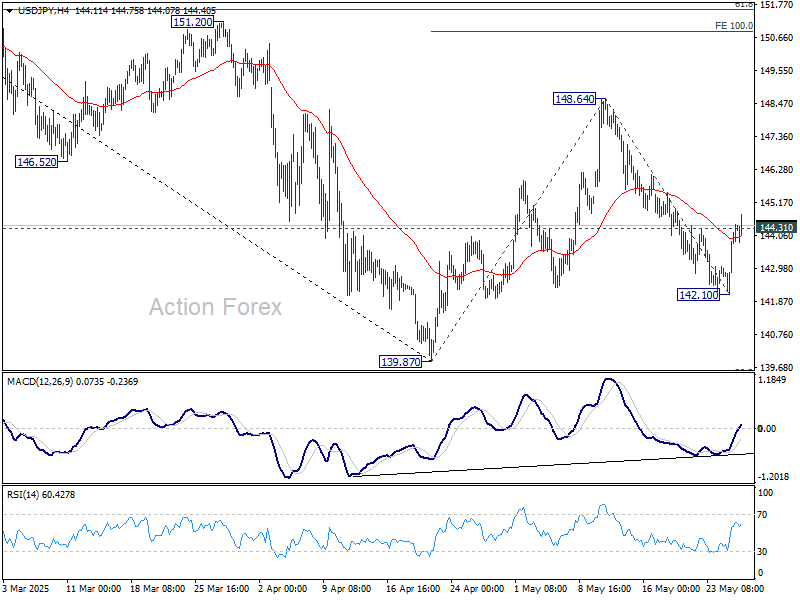
USD/JPY's break of 144.31 resistance suggests that fall from 148.64 might have completed as a correction at 142.10. Intraday bias is back on the upside for 55 D EMA (now at 145.83). Sustained break there will affirm this case and target 148.64 resistance and above. Nevertheless, break of 142.10 will turn bias back to the downside for 139.87 low instead.

In the bigger picture, price actions from 161.94 are seen as a corrective pattern to rise from 102.58 (2021 low), with fall from 158.86 as the third leg. Strong support should be seen from 38.2% retracement of 102.58 to 161.94 at 139.26 to bring rebound. However, sustained break of 139.26 would open up deeper medium term decline to 61.8% retracement at 125.25.
Dollar Rides Optimism Wave; RBNZ Lifts Kiwi, Aussie Ignores CPI Surprise
Dollar's broad-based rebound gained further momentum in Asian session today. The turnaround in risk appetite has been key in lifting the greenback, which had come under pressure amid recent tariff tensions and soft economic signals. The rebound is also visible across asset classes, US equities have reversed losses tied to US-EU trade fears, and the 10-year yield has returned to levels seen before last week’s Treasury selloff.
This shift in tone followed US President Donald Trump's decision to postpone the implementation of a 50% tariff on EU goods until July 9. Trump further noted overnight that the EU had reached out to set up meeting dates, describing the latest developments as “positive.”
Elsewhere, Kiwi saw a jump following RBNZ’s 25bps rate cut to 3.25%. What surprised markets was the internal division within the committee, as one member dissented and preferred no change. The minutes revealed a genuine debate on the merits of holding rates steady to better assess trade-related uncertainties and their inflationary implications. The signal was clear: while more easing is possible, the path ahead will not be automatic.
Aussie, by contrast, showed a muted response to stronger-than-expected monthly CPI data. Although core inflation edged higher, it remains comfortably within the RBA’s 2–3% target band. As such, the print is unlikely to alter RBA’s policy course. With quarterly inflation data due on July 30, the central bank is expected to wait until its August meeting to make a more informed decision on the next move, likely another 25bps cut.
In terms of performance, Dollar is currently leading for the week, followed by Sterling and then Euro. Yen is the weakest major, pressured by falling long dated Japanese government bond yields. Aussie and Swiss Franc are also lagging. Kiwi and Loonie sit in the middle of the pack.
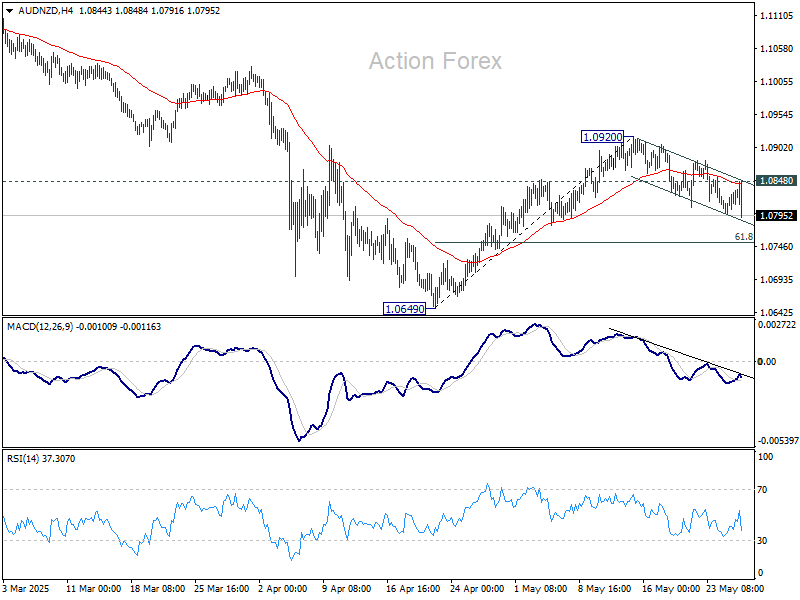
Technically, AUD/NZD is extending the near term fall from 1.0920 today. For now, without clear downside momentum, this decline is still seen as a corrective move. Break of 1.0848 resistance will argue that rebound from 1.0649 is ready to resume through 1.0920 resistance. However, clear break of the lower channel support will argue that the cross is accelerating downward. That would raise the chance that it's actually resume the larger down trend through 1.0649 low.
In Asia, at the time of writing, Nikkei is up 0.52%. Hong Kong HSI is down -0.43%. China Shanghai SSE is up 0.03%. Singapore Strait Times is up 0.44%. Japan 10-year JGB yield is up 0.033 at 1.499. Overnight, DOW rose 1.78%. S&P 500 rose 2.05%. NASDAQ rose 2.47%. 10-year yield fell -0.75 to 4.434.
RBNZ cuts OCR to 3.25%, one member favors holding steady
RBNZ lowered the Official Cash Rate by 25 basis points to 3.25%, in line with market expectations. The decision was not unanimous, passed by a 5-1 vote.
The central bank emphasized that inflation is now within the target band and is "well placed" to respond to both domestic and international developments.
Meeting minutes revealed that some committee members favored holding the rate steady at 3.50%, citing a desire to monitor elevated global uncertainty and potential inflation risks stemming from recent tariff increases.
Maintaining the OCR, they argued, could have helped anchor inflation expectations more firmly around the 2% midpoint.
In its accompanying Monetary Policy Statement, RBNZ revised down its rate path projections slightly. The OCR is now expected to fall to 3.12% by September 2025 (previously 3.23%), and to 2.87% by June 2026 (previously 3.10%).
Australia’s monthly CPI unchanged 2.4%, core inflation edges higher
Australia’s monthly CPI held steady at 2.4% yoy in April, slightly above expectations of 2.3% yoy, marking the third consecutive month of unchanged headline inflation.
However, underlying inflation measures moved higher, with CPI excluding volatile items and holiday travel rising to 2.8% yoy from 2.6% yoy. Trimmed mean CPI also tickd up from 2.7% yoy to 2.8% yoy.
These developments suggest that while headline inflation appears stable, price pressures beneath the surface remain persistent.
Key contributors to the annual inflation rate included food and non-alcoholic beverages (+3.1%), recreation and culture (+3.6%), and housing (+2.2%).
BoJ's Ueda highlights focus on short- and medium-term rates
BoJ Governor Kazuo Ueda told parliament today that shifts in short- and medium-term interest rates have a more pronounced impact on economic activity than movements in super-long yields.
He explained that corporate and household debt is more concentrated in those shorter maturities, making the economy more sensitive to changes in that segment of the yield curve.
However, Ueda also acknowledged the spillover effects of volatility in super-long bond yields, noting that sharp moves in that part of the curve can ripple through to shorter maturities and influence overall financial conditions.
"We'll carefully watch market developments and their impact on the economy, he emphasized.
Fed’s Williams stresses need for vigilance on inflation expectations
New York Fed President John Williams emphasized the importance of acting decisively to prevent inflation from becoming entrenched, warning that delayed responses risk making price pressures permanent.
Speaking at a conference in Tokyo, Williams noted, "you want to avoid inflation becoming highly persistent because that could become permanent".
"And the way to do that is to respond relatively strongly" when inflation begins to deviate from target.
He also highlighted the sensitivity of inflation expectations, cautioning that any significant shift could be "detrimental" to economic stability.
USD/JPY Daily Outlook
Daily Pivots: (S1) 142.83; (P) 143.64; (R1) 145.17; More...
USD/JPY's break of 144.31 resistance suggests that fall from 148.64 might have completed as a correction at 142.10. Intraday bias is back on the upside for 55 D EMA (now at 145.83). Sustained break there will affirm this case and target 148.64 resistance and above. Nevertheless, break of 142.10 will turn bias back to the downside for 139.87 low instead.
In the bigger picture, price actions from 161.94 are seen as a corrective pattern to rise from 102.58 (2021 low), with fall from 158.86 as the third leg. Strong support should be seen from 38.2% retracement of 102.58 to 161.94 at 139.26 to bring rebound. However, sustained break of 139.26 would open up deeper medium term decline to 61.8% retracement at 125.25.

Australia: April Monthly CPI Indicator
First pass suggests an upside risk to our June quarter CPI estimate of 0.8%qtr (2.2%yr) but a more modest upside risk to our Trimmed Mean estimate of 0.6%qtr (2.7%yr).
The Monthly CPI Indicator gained 2.4% in the year to April, stronger than Westpac’s estimate of 1.9%yr and just a touch more than the market’s estimate of 2.3%yr. There was a reasonably wide range of estimates this month, from a high of 2.6%yr to a low of 1.9%yr.
The CPI Indicator was 0.8% month-on-month, stronger than Westpac’s published monthly near-cast of 0.3% with the result boosted by a larger than expected increase in medical & hospital services and dwelling prices. The Trimmed Mean estimate for April was 2.8%yr, up very slightly from a 2.7%yr pace in March.
Westpac’s estimate for the June quarter Trimmed Mean is 2.7%yr falling to 2.6%yr in the September quarter.
Based on the data from the April Monthly CPI Indicator, we see no compelling reasons to change our current June quarter CPI estimate: 0.8%qtr/2.2%yr for the headline CPI and 0.6%qtr/2.7%yr for the Trimmed Mean.
April Monthly CPI Indicator in more detail
Excluding volatile items & holiday travel, the Monthly CPI came in at 2.8%yr in April, a modest increase from the 2.6%yr pace in March. This series excludes automotive fuel, fruit and vegetables, and holiday travel and accommodation.
Electricity prices gained 1.5% in the month compared to the risk of a small decline we expected, with the June quarter rebates rolling in. Clearly, the ending of the Qld $1,000 lump sum rebates is still pushing up national average prices.
The overall impact of the rebates is clear with the ABS calculating that electricity prices falling –6.5% in the year to April. Including government electricity rebates, electricity prices for households have fallen by 1.0% since June 2023. Excluding these rebates, electricity prices for households would have increased 17.6% since June 2023.
The Commonwealth government has extended the EBRF for six months to end 2025 with households receiving an additional quarterly payment of $75 in the September and December quarters. This delays the full rebound in electricity prices until early 2026. We don’t expect the Qld government to repeat the $1,000 lump sum rebate but it is likely that WA will repeat the energy rebate programme.
April is the first month of the quarter and provides an update on the following quarterly price surveys which are predominately durable goods. As these prices are survey only once a quarter they flow directly into our June quarterly estimate. In April we had updates on:
- Garments for infants & children: 5.0% (6.0% fcs)
- Footwear for men: 5.5% (1.7% fcs)
- Footwear for women: 7.4% (3.1% fcs)
- Footwear for infants & children: –0.3% (5.2% fcs)
- Clothing accessories: –1.3% (2.1% fcs)
- Cleaning, repair & hire of clothing: 1.3% (0.5% fcs)
- Maintenance & repair of dwellings: 0.5% (0.5% fcs)
- Furniture: 2.9% (2.8% fcs)
- Carpets & floor coverings: 0.4% (0.3% fcs)
- Household textiles: 3.6% (2.2% fcs)
- Major household appliances: 1.7% (0.6% fcs)
- Small electrical appliances: 1.3% (0.8% fcs)
- Glassware, tableware & utensils: 0.5% (–1.2%)
- Tools & equipment: –0.1% (–0.1% fcs)
Taken at face value, the April Monthly CPI would suggest upside risk to our June quarter estimates for the CPI and the Trimmed Mean.
However, the quarterly CPI is not a simple average of the Monthly CPI Indicator. History has taught us that a simple ‘face value’ estimate can be misleading. In addition, several volatile items, for example food prices, can quickly revert more than we have in our current monthly profile.
We have entered all the monthly estimates and made estimates for May and June for those variables that are surveyed monthly to generate quarterly average estimates. We also enter the quarterly estimates from the monthly survey as they become available. This provides an updated bottom-up estimate for the June quarter CPI and Trimmed Mean. This update suggests an upside risk to our headline CPI estimate but a more modest upside risk to our Trimmed Mean estimate.
Bitcoin Holds Steady — Is a Fresh Rally Just Around The Corner?
Key Highlights
- Bitcoin started a major increase above the $105,000 resistance and traded to a new all-time high.
- BTC/USD is trading above a connecting bullish trend line with support at $108,000 on the 4-hour chart.
- Ethereum is showing positive signs above the $2,500 level.
- XRP price is consolidating and facing hurdles near $2.50.
Bitcoin Price Technical Analysis
Bitcoin price started a fresh increase above the $100,000 zone against the US Dollar. BTC was able to surpass the $105,000 and $108,000 resistance levels.
Looking at the 4-hour chart, the price settled above the $106,000 level, the 100 simple moving average (red, 4-hour), and the 200 simple moving average (green, 4-hour). A new all-time high was formed at $111,939 and the price is now correcting some gains.
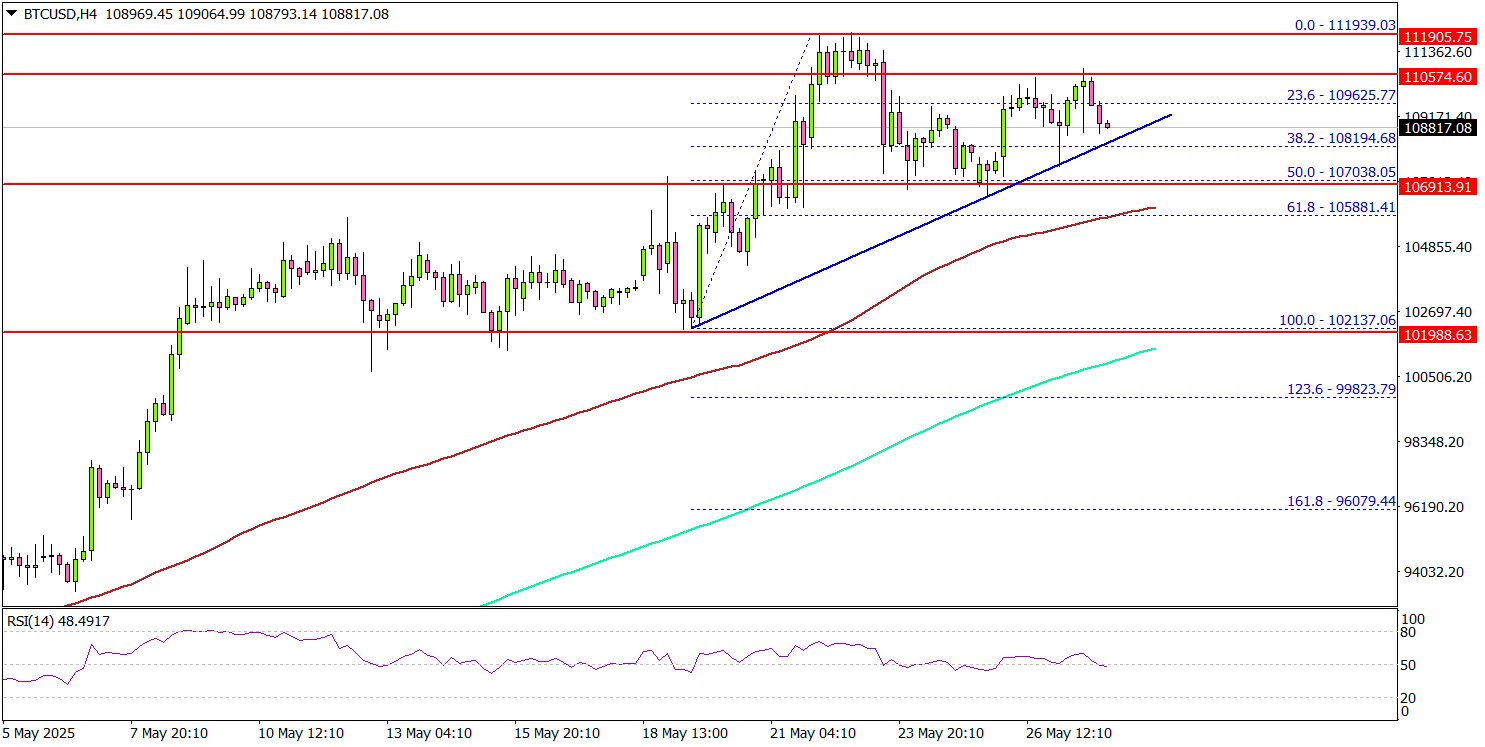
Recently, there was a minor decline below the $110,000 level. However, the bulls were active near the $107,000 zone. BTC is also trading above a connecting bullish trend line with support at $108,000 on the same chart.
Immediate support is near the $108,000 level. The next key support sits at $107,000 or the 50% Fib retracement level of the upward move from the $102,137 swing low to the $111,939 high.
A downside break below $107,000 might send Bitcoin toward the $105,000 support. Any more losses might send the price toward the $103,500 support zone.
On the upside, the price could face resistance near the $110,000 level. The next key resistance is $111,800. The main resistance could be $112,500. A successful close above $112,500 might start another steady increase.
In the stated case, the price may perhaps rise toward the $115,000 level. Any more gains might call for a test of $120,000.
Looking at Ethereum, the bulls seem to be in control, and they were able to push the price above the $2,650 resistance zone.
Today’s Economic Releases
- FOMC Minutes.
RBNZ cuts OCR to 3.25%, one member favors holding steady
RBNZ lowered the Official Cash Rate by 25 basis points to 3.25%, in line with market expectations. The decision was not unanimous, passed by a 5-1 vote.
The central bank emphasized that inflation is now within the target band and is "well placed" to respond to both domestic and international developments.
Meeting minutes revealed that some committee members favored holding the rate steady at 3.50%, citing a desire to monitor elevated global uncertainty and potential inflation risks stemming from recent tariff increases.
Maintaining the OCR, they argued, could have helped anchor inflation expectations more firmly around the 2% midpoint.
In its accompanying Monetary Policy Statement, RBNZ revised down its rate path projections slightly. The OCR is now expected to fall to 3.12% by September 2025 (previously 3.23%), and to 2.87% by June 2026 (previously 3.10%).