Sample Category Title
AUD/USD and NZD/USD Face Pressure, Dip Again
AUD/USD declined below the 0.6500 and 0.6460 support levels. NZD/USD is also moving lower and might extend losses below 0.5935.
Important Takeaways for AUD/USD and NZD/USD Analysis Today
- The Aussie Dollar started a fresh decline from well above the 0.6500 level against the US Dollar.
- There is a connecting bearish trend line forming with resistance at 0.6460 on the hourly chart of AUD/USD at FXOpen.
- NZD/USD declined steadily from the 0.6000 resistance zone.
- There is a major bearish trend line forming with resistance at 0.5960 on the hourly chart of NZD/USD at FXOpen.
AUD/USD Technical Analysis
On the hourly chart of AUD/USD at FXOpen, the pair struggled to clear the 0.6520 zone. The Aussie Dollar started a fresh decline below the 0.6500 support against the US Dollar.
The pair even settled below 0.6460 and the 50-hour simple moving average. There was a clear move below 0.6450. A low was formed at 0.6435 and the pair is now consolidating.
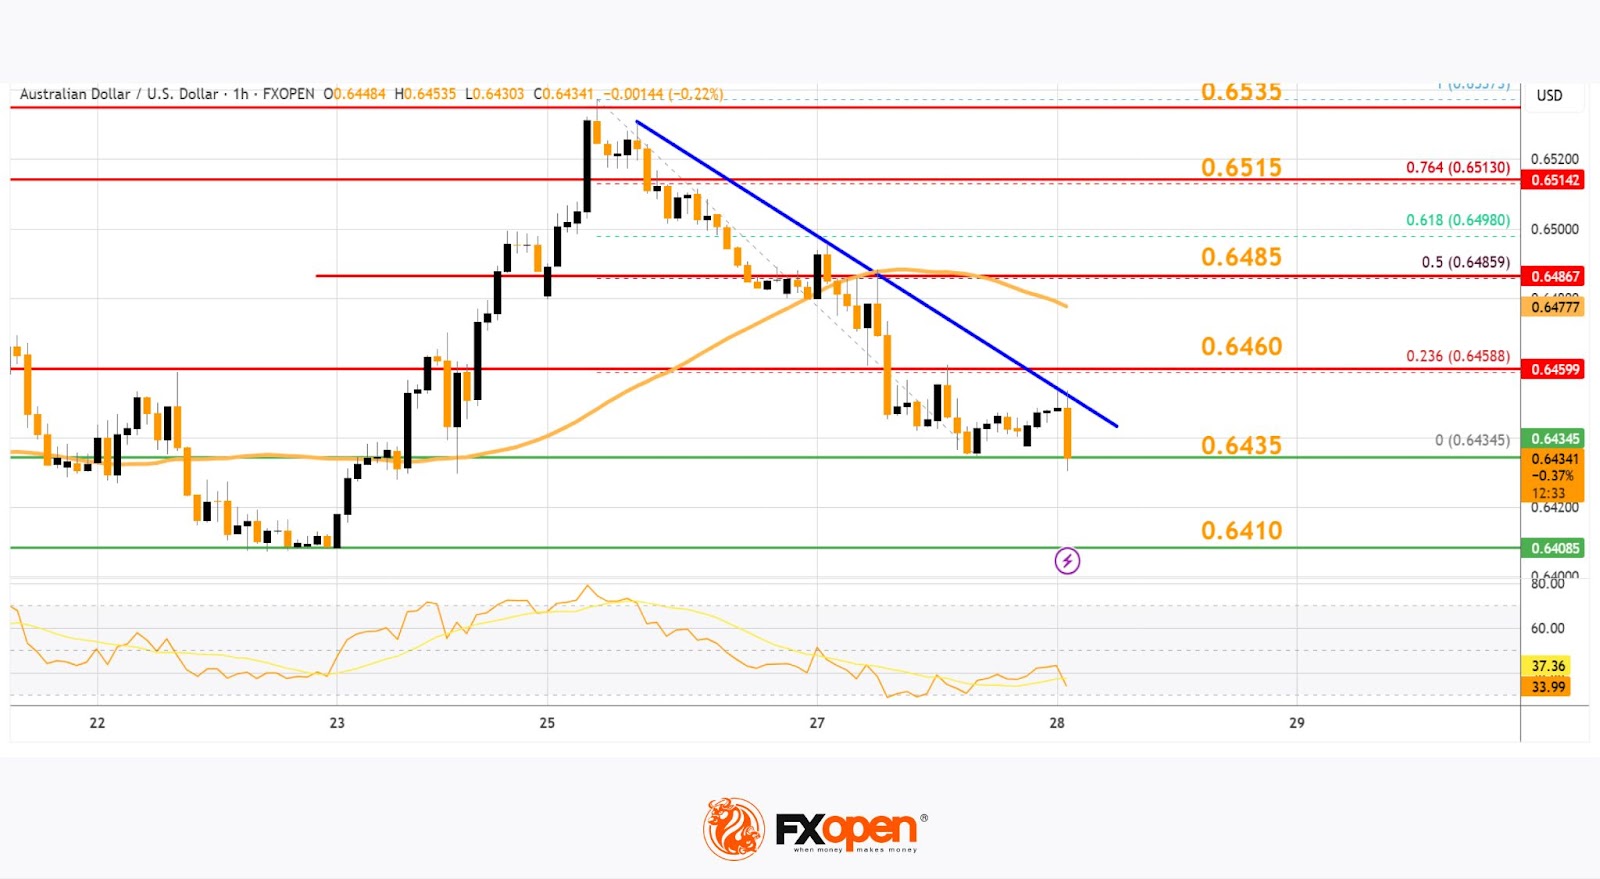
On the upside, an immediate resistance is near the 0.6460 level and the 23.6% Fib retracement level of the downward move from the 0.6537 swing high to the 0.6435 low.
The next major resistance is near the 0.6485 zone or the 50% Fib retracement level of the downward move from the 0.6537 swing high to the 0.6435 low, above which the price could rise toward 0.6515.
Any more gains might send the pair toward the 0.6535 resistance. A close above the 0.6535 level could trigger another steady increase in the near term. The next major resistance on the AUD/USD chart could be 0.6600.
On the downside, initial support is near the 0.6435 zone. The next support sits at 0.6410. If there is a downside break below 0.6410, the pair could extend its decline. The next support could be 0.6350. Any more losses might send the pair toward the 0.6320 support.
NZD/USD Technical Analysis
On the hourly chart of NZD/USD on FXOpen, the pair also followed a similar pattern and declined from the 0.6030 zone. The New Zealand Dollar gained bearish momentum against the US Dollar.
The pair settled below the 0.5960 level and the 50-hour simple moving average. Finally, it tested the 0.5930 zone and is currently consolidating.
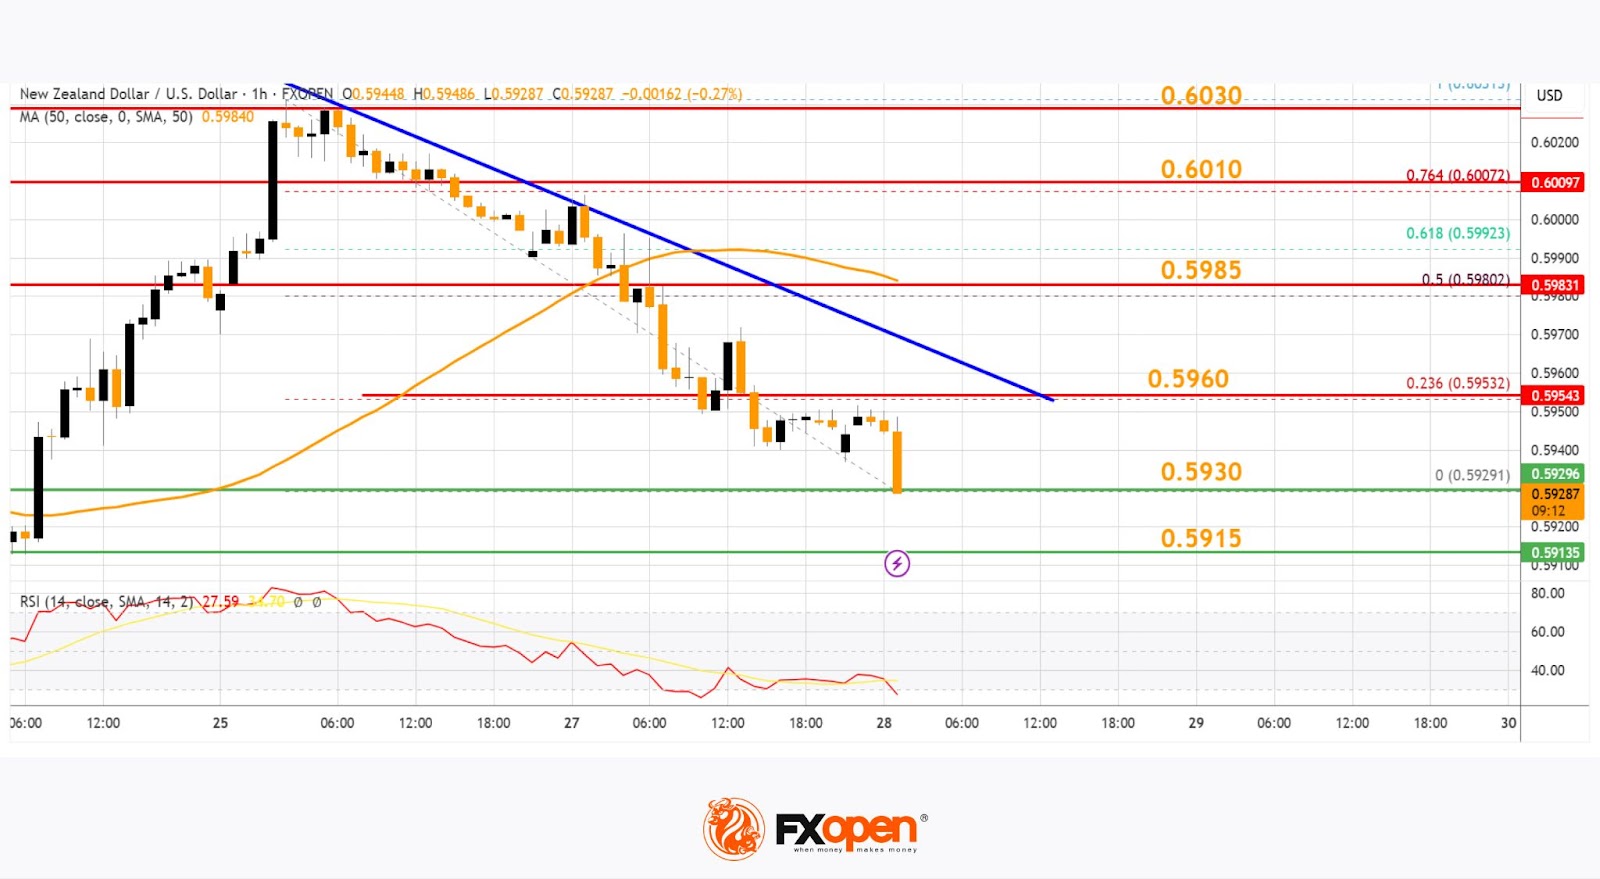
Immediate resistance on the upside is near the 23.6% Fib retracement level of the downward move from the 0.6031 swing high to the 0.5929 low at 0.5960. There is also a major bearish trend line forming with resistance at 0.5960.
The next resistance is the 0.5985 level or the 50% Fib retracement level of the downward move from the 0.6031 swing high to the 0.5929 low. If there is a move above 0.5985, the pair could rise toward 0.6030.
Any more gains might open the doors for a move toward the 0.6080 resistance zone in the coming days. On the downside, immediate support on the NZD/USD chart is near the 0.5930 level.
The next major support is near the 0.5910 zone. If there is a downside break below 0.5880, the pair could extend its decline toward the 0.5850 level. The next key support is near 0.5820.
Trade over 50 forex markets 24 hours a day with FXOpen. Take advantage of low commissions, deep liquidity, and spreads from 0.0 pips. Open your FXOpen account now or learn more about trading forex with FXOpen.
This article represents the opinion of the Companies operating under the FXOpen brand only. It is not to be construed as an offer, solicitation, or recommendation with respect to products and services provided by the Companies operating under the FXOpen brand, nor is it to be considered financial advice.
Correction Lower in Very Long Japanese Government Bond Yields Already Running into Trouble
Markets
US investors were in a good mood as they returned from the long Memorial Day weekend. US Treasury Secretary Bessent floated the prospect of some big (Asian) trade deals in coming weeks, while the original July 9 deadline is back in play for US-EU negotiations. An unexpectedly strong surge in May consumer confidence helped lifting spirits. The headline index rebounded from 85.7 to 98, the best level since February. Especially the expectations index (72.8 from 55.4) contributed to the leap higher. Consumers cited the temporary reduction in China tariffs, lower gas price and easing inflation while fewer of them now see a recession this year. Average inflation expectations 12 months ahead eased from 7% to 6.5%. US stock markets rallied 1.8% (Dow) to 2.5% (Nasdaq) into the close. Tonight’s Q1 Nvidia earnings have the potential to unlock the final part of a full retracement of this year’s losses back to YTD/all-time highs. The market relief helped some short term rebound action at the very long end of the curve. The US curve bull flattened with yields 1.1 bp (2-yr) to 8.6 bps (30-yr) lower on the day. There was similar outperformance at the very long end in Japan and the UK earlier on the day. The Japan’s ministry of finance sent a questionnaire to an unusual wide group of market participants and at an unusual time regarding the appropriate issuance amounts for government bonds. This is taken as a sign of the government seeking to stabilize the recent rout in Japanese bonds. In the UK, the debt management office indicated that it is shifting to shorter-term borrowing. In FX space, the dollar was granted some breathing room near YTD lows with the trade weighted greenback moving from 99 towards 100. EUR/USD copied the, technically insignificant, move from 1.14 to 1.13.
The correction lower in very long Japanese government bond yields is already running into trouble this morning after an auction of 40-yr government bonds met with weak demand. It highlight the fragility of any such moves with worries on public finances resulting in a sell-the-uptick pattern for now. Today’s eco calendar contains ECB inflation expectations (1y, 3y), the Richmond Fed manufacturing index and minutes of the previous FOMC meeting. We don’t expect them to move markets in a profound way. Later this week (Friday), US PCE deflators, Japanese (Tokyo) CPI) and German consumer prices are worth watching.
News & Views
Hungary’s central bank (MNB) kept the policy rate unchanged at 6.5% yesterday. It remains highly focused on inflation. Price rises in April slowed to 4.2% (headline) and 5% (core), depending on the gauge, but underlying dynamics are worrying. Government profit caps artificially suppressed food prices and market services’ monthly repricing was well above average. That points to higher inflation throughout the year. Risks surrounding the inflation outlook are substantial and therefore continue to warrant a careful and gradual approach to monetary policy. Hungarian swap yields rose a few basis points but that move was unrelated to the policy decision. The forint closed more or less unchanged around EUR/HUF 403.7.
The Reserve Bank of New Zealand went ahead with its easing cycle, lowering the key rate from 3.5% to 3.25%. Chief economist Conway said they now entered the neutral zone in a sign of the cycle nearing its end. The May policy report indicates one more rate cut with the chance of another. The decision was not a unanimous, with one member arguing for a hold with increased inflation expectations as one of the reasons. Inflation is projected to rise to 2.7% in 2025Q3 before returning near 2% from 2026. Previous rate cuts as well as elevated export prices should support the economy, even as increased global tariffs are expected to slow global economic growth. The economy should expand by 1.5% in the year through March 2026, compared to the 1.8% projected in February. The kiwi dollar didn’t hold on to kneejerk gains (NZD/USD 0.595). Swap yields do rise up to 11 bps at the front end of the curve.
Astonishingly Optimistic
Market mood is astonishingly great this week on the back of a global decline in yields, triggered by the Japanese government’s will to adjust the size of its bond issuance amid a selloff in long-maturity bonds sent 30- to 40-year JGB yields to all-time highs on growing concerns that the Japanese government won’t be able to cover its massive budget deficits. But the yields are higher again this morning, hinting that the volatility there continues.
Nevertheless, the rally in Japanese bonds helped pull the US 30-year yield below the 5% mark. And optimism from falling sovereign yields was compounded by better-than-expected US durable goods orders in April and a surprise rebound in consumer confidence in May. The Conference Board’s gauge posted the biggest monthly gain in four years and exceeded all estimates, helped in part by the temporary trade truce announced between the US and China. Inflation expectations also fell by the most since mid-2022, apparently on the back of lower gas prices.
But that confidence gauge doesn’t capture the latest 50% tariff threats on American imports of European products, the uncertain and unilaterally shifting deadlines, or warnings from companies like Walmart that price hikes from tariffs will impact a broad range of goods. It's also worth noting that on-and-off tariffs and negotiations disrupt global supply chains by creating tension at ports, which are already under pressure, especially in major European hubs dealing with labour shortages and shallow water levels on the Rhine.
So to me, the 2% rally in the S&P 500 seems exaggerated. Futures are slightly in the red today, while the US dollar, which rebounded yesterday from its lowest levels since April, looks better bid against majors. The EURUSD is testing the 1.13 mark at the time of writing, Cable has slipped below 1.35, and USDJPY is approaching the 145 mark. However, the fundamental reasons weighing on the US dollar — trade tensions and swelling debt concerns — remain intact, suggesting that the latest rebound is unlikely to mark a sustainable shift in sentiment.
Zooming into the eurozone, the flash CPI update from France confirmed easing price pressures in May — the figures were soft and below expectations. French inflation dropped to its lowest level in five years. Spanish, Italian, and German updates are due Friday and are expected to confirm further easing, after last month’s surprise uptick. In fact, the eurozone's largest economies are expected to post CPI figures below the ECB’s 2% target for the first time in eight months.
Softening inflation supports dovish European Central Bank (ECB) expectations and, in the context of rising government spending, should also back European growth prospects — and support the euro’s YTD rally. Support is seen near 1.1212 (the 23.6% Fibonacci retracement of the YTD rally), around the 50-DMA at 1.1180 (which acted as key support during the April–May retreat), and at 1.1025, the 38.2% retracement level that could mark the line between a continued rally and a medium-term bearish reversal.
Across the Channel, UK data showed food prices rising to their highest levels this year, mainly due to the government’s budget measures — a rise that’s expected and already factored into Bank of England (BoE) expectations. Still, there's a growing chorus of analysts and politicians accusing the BoE of falling behind the curve in policy easing, and warning of economic trouble ahead. But whatever the BoE expectations, the dollar’s trajectory matters more for Cable’s direction than British fundamentals at the moment.
Elsewhere, the Reserve Bank of New Zealand (RBNZ) lowered its interest rate by 25bp as expected and projected further cuts due to downside risks from the global trade war, which continues to weigh on New Zealand’s exports and broader domestic growth outlook. The Kiwi was little changed against the dollar. The AUDUSD, on the other hand, slipped below its 200-DMA on the back of a broad-based US dollar rebound. Worries over Chinese weakness will likely cap the Aussie’s upside potential.
Turning to China, equities remain under pressure. Disappointing results from PDD yesterday sent the stock down more than 13% on Nasdaq. Q1 revenue rose slightly, but profits nearly halved as the company recently lost its ‘de minimis’ privilege for small packages sent to the US — and other Western countries are now considering taxing low-value imports to counter the company’s ultra-competitive pricing, which is by far impossible to match in Western markets. CEO Li Chen said they should ‘invest decisively to support consumers and merchants, but that profitability will remain under pressure ‘for a considerable period of time.’ Zooming out, the Nasdaq Golden Dragon China Index spent a third session below both the 50- and 100-DMA. I still like Chinese tech stocks — and I like them better at cheaper prices.
In the US, it’s Nvidia earnings day! The company is expected to post $43.2bn in Q1 sales, with net income above $20bn. Its recent Middle East deals should boost revenue forecasts for next quarter and help offset the impact of US export restrictions to China. In that context, AMD was upgraded yesterday to 'hold' at HSBC, thanks to its AI deal with Saudi Arabia.
Anyway, strategists at BBVA think that strong earnings from Nvidia could fuel another leg of the US equity rally — noting that investors are still sitting on about $7 trillion in cash funds and options markets suggest that the stock price will move more than 7% on either direction depending on whether investors like what they see, or not.
Weak 40-Year JGB Auction
In focus today
The minutes from the FOMC's May meeting are due for release this evening. As the meeting was held before the US-China trade deal, the minutes are likely already somewhat outdated. Since the meeting, FOMC participants have broadly called for patience before resuming rate cuts, which we expect to continue only in September.
We will receive retail sales and trade balance data in Sweden today. Retail sales have been strong despite weak consumer confidence. Additionally, we will get the Financial Market Statistics from Statistics Sweden. The Riksbank is releasing their financial stability report, which includes their analysis and assessment of stability in the Swedish financial system.
Note that Danske Morning Mail will not be published tomorrow and Friday. Instead, we highlight that Thursday's focus will primarily be on US data, including the second estimate of GDP and PCE core for Q1. Friday will be more eventful kicking off with Swedish Q1 GDP figures, and May inflation data for Germany, Spain and Italy - potentially echoing the dovish French print we received yesterday. The week wraps up with US personal spending and the first release of PCE inflation - the Fed's preferred measure of inflation - for April, where consensus points to an easing of price pressures.
Economic and market news
What happened overnight
The Reserve Bank of New Zealand (RBNZ) cut its Official Cash Rate by 25bp to 3.25% as expected by both markets and consensus. The committee had considered both cutting and keeping rates unchanged but voted 5-1 in favour of cutting. RBNZ notes that there is still spare productive capacity in the domestic economy and that the tariffs and increased policy uncertainty will likely end up weighing on both growth and inflation pressures over the medium-term. The rate path was revised slightly lower, and it now implies a modest risk of RBNZ cutting rates below 3% next winter. NZD/USD was relatively little changed.
In Japan, demand at the auction of 40-year Japanese Government Bonds (JGB) fell to the lowest level since November, reflected in a 10bp rise in the 30y JGB yield this morning - following a sell-off in long-end bonds this month. The auction was seen as a bellwether of appetite from large institutional investors, who have yet to fill the gap left by the central bank's reduced purchases. JGBs were already in focus following a Reuters story yesterday that reported the Ministry of Finance (MoF) had circulated a survey to JGB market participants regarding issuance amounts - widely interpreted as a precursor to the MoF tweaking bond supply to avoid further strain in the JGB market. The ministry is reportedly set to decide following discussions with market participants in mid- to late June.
What happened yesterday
In the US, April durable goods orders were to the soft side at -6.3% m/m (prior: 7.6%), largely due to Boeing's large aircraft orders in March. Conversely, defence orders rebounded sharply. Excluding both the aircraft and defence categories, underlying capital goods orders declined 1.3% m/m (prior: 0.3%), which could be explained by tariff uncertainty/a reversal of the post-election optimism. Hence, the decline was not as significant as the headline suggests, also supported by the fact that the order level remains above the 2024 average.
While the Michigan survey pointed towards further deterioration, the Conference Board Consumer Confidence surprised to the upside, rebounding to 98 (cons: 97, prior: 86). Importantly, the cut-off dates for the measures differ - the Conference Board survey was conducted about a week later, on 19 May (Michigan Survey: 13 May) and reportedly, as many as half of the responses were collected after the US-China deal announcement on 12 May. Assessing the report, consumers' inflation expectations ticked lower, and respondents were less pessimistic about business conditions and job availability over the next six months. Generally, consumer sentiment remains very sensitive to trade war news, but underlying behaviour has evolved much more steadily.
In the euro area, French inflation data for May came in lower than expected, at 0.6% y/y (cons: 0.9%, prior: 0.9%). The main driver of the easing was a downtick in services inflation, which fell to 2.1% y/y (prior: 2.4%) - offering some comfort to the ECB. Energy prices also declined, contributing to the dovish surprise. In addition, the absence of price pressures in goods continued, implying that core inflation is on a downward trend. Notably, France is the first country to release inflation data ahead of next week's euro area figures - and this softer print supports the expectations for a lower aggregate measure.
In Sweden, the NIER survey barometer indicator was largely unchanged. After declining in recent months, the household confidence indicator showed a slight increase, though it is still at very low levels. The manufacturing confidence indicator was almost unchanged - and industrial companies reported limited or no-impact from any turmoil related to tariffs. Price plans were slightly better - especially when looking at the domestic plans. All in all, the release was relatively neutral, and we continue to believe the Riksbank will wait for more data and keep the policy rate unchanged in June.
In Hungary, the central bank maintained the policy rate at 6.50%, as widely expected.
In commodities space, OPEC+ is reportedly likely to agree on a further accelerated oil output hike for July. While the group meets today to review the market, a policy change is not expected. However, a decision on increasing output is anticipated when the eight OPEC+ members convene on Saturday. At the time of writing, Brent crude is trading around USD 64/bbl. We expect Brent to average USD 70/bbl in Q2 and recover to USD 85/bbl in Q4 - though we note there is room for prices to fall significantly further amid additional output hikes from OPEC+.
Equities: US markets rallied on Tuesday, as investors caught up after holidays on Monday. In one go, most of last week's losses and defensive rotation is thereby recouped. S&P 500 surged 2.1% in a big breadth; all sectors 1-3% higher and only 34 companies in red. This was a cyclical rally, which contrasted with the trading regime last week. What is more interesting is that the small cap and growth preference hung in there for a second day, fuelled by lower long-end yields of course. Retail investor favourites like Tesla and Nike surged, together with most-shorted and tariff-exposed names. The US rally is not trickling down to Asia or futures this morning, which suggest a slow opening today.
FI and FX: The USD rebounded together with equity markets yesterday as the worst trade war fears in the market calmed further. Consequently, EUR/USD fell back towards the 1.13 level. The global bond market also fared well yesterday with both US, German and Japanese yields declining. In Scandies, SEK struggled yesterday and lost out to most of G10 currencies. EUR/SEK rose back towards 10.90 and briefly spiked towards the 11:00 figure.
Review of RBNZ: Next Cut More Likely August Now Policy is Neutralish
- As widely expected and priced, today the RBNZ reduced the OCR by a further 25bps to 3.25%.
- The decision was reached following a 5 – 1 vote, with one MPC member voting for no change in policy.
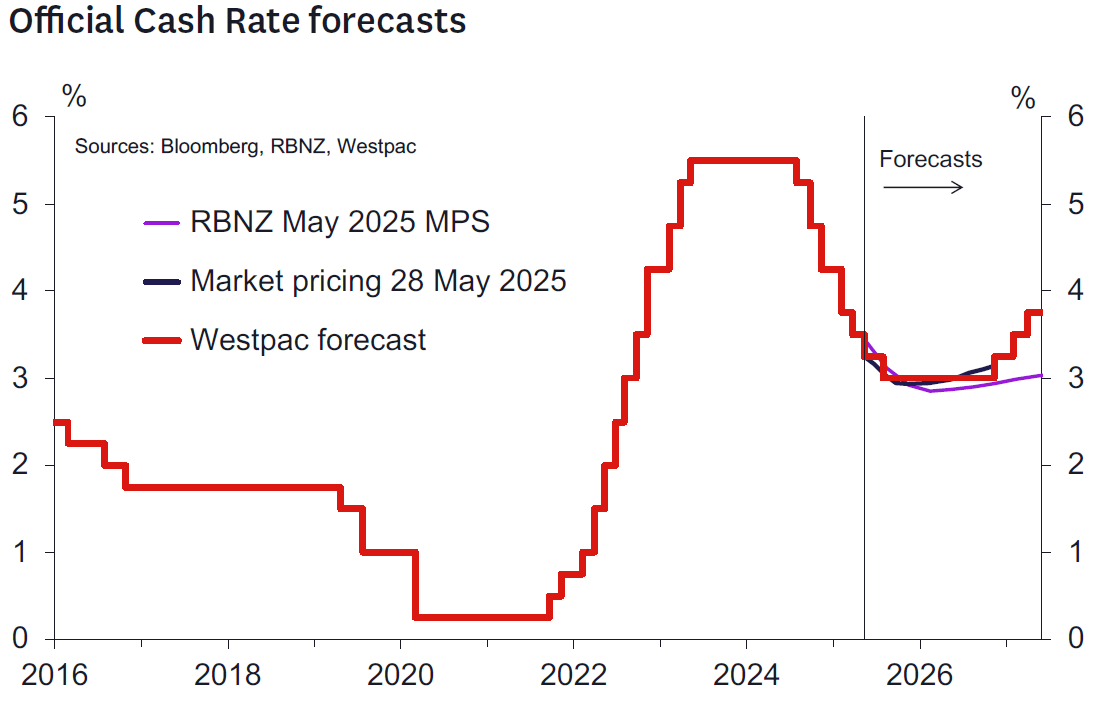
- The revised projection indicates a baseline expectation of 1-2 further OCR cuts by the end of this cycle, with 1 of those 2 cuts to occur in the September quarter.
- The RBNZ noted that is well placed to respond to both domestic and international developments to maintain price stability over the medium term.
- The Governor noted that the MPC has “no clear bias” for the July decision.
- Westpac now sees the next 25bp cut to 3% at the August MPS (previously July). But they could easily be done if the downside risks don’t crystalise.
Key messages from the RBNZ today.
As was widely expected and fully priced by the market, today the RBNZ announced a further 25bps reduction in the OCR to 3.25%. Given the unanimity of financial market opinion regarding this decision, the focus today was always going to be on the RBNZ’s revised projections and commentary and what this might imply regarding the outlook for policy at future meetings. In our opinion the following are the key take-outs:
- The RBNZ’s projection for the OCR now bottoms at 2.85% in the March 2026 quarter, compared to 3.1% in the February MPS.
- This was largely as expected and implies 1-2 further 25bp easings by cycle end.
- More surprisingly, the decision was reached by a 5-1 vote. One member voted for the OCR to remain unchanged, seeking to consolidate inflation expectations near the target midpoint and allowing more time to judge the impact of US policy uncertainty on household and business behaviour.
- During the press conference, Governor Hawkesby said that there was consensus regarding the medium-term OCR projection, but differences in view regarding the timing of how to get there.
- The RBNZ’s near-term OCR projection implies a further easing in the September quarter. In the press conference, Governor Hawkesby said the RBNZ would enter the next meeting with “no bias” regarding the outcome, which would depend on information over the intervening period.
- Mathematically, the RBNZ’s forecast of a 3.12% average OCR in the September quarter implies that this is more likely to occur at the August meeting, rather than the July meeting.
- CPI inflation is forecast to peak at 2.7%y/y in the September quarter, before declining to 1.9%y/y by early next year.
- The RBNZ’s near-term GDP growth forecasts are weaker than in February, although the unemployment rate is still expected to nudge higher to a peak of 5.2% before beginning to edge lower.
- The RBNZ notes that the risks surrounding the economic outlook are “heightened”, reflecting some uncertainty about whether the global trade shock will ultimately prove to be a net negative demand shock (thus disinflationary) or net negative supply shock (thus inflationary).
- To illustrate these risks, the RBNZ published two alternative scenarios. The downside demand scenario portrays a decline in the OCR to 2.55%. The supply shock scenario continues to forecast a decline in the OCR to 2.9%, but then a lift in the OCR to 3.5% later in the forecast period.
- Notably, these are both negative shock scenarios. The RBNZ did not explore scenarios where the impact of tariffs is less than in their central forecasts, though they acknowledge that this also a possibility.
- The RBNZ regards Budget 2025 as a wash for the economic outlook, with lower government spending (compared with the HYEFU) offset by an assumed lift in private capex in response to the “Investment Boost” policy.
Westpac’s view on policy outlook.
There was more division in the ranks of the MPC than expected. We expected increasing debate on the outlook for the OCR and the amount of weight to put on a higher near-term inflation profile, versus a lower medium-term profile as excess capacity and the weaker global outlook drag inflation down to the middle of the 1-3% target range. A vote on the merits of today’s 25bp cut hence signals more debate than that and suggests a raised bar for OCR cuts at each meeting going forward.
The RBNZ has reduced its near-term growth forecasts quite noticeably. The profile implies a pause in the recovery in place in recent quarters with quarterly growth expected in the range of 0.2-0.4% a quarter over Q1-Q3 2025. Our expectations are stronger - in the range of 0.4- 0.7% in the same period. The noticeably weaker trading partner growth profile is consistent with this mark down. That this weaker short term growth profile only argues for one more cut in Q3 seems telling.
The focus of the MPC on inflation expectations is noticeable and appropriate. Evidence these are falling back will likely be important in making the MPC hawks more comfortable with getting back on the easing track. The Q2 CPI on 18 July may well be pivotal in that regard.
We think this is an MPC that wants to slow down. Governor Hawkesby noted the MPC has no bias regarding the outcome of the next meeting. We previously expected the final cut to 3% to occur in July, although we were agnostic on whether this might also end up occurring in August. August looks a better bet now – hence we are moving our call.
There’s plenty of water to go under the bridge both domestically and internationally. We suspect that it will be easier to make the case for another easing in August than July given the pending negotiation dates set by the US authorities on trade agreements. The Q2 CPI will also be quite important. But equally uncertainty is high and a range of events both positive and negative could occur. So, we will watch the data like the RBNZ.
It’s too early to call time on the easing cycle. But you never know its ended when it ends. Policy is well placed to respond to whatever happens now the OCR is in the middle of the long- and short-term estimates of the neutral OCR (these range between 2.9 and 3.6%). Policy is “neutralish”.
If nothing overtly negative happens to the economy or medium-term inflation outlook between now and August, then there could be no change in the OCR in August also. Let’s see.
Summary of RBNZ’s economic view.
The RBNZ has revised down its near-term forecasts for economic growth, which are softer than our own. Part of that reason for that downward revision was the updates to forecasts for government spending in Budget 2025.
More notable are the updates to the cyclical components of GDP, with softer outlooks for investment spending and export growth. A key reason for this is the weaker outlook for global growth as a result of increased trade protectionism. The RBNZ has revised down its forecasts for global GDP growth in 2025 by 0.5ppts (year total basis). The related reductions in demand and increases in economic uncertainty are expected to be a drag on investment appetites.
Looking to next year, we see a risk that the strength of the New Zealand consumer surprises the RBNZ on the upside. Despite assumed low interest rates and increasing employment, the RBNZ’s forecast for household spending growth is weak over 2026.
On the inflation front, the RBNZ’s overall forecasts are broadly similar to our own. However, we think that the details of the inflation outlook will surprise the RBNZ. In particular, we don’t expect domestic inflation pressures will be as weak as the RBNZ is expecting over the medium term. The RBNZ expects non-tradables inflation will fall as low as 2.8% next year. In contrast, we think that ongoing and sizeable increases in government charges and other administered costs will see non-tradables inflation tracking close to 3.5%. On the other side of the equation, we don’t expect the same lift in imported inflation that the RBNZ has assumed. However, it’s those domestic inflation pressures, which have consistently surprised the RBNZ on the upside in recent years, that will be the bigger concern.
Key data and events before the RBNZ’s 9 July meeting.
Looking ahead to the RBNZ’s next policy review on 9 July, the key domestic data and events will be:
- The May Selected Price Indexes (17 June): This will provide the last indication of the likely outcome of the Q2 CPI report, which will not be released until 21 July.
- The Q1 GDP report (20 June): The outcome of this report will be compared to the RBNZ’s estimate, with any deviation having implications for the RBNZ’s estimate of the output gap and perhaps also its view on near-term growth momentum.
- The Q1 QSBO survey (1 July): The focus in this report will be on indicators of Q2 activity and cost/inflation pressures. The survey will reveal how confidence, hiring and investment indicators are looking in light of uncertainty about the global outlook and in reaction to policy changes contained in Budget 2025.
In addition to the above, key monthly activity indicators such as the Business NZ manufacturing and services indexes (mid-June) and the ANZ Business Outlook survey (late June) will also be of interest, as will developments in retail spending and in the housing market. Developments in the labour market will likely be tracked especially closely. A lift in filled jobs and job advertising would provide some reassurance to the RBNZ that the recovery is strengthening and becoming self-sustaining. Meanwhile, the inflation expectations measures from the ANZ’s consumer and business surveys will also be of some importance, to see whether their recent lift has endured.
Outside of New Zealand, interest will clearly centre on any clarity that emerges regarding the final form of US tariff policy and its implications for New Zealand’s export sector and inflation. The RBNZ’s policy decision will be announced on the same day (in US time) that the pause on President Trump’s ‘reciprocal’ tariffs is due to expire (ex-China). However, recent comments from Trump suggest that final decisions are likely to be taken sooner, at least regarding tariffs on some countries. Both the Fed and RBA will conduct policy reviews in the lead-up to the RBNZ’s meeting (the RBA just the day before the RBNZ’s decision is announced).
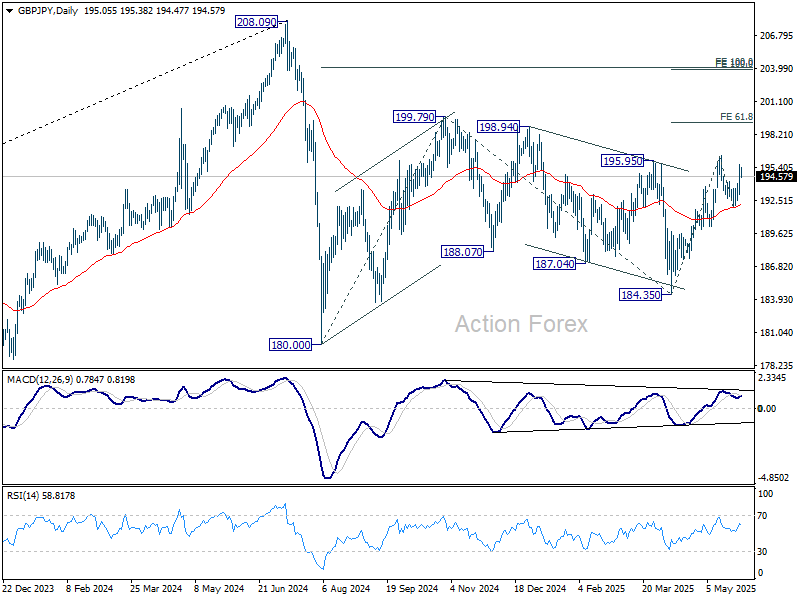
GBP/JPY Daily Outlook
Daily Pivots: (S1) 193.48; (P) 194.56; (R1) 196.05; More...
Intraday bias in GBP/JPY remains on the upside for 196.38 resistance. Firm break there will resume whole rally from 184.35 and target 61.8% projection of 184.35 to 196.38 from 191.86 at 199.29 next. For now, near term outlook will stay bullish as long as 191.86 support holds, in case of retreat.
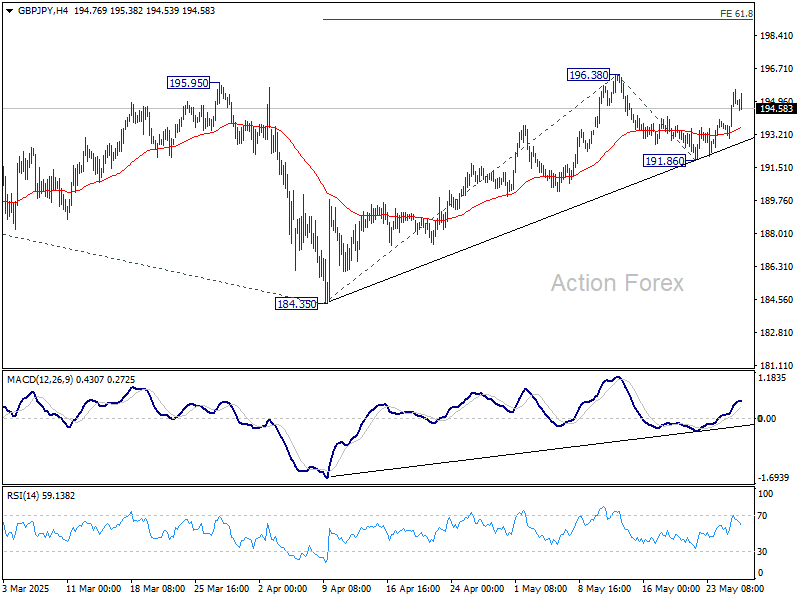
In the bigger picture, price actions from 208.09 are seen as a correction to rally from 123.94 (2020 low). Strong support should be seen from 38.2% retracement of 123.94 to 208.09 at 175.94 to contain downside. However, sustained break of 175.94 will bring deeper fall even still as a correction.
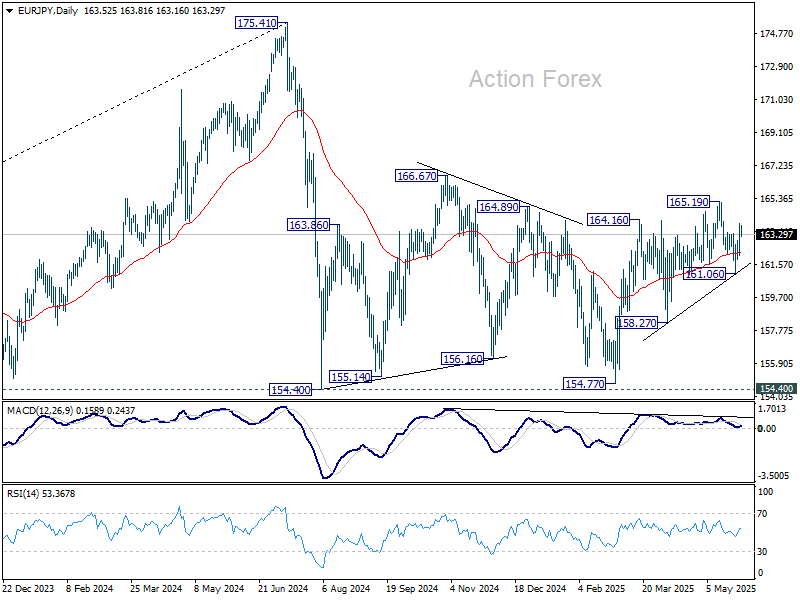
EUR/JPY Daily Outlook
Daily Pivots: (S1) 162.42; (P) 163.19; (R1) 164.28; More...
EUR/JPY's break of 163.35 resistance suggests that fall from 165.19 has completed as a correction. Intraday bias is back on the upside for 165.19 first. Firm break there will resume while rise from 154.77 to 166.67 resistance.
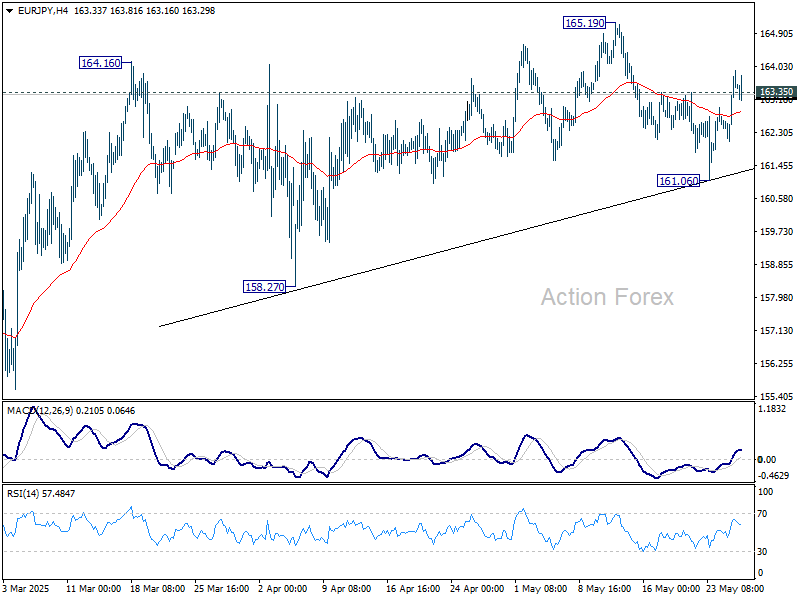
In the bigger picture, price actions from 175.41 are seen as correction to rally from 114.42 (2020 low). Strong support should be seen from 38.2% retracement of 114.42 to 175.41 at 152.11 to contain downside. However, sustained break of 152.11 will bring deeper fall even still as a correction.
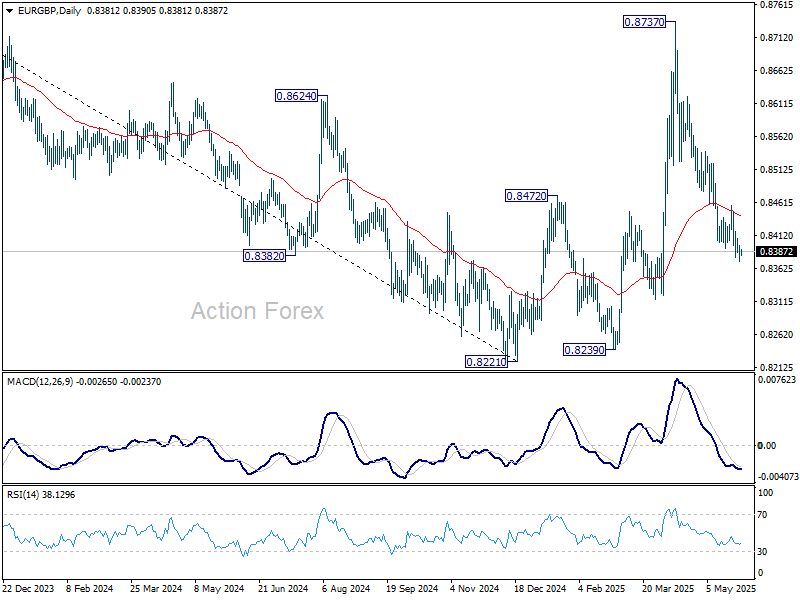
EUR/GBP Daily Outlook
Daily Pivots: (S1) 0.8373; (P) 0.8386; (R1) 0.8399; More...
Intraday bias in EUR/GBP stays on the downside for the moment. Decline from 0.8737 is in progress and should should target 0.8314 support first, and then 0.8239 low. On the upside, above 0.8458 resistance should indicate short term bottoming, likely with bullish convergence condition in 4H MACD, and turn bias back to the upside for stronger rebound.
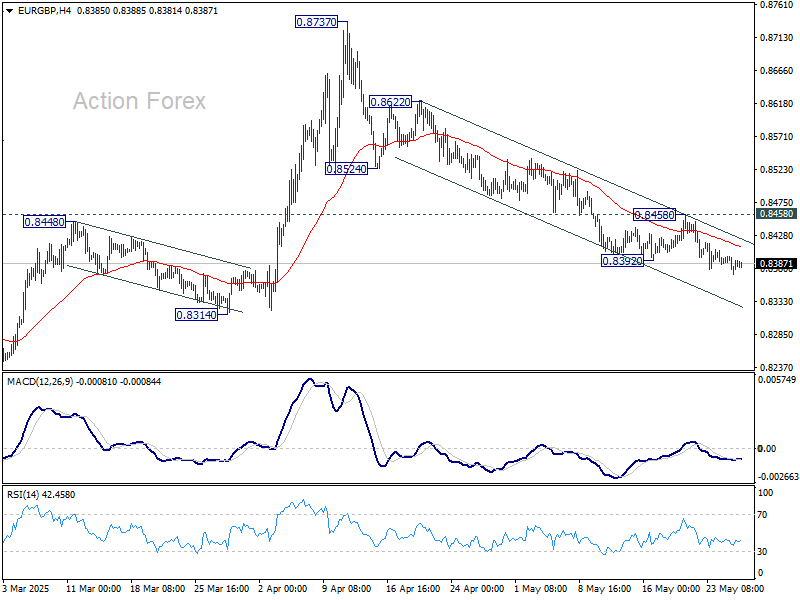
In the bigger picture, current development suggests that price actions from 0.8221 medium term bottom are merely forming a corrective pattern. However, there is no clear momentum to break through 0.8201 key support (2022 low) yet. Hence, range trading is expected between 0.8221/8737 for now.
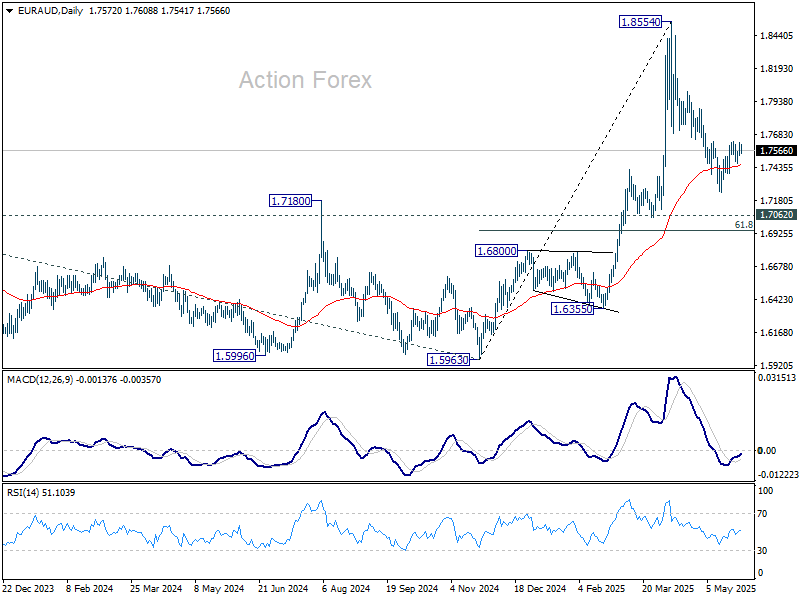
EUR/AUD Daily Outlook
Daily Pivots: (S1) 1.7529; (P) 1.7578; (R1) 1.7634; More...
No change in EUR/AUD's outlook and intraday bias remains neutral. On the upside, firm break of 1.7628 resistance will suggest that fall from 1.8554 as completed as a correction, and retain larger bullishness. Intraday bias will be back on the upside for stronger rebound. However, below 1.7245 will resume the fall to 61.8% retracement of 1.5963 to 1.8554 at 1.6953.
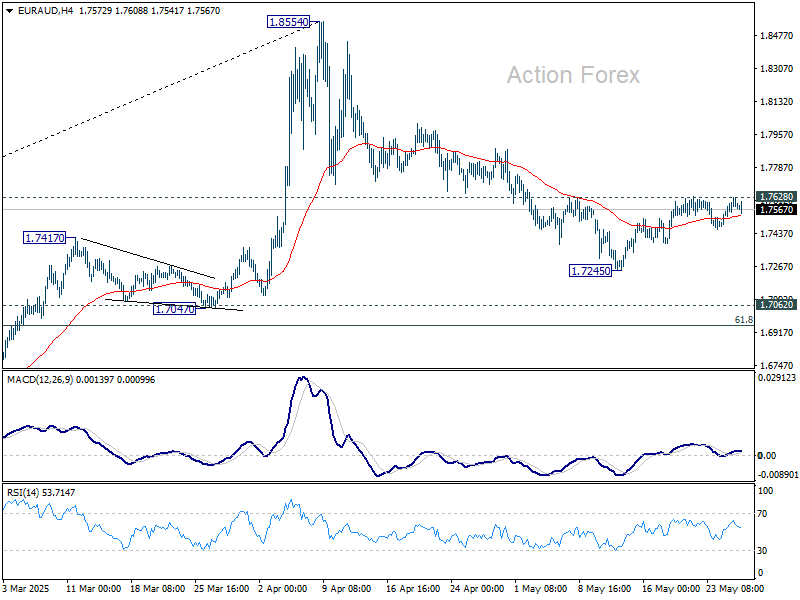
In the bigger picture, as long as 1.7062 resistance turned support (2023 high) holds, up trend from 1.4281 (2022 low) should still be in progress. Break of 1.8554 will target 100% projection of 1.4281 to 1.7062 from 1.5963 at 1.8744. However, sustained break of 1.7062 will confirm medium term topping and bring deeper fall back to 1.5963 support.
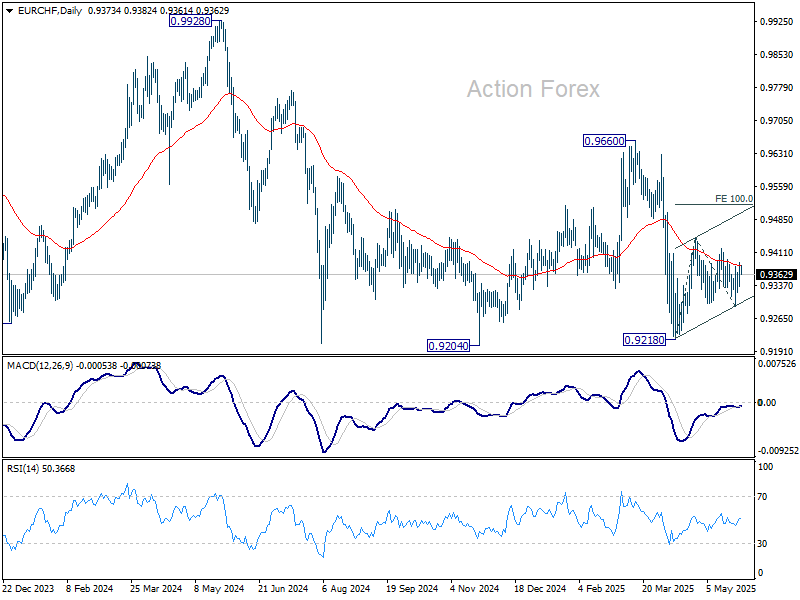
EUR/CHF Daily Outlook
Daily Pivots: (S1) 0.9344; (P) 0.9367; (R1) 0.9398; More....
Intraday bias in EUR/CHF stays neutral as sideway trading continues. Price actions from 0.9218 are seen as either a corrective move or the third leg of the pattern from 0.9204. On the upside, break of 0.9419 will resume the rise from 0.9218 through 0.9445 resistance. However, firm break of 0.9291 support will bring retest of 0.9218 low.
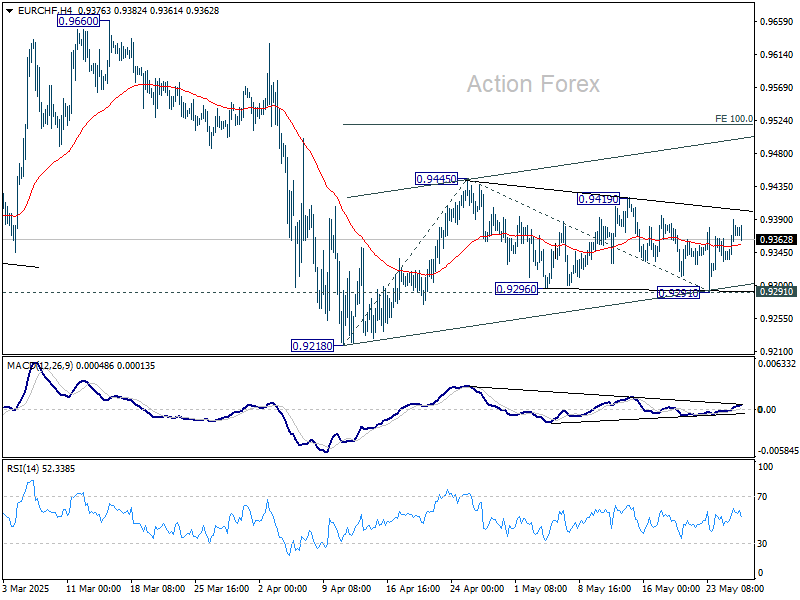
In the bigger picture, prior rejection by long-term falling channel resistance (now at 0.9548) retains medium term bearishness. That is, down trend from 1.2004 (2018 high) is still in progress. Firm break of 0.9204 (2024 low) will confirm resumption. This will remain the favored case as long as 0.9660 resistance holds.