
Sample Category Title
USD/JPY Mid-Day Outlook
Daily Pivots: (S1) 142.83; (P) 143.64; (R1) 145.17; More...
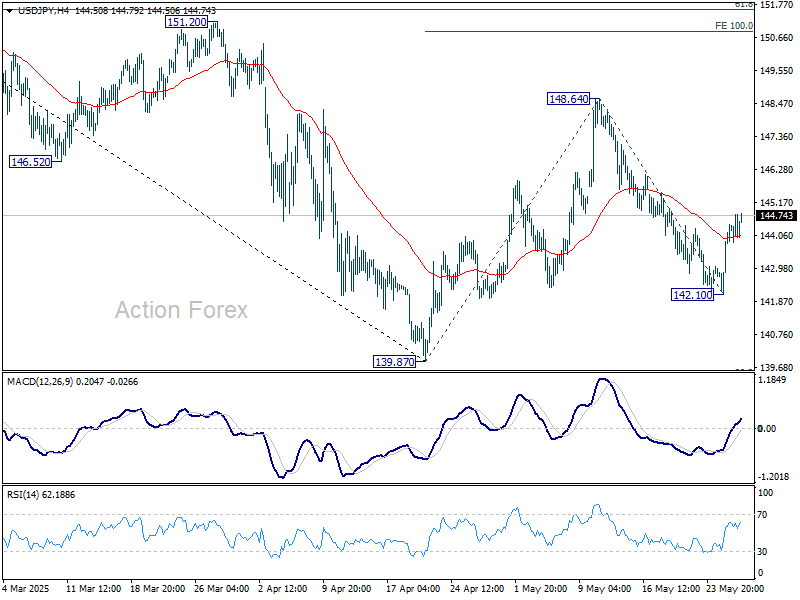
Intraday bias in USD/JPY stays mildly on the upside at this point. Fall from 148.64 might have completed as a correction at 142.10. Sustained break of 55 D EMA (now at 145.83) will affirm this case and target 148.64 resistance and above. Nevertheless, break of 142.10 will turn bias back to the downside for 139.87 low instead.
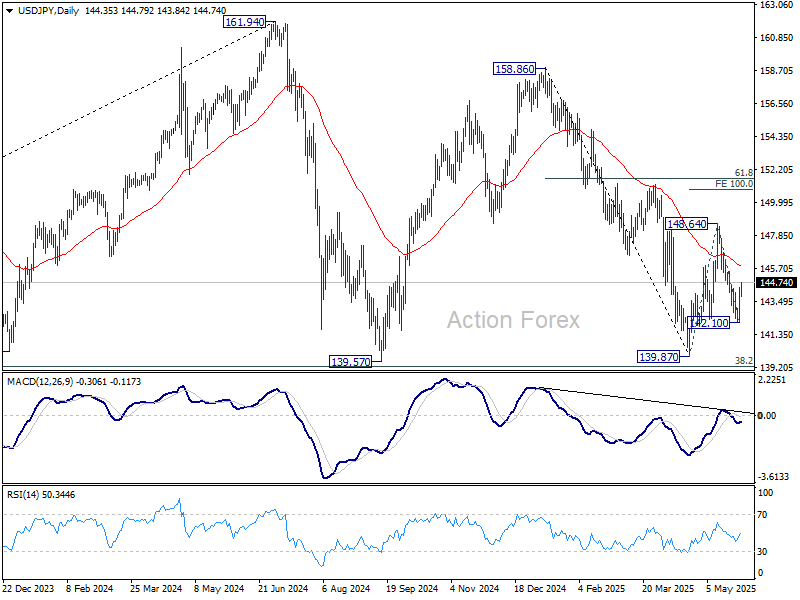
In the bigger picture, price actions from 161.94 are seen as a corrective pattern to rise from 102.58 (2021 low), with fall from 158.86 as the third leg. Strong support should be seen from 38.2% retracement of 102.58 to 161.94 at 139.26 to bring rebound. However, sustained break of 139.26 would open up deeper medium term decline to 61.8% retracement at 125.25.
USD/CHF Mid-Day Outlook
Daily Pivots: (S1) 0.8214; (P) 0.8247; (R1) 0.8306; More….
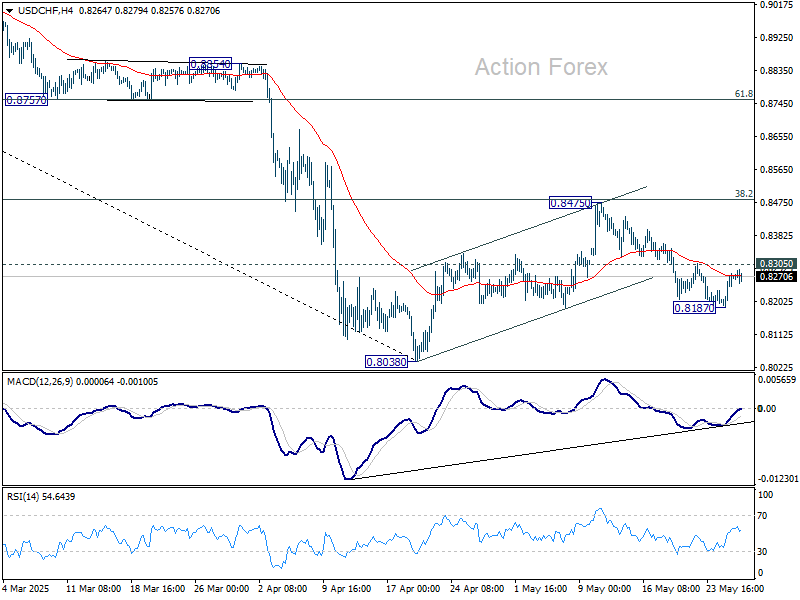
Range trading continues in USD/CHF and intraday bias stays neutral. Another fall is in favor as long as 0.8305 minor resistance holds. Below 0.8187 will target a retest on 0.8038 low first. Firm break there will resume larger down trend. Nevertheless, sustained break of 0.8305 will argue that pullback from 0.8475 has completed, and turn bias back to the upside to extend the pattern from 0.8038 with another rising leg.
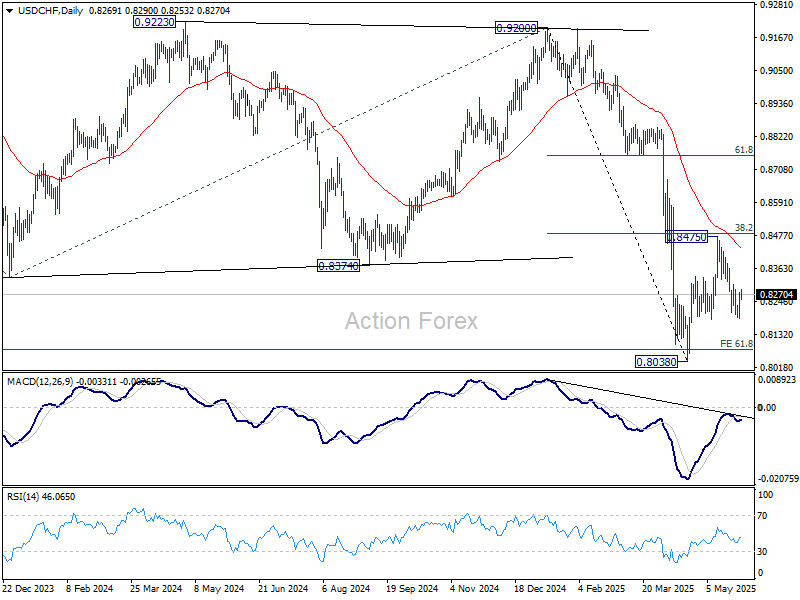
In the bigger picture, long term down trend from 1.0342 (2017 high) is still in progress and met 61.8% projection of 1.0146 (2022 high) to 0.8332 from 0.9200 at 0.8079 already. In any case, outlook will stay bearish as long as 55 W EMA (now at 0.8713) holds. Sustained break of 0.8079 will target 100% projection at 0.7382.
Dollar Recovery Slows Ahead of FOMC Minutes as Market Seeks Clarity
Dollar’s near-term rebound is still intact as markets head into US session. But appears to be fading as traders await fresh catalysts. While the greenback has benefited from stabilizing sentiment, there’s a lack of conviction behind the move, particularly with no data releases of note today. Markets are now turning their attention to the upcoming FOMC minutes, though expectations for a clear policy signal remain low.
The minutes from the May 6–7 FOMC meeting are expected to show a divided Fed grappling with increased volatility and an unpredictable policy backdrop, largely stemming from trade tensions. A key point of debate within the Fed may have been how to respond if elevated tariffs return and remain in place. While some officials may view tariff-driven inflation as transitory and argue for policy support to counteract the drag on growth, others may be more concerned about a shift in inflation expectations and the risk of persistent price pressures. Despite those differences, there is likely consensus around two core ideas: that tariffs are inherently stagflationary, and that it's too early to commit to rate adjustments amid current uncertainty.
As a result, today’s release is unlikely to shift the market narrative in a meaningful way. Trading may remain subdued unless there’s an unexpected shift in tone or language around inflation risks or rate sensitivity. With Fed still firmly in a no-hurry, data-dependent mode, the market may continue to drift until the next major inflation print or employment report.
Looking across the broader currency markets, Dollar remains the week's strongest performer so far. Kiwi follows as second, receiving a boost after RBNZ delivered a 25bps rate cut with a surprising dissent. Euro also finds modest support, ranking third on the performance board. In contrast, Yen remains the weakest major, weighed down by falling super-long JGB yields. Aussie and Swiss Franc also trail, while Sterling and Loonie remain in the middle.
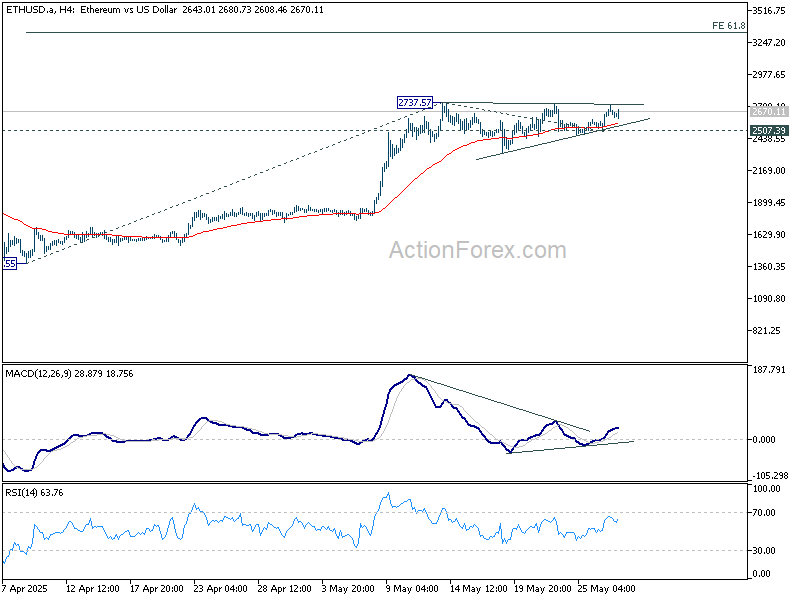
Technically, Ethereum might be ready to complete the near-term triangle consolidation pattern from 2737.57. Firm break of this resistance will resume the rally from 1382.55. Next target is 61.8% projection of 1382.55 to 2737.57 from 2507.39 at 3344.79. However, break of 2507.39 support will extend the corrective pattern with another falling leg instead.
In Europe, at the time of writing, FTSE is down -0.06%. DAX is down -0.45%. CAC is down -0.13%. UK 10-year yield is up 0.012 at 4.683. Germany 10-year yield is down -0.001 at 2.541. Earlier in Asia, Nikkei closed flat. Hong Kong HSI fell -0.53%. China Shanghai SSE fell -0.02%. Singapore Strait Times rose 0.41%. Japan 10-year JGB yield rose 0.052 to 1.518.
ECB survey shows short-term inflation expectations climb as growth outlook worsens
ECB’s latest Consumer Expectations Survey for April showed a modest but notable uptick in short-term inflation expectations.
Median expectations for inflation over the next 12 months rose to 3.1%, the highest since February 2024. However, medium- and long-term inflation expectations remained steady, with the three-year outlook unchanged at 2.5% and the five-year projection holding at 2.1% for the fifth straight month.
Alongside the rise in short-term inflation forecasts, the survey revealed an increase in uncertainty about inflation over the coming year, matching levels last seen in June 2024.
More concerning, however, is the deepening pessimism around growth and employment. Expectations for economic growth over the next 12 months dropped sharply to -1.9% from -1.2% in March. Expected unemployment ticked up slightly from 10.4% to 10.5%.
RBNZ cuts OCR to 3.25%, one member favors holding steady
RBNZ lowered the Official Cash Rate by 25 basis points to 3.25%, in line with market expectations. The decision was not unanimous, passed by a 5-1 vote.
The central bank emphasized that inflation is now within the target band and is "well placed" to respond to both domestic and international developments.
Meeting minutes revealed that some committee members favored holding the rate steady at 3.50%, citing a desire to monitor elevated global uncertainty and potential inflation risks stemming from recent tariff increases.
Maintaining the OCR, they argued, could have helped anchor inflation expectations more firmly around the 2% midpoint.
In its accompanying Monetary Policy Statement, RBNZ revised down its rate path projections slightly. The OCR is now expected to fall to 3.12% by September 2025 (previously 3.23%), and to 2.87% by June 2026 (previously 3.10%).
Australia’s monthly CPI unchanged 2.4%, core inflation edges higher
Australia’s monthly CPI held steady at 2.4% yoy in April, slightly above expectations of 2.3% yoy, marking the third consecutive month of unchanged headline inflation.
However, underlying inflation measures moved higher, with CPI excluding volatile items and holiday travel rising to 2.8% yoy from 2.6% yoy. Trimmed mean CPI also tickd up from 2.7% yoy to 2.8% yoy.
These developments suggest that while headline inflation appears stable, price pressures beneath the surface remain persistent.
Key contributors to the annual inflation rate included food and non-alcoholic beverages (+3.1%), recreation and culture (+3.6%), and housing (+2.2%).
BoJ's Ueda highlights focus on short- and medium-term rates
BoJ Governor Kazuo Ueda told parliament today that shifts in short- and medium-term interest rates have a more pronounced impact on economic activity than movements in super-long yields.
He explained that corporate and household debt is more concentrated in those shorter maturities, making the economy more sensitive to changes in that segment of the yield curve.
However, Ueda also acknowledged the spillover effects of volatility in super-long bond yields, noting that sharp moves in that part of the curve can ripple through to shorter maturities and influence overall financial conditions.
"We'll carefully watch market developments and their impact on the economy, he emphasized.
USD/CHF Mid-Day Outlook
Daily Pivots: (S1) 0.8214; (P) 0.8247; (R1) 0.8306; More….
Range trading continues in USD/CHF and intraday bias stays neutral. Another fall is in favor as long as 0.8305 minor resistance holds. Below 0.8187 will target a retest on 0.8038 low first. Firm break there will resume larger down trend. Nevertheless, sustained break of 0.8305 will argue that pullback from 0.8475 has completed, and turn bias back to the upside to extend the pattern from 0.8038 with another rising leg.
In the bigger picture, long term down trend from 1.0342 (2017 high) is still in progress and met 61.8% projection of 1.0146 (2022 high) to 0.8332 from 0.9200 at 0.8079 already. In any case, outlook will stay bearish as long as 55 W EMA (now at 0.8713) holds. Sustained break of 0.8079 will target 100% projection at 0.7382.
New Zealand Cut the Rate, But Not the Kiwi
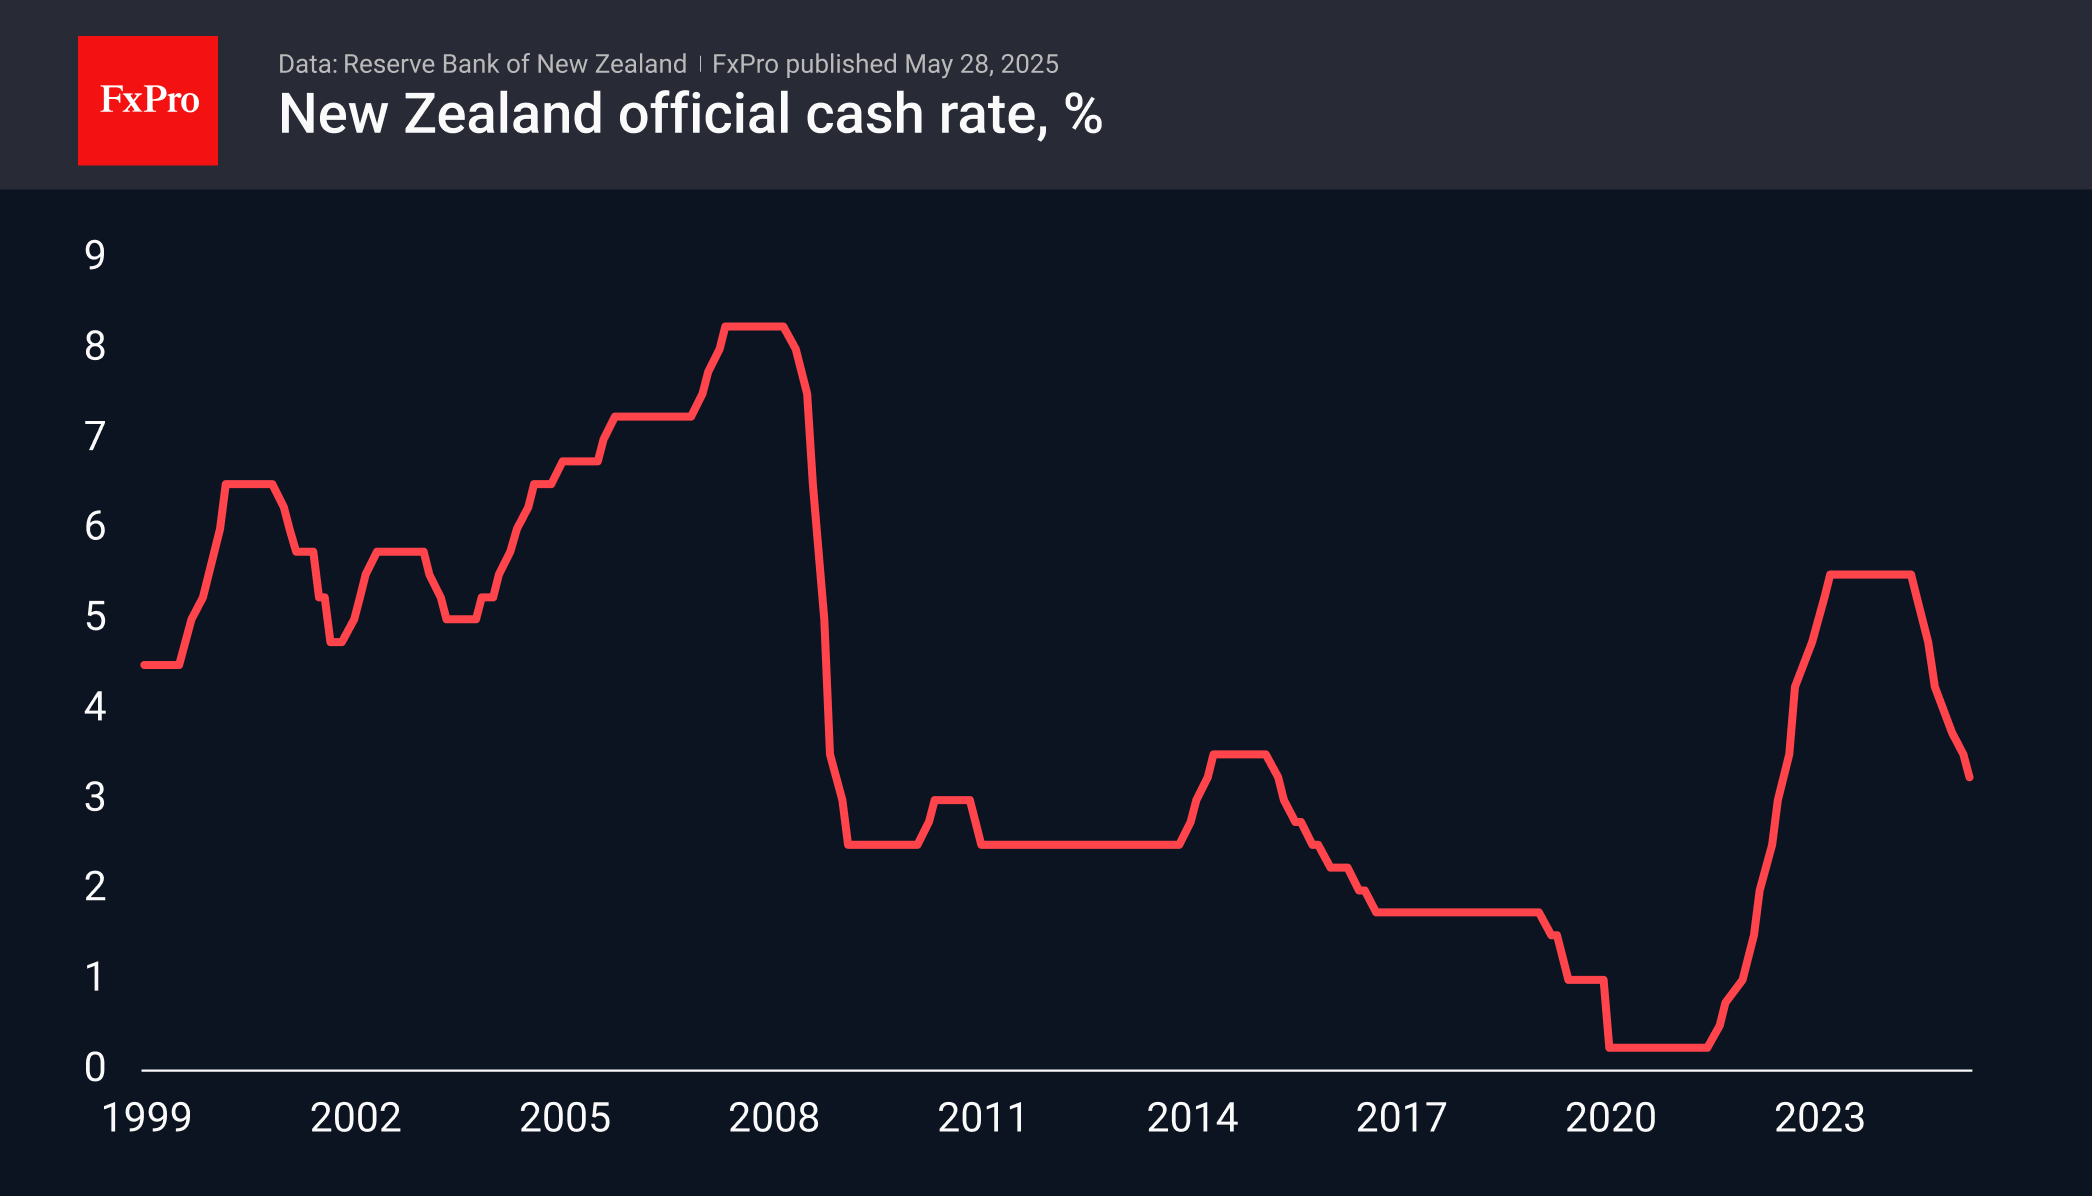
As expected, the Reserve Bank of New Zealand cut its key rate by 25 basis points to 3.25%. This cycle was the sixth easing since August last year, totalling 125 b. p.
In an accompanying statement, the central bank said inflation accelerated to 2.5% y/y and inflation expectations among companies and households have risen. On the other hand, the decline in core inflation gives confidence that inflation will return to the middle of the 1-3 per cent target range in the medium term. Separately, the RBNZ noted the beginning of the economic recovery from the contractionary period.
From higher actual and expected inflation to GDP growth, this is all bullish news supporting the New Zealand dollar against the US dollar despite the widening spread between the key rate in New Zealand and the US.
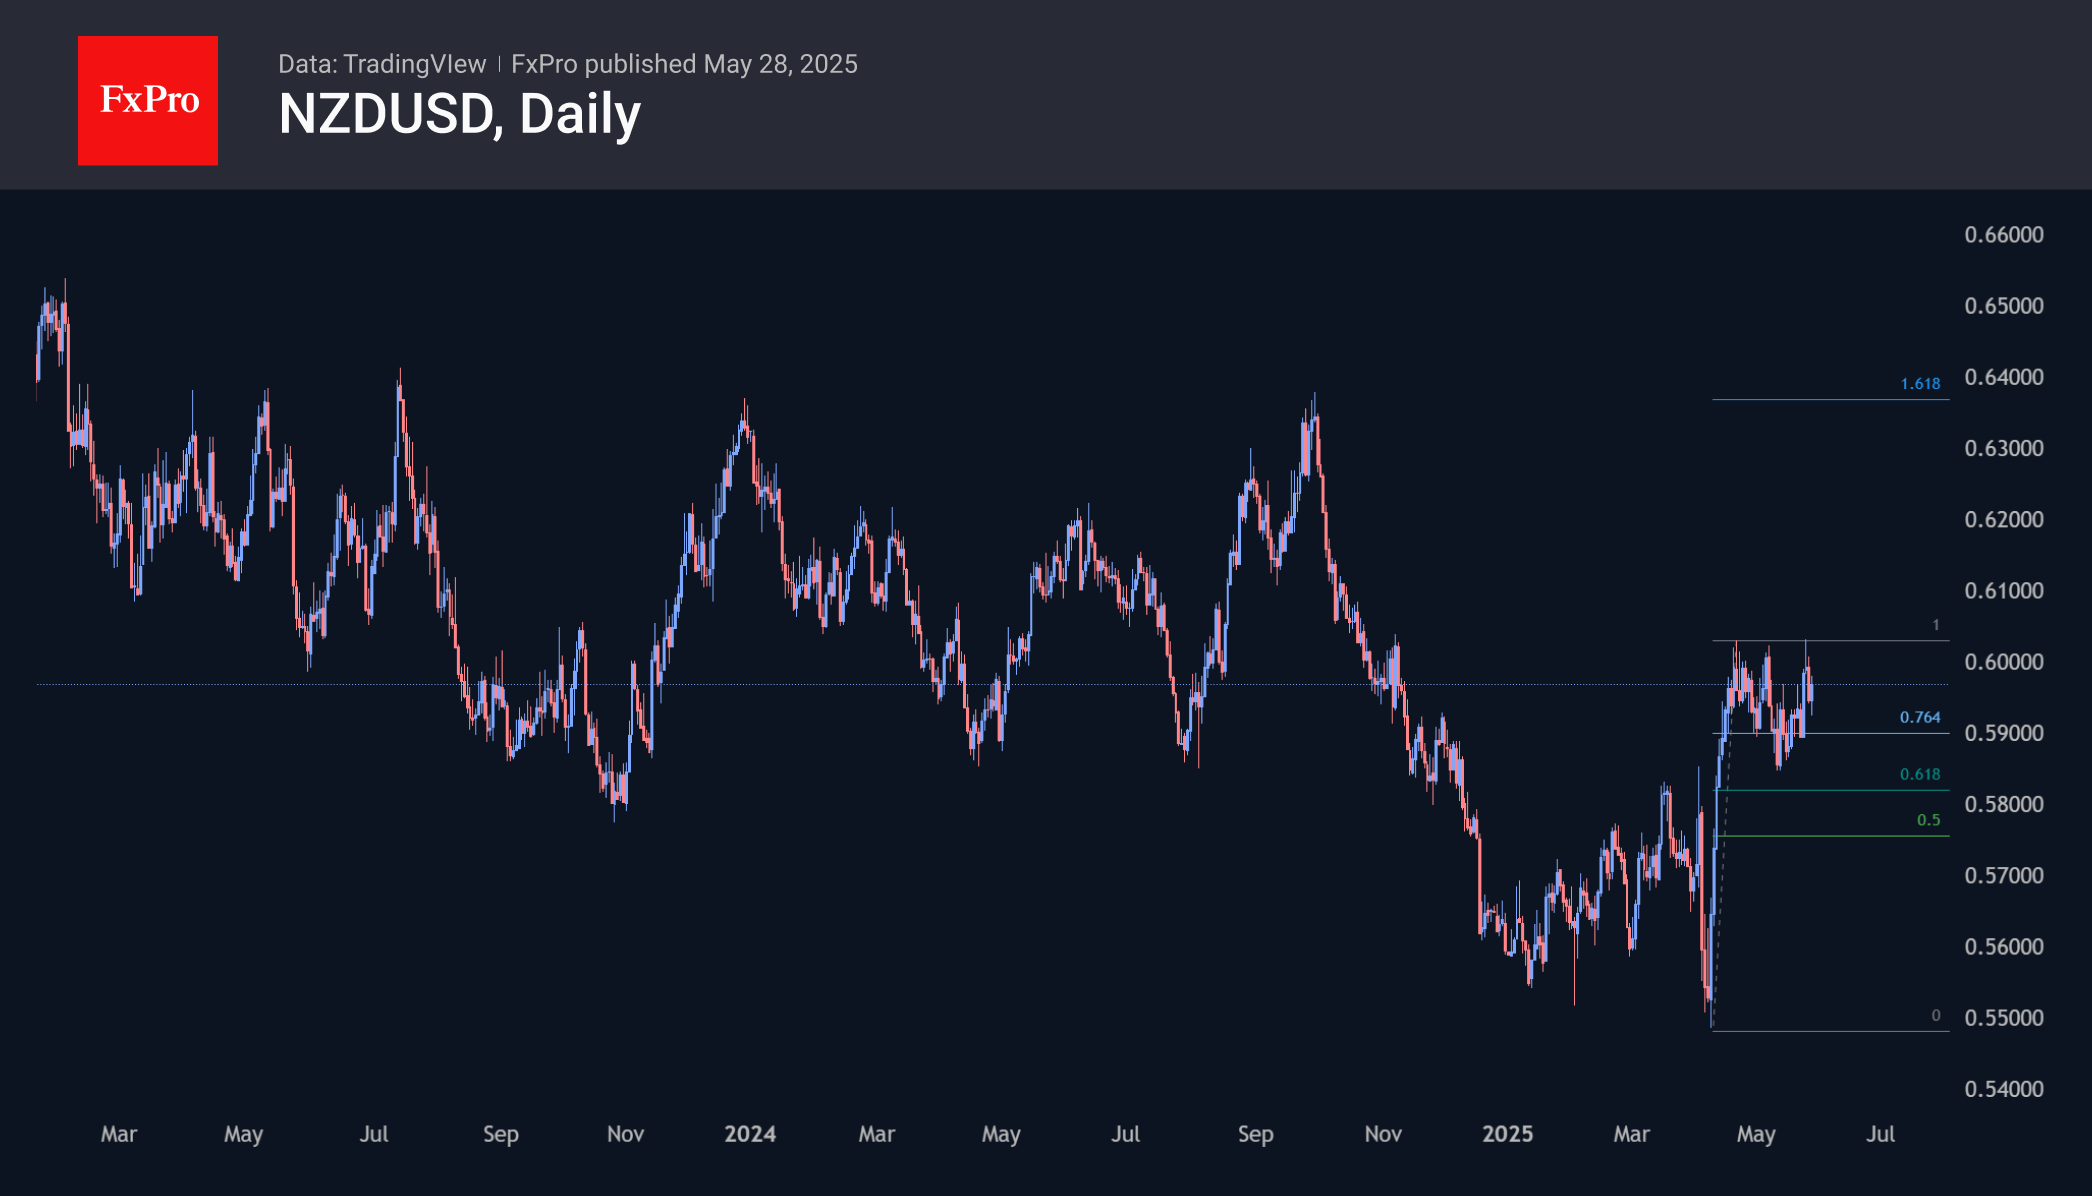
NZDUSD added 0.9% to the lows before the rate decision, rising to 0.5970. These levels near the area of highs since late April and a sequence of increasingly shallower local lows over the last couple of weeks are setting up imminent fresh attempts to break 0.6030.
The decline within this month looks like a temporary correction after a 10% rally off the April lows. A move above 0.6000 would give a range entry with resistance at 0.6360, which has remained impregnable since early 2023.
The New Zealand and Australian dollar trade near year-end levels, behind the three-year highs of the euro and pound against the dollar. However, recent softening in US and Asian tariff rhetoric is inflating the sails of the NZD and AUD.
GBP/USD: Initial Supports Hold Pullback for Now
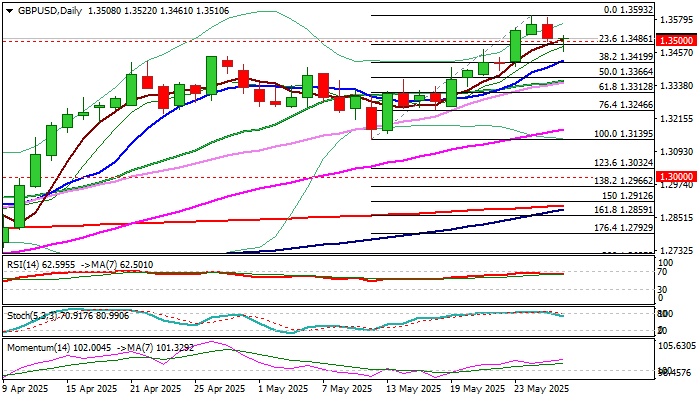
Cable remains at the back foot on Wednesday after Tuesday’s pullback from new multi-month high (1.3593) cracked psychological 1.3500 support.
Price dipped to 1.3561 this morning, but quick bounce to 1.3500 zone points to headwinds that fresh bears face.
Today’s action was so far shaped in Doji candle (indecision) with short-lived probe below initial Fibo support at 1.3486 (23.6% of 1.3195/1.3593 upleg) adding to potential bear-trap formation, in scenario of very shallow pullback preceding fresh attempts to extend larger uptrend.
Daily studies remain in full bullish configuration and support the notion.
Alternatively, loss of 1.3486/61 triggers would keep the downside vulnerable and risk attack at pivotal 1.3420 support (10DMA / Fibo 38.2%).
Res: 1.3544; 1.3564; 1.3593; 1.3643.
Sup: 1.3486; 1.3461; 1.3420; 1.3400.
USD/JPY Rises Steadily as Yen Weakens Amid Bond Market Pressures
The USD/JPY pair extended its gains on Wednesday, climbing to 144.46 as the Japanese yen depreciated for the third consecutive session.
Key factors driving USD/JPY movement
Markets are closely scrutinising remarks from major central bankers and developments in the bond sector.
Bank of Japan (BoJ) Governor Kazuo Ueda noted that ongoing trade discussions with the US are contributing to heightened uncertainty in Japan’s economic outlook. He reiterated the central bank’s readiness to adjust monetary policy if necessary to achieve its inflation targets.
Meanwhile, Finance Minister Katsunobu Kato stated that authorities are closely monitoring the bond market. This comes after both the yen and Japanese government bond (JGB) yields fell sharply following reports that the Ministry of Finance might reduce the issuance of ultra-long-dated bonds.
The potential reduction in bond supply appears to be an effort to curb rising yields, particularly after last week’s disappointing 20-year bond auction, which saw the weakest demand in a decade. Investors are now turning their attention to an upcoming 40-year bond sale.
Additionally, subdued market volatility and a stable external backdrop have diminished demand for the yen as a safe-haven asset, further contributing to its decline.
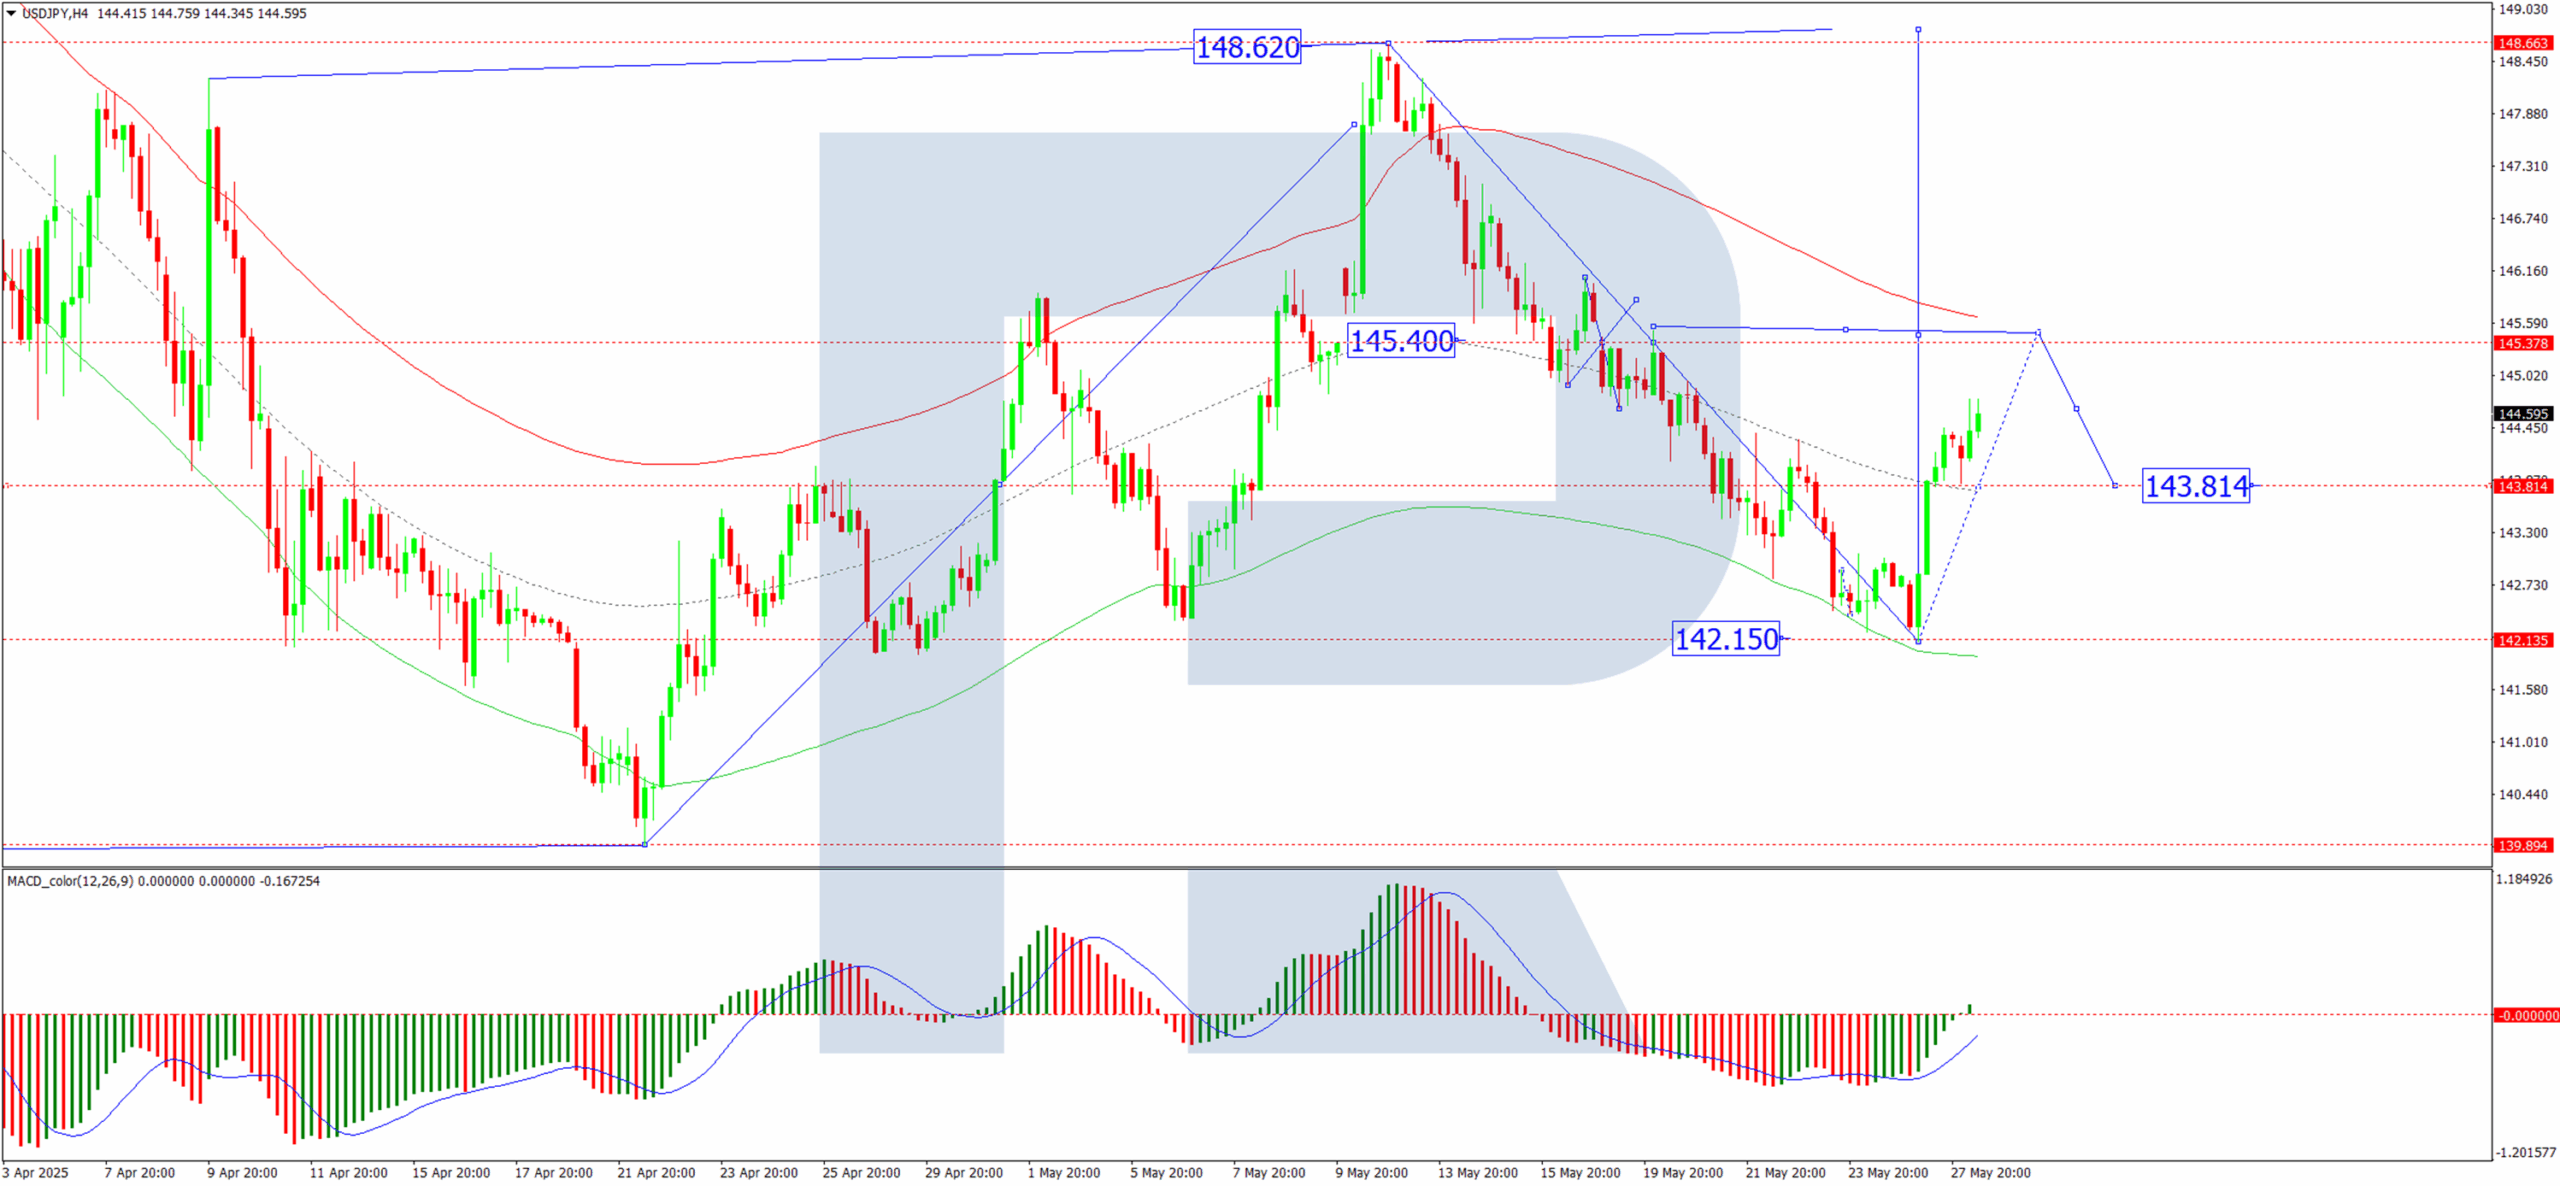
Technical analysis: USD/JPY
H4 Chart:
On the H4 chart, USD/JPY completed a downward wave to 142.15 before initiating an upward move towards 145.50, which remains the primary target. Today, we anticipate the completion of this upward wave, followed by a potential pullback to 143.81. A broader consolidation phase around this level is also plausible. This scenario is supported by the MACD indicator, whose signal line remains above zero and continues to trend upwards.
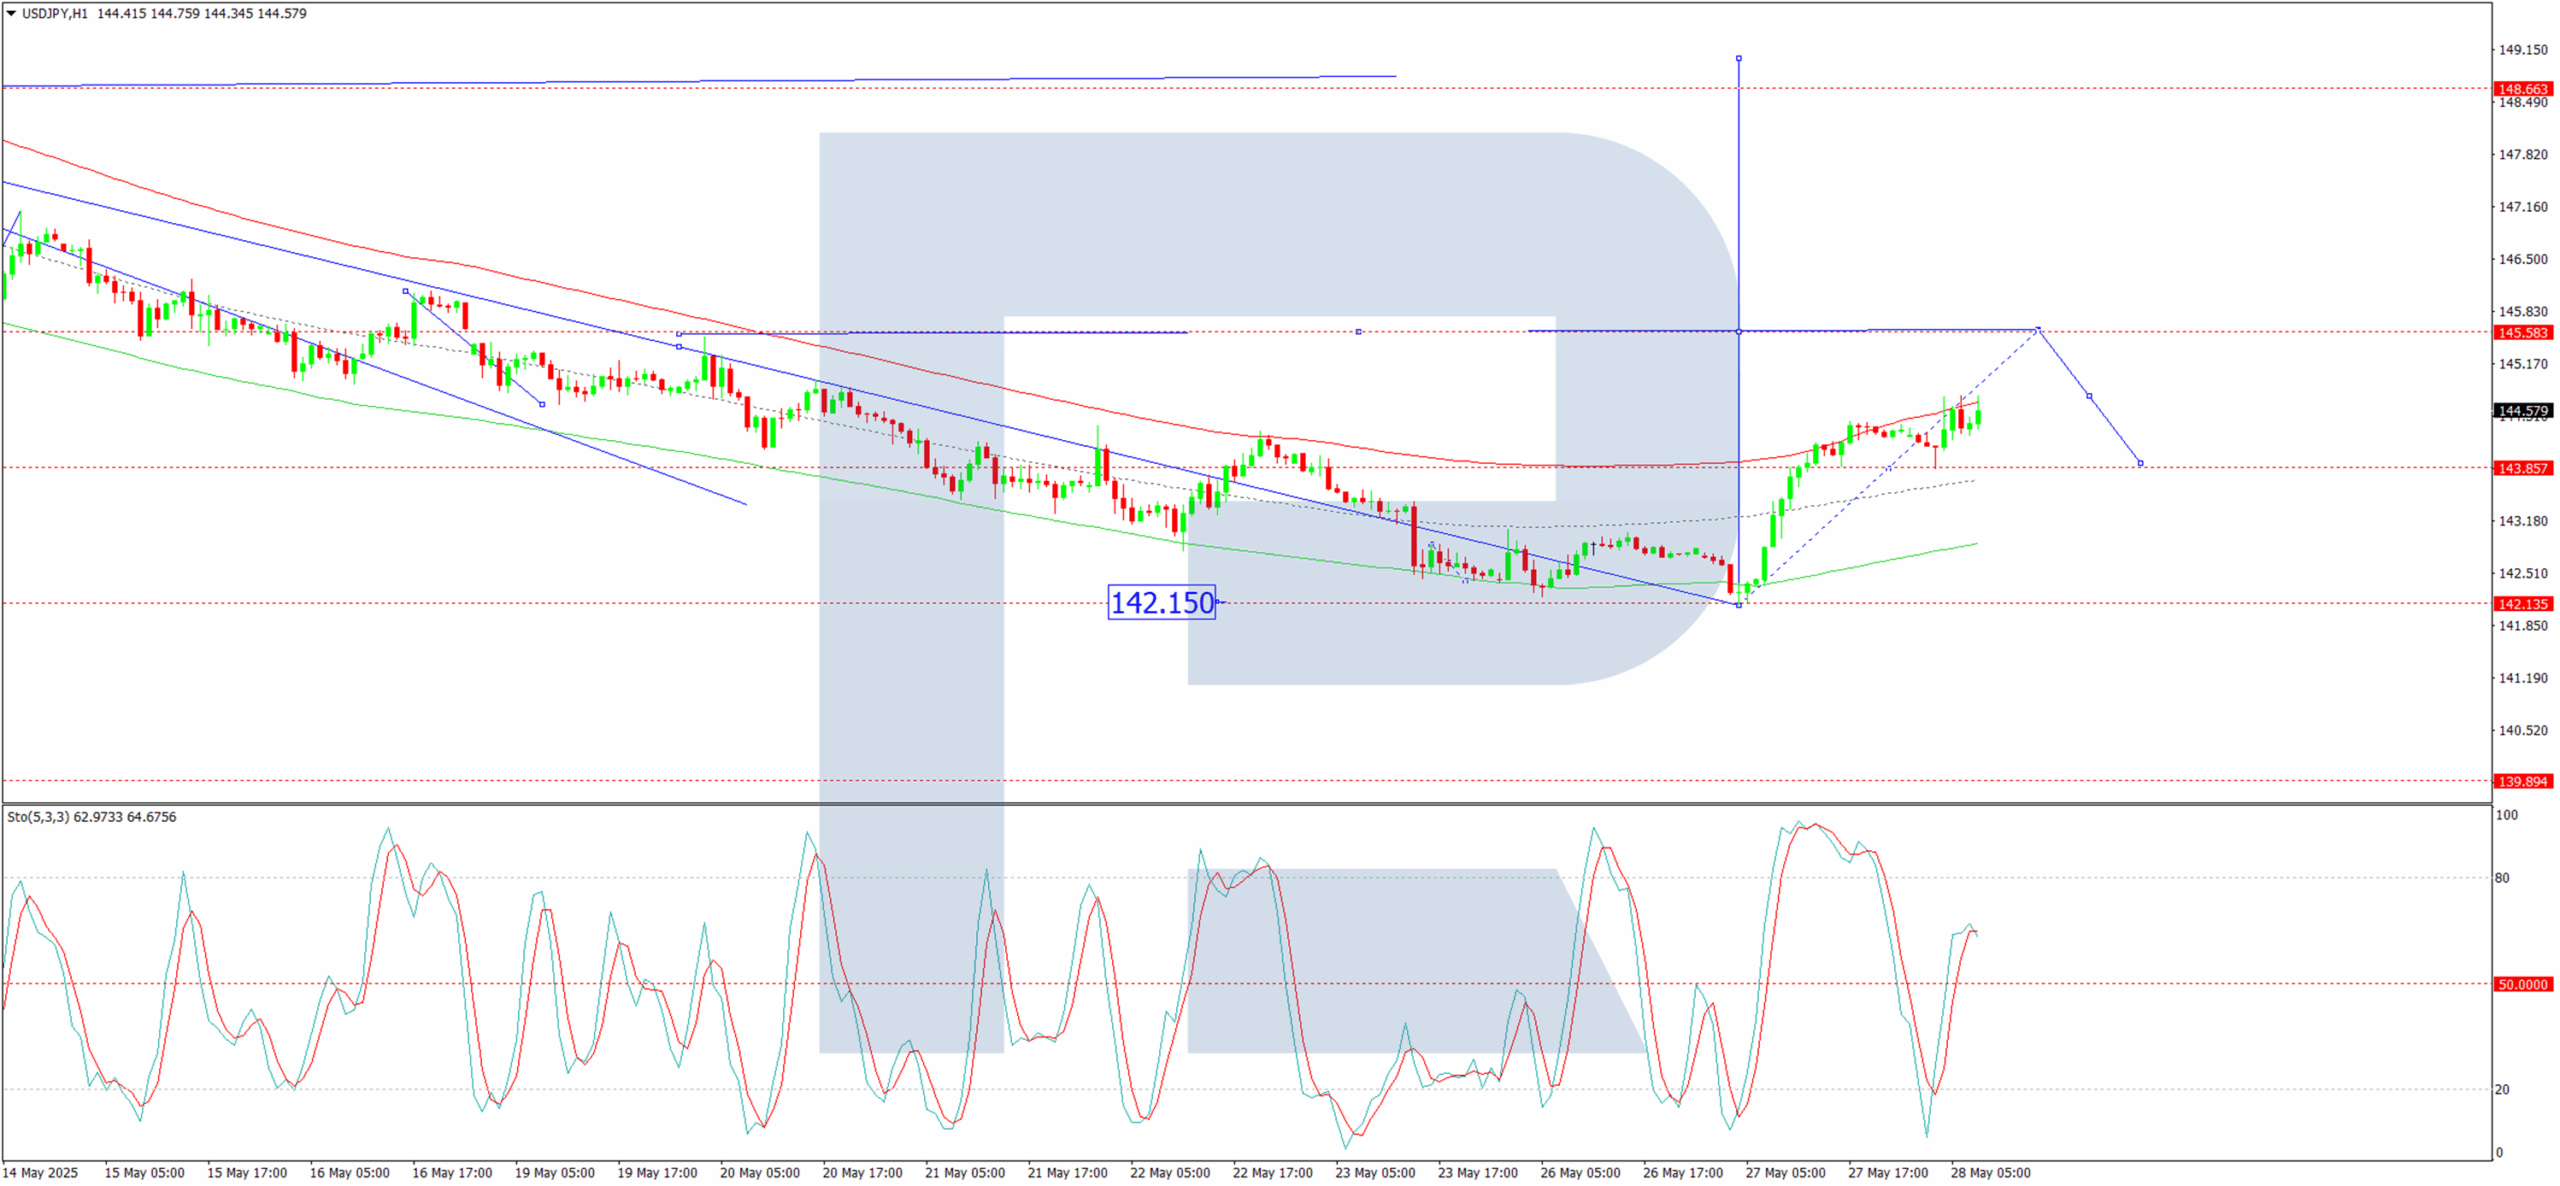
H1 Chart:
On the H1 chart, the pair formed a consolidation range around 143.85 after an initial upward wave. A breakout above this range could see a push towards 145.50, with a possible retracement to 143.85 before resuming the uptrend. A sustained break above 145.50 may extend gains towards 147.20. The Stochastic oscillator aligns with this outlook, with its signal line above 50 and rising towards 80, indicating bullish momentum.
Conclusion
The USD/JPY uptrend remains intact, supported by both fundamental and technical factors. Traders will be watching bond market developments and central bank signals for further directional cues.
ECB survey shows short-term inflation expectations climb as growth outlook worsens
ECB’s latest Consumer Expectations Survey for April showed a modest but notable uptick in short-term inflation expectations.
Median expectations for inflation over the next 12 months rose to 3.1%, the highest since February 2024. However, medium- and long-term inflation expectations remained steady, with the three-year outlook unchanged at 2.5% and the five-year projection holding at 2.1% for the fifth straight month.
Alongside the rise in short-term inflation forecasts, the survey revealed an increase in uncertainty about inflation over the coming year, matching levels last seen in June 2024.
More concerning, however, is the deepening pessimism around growth and employment. Expectations for economic growth over the next 12 months dropped sharply to -1.9% from -1.2% in March. Expected unemployment ticked up slightly from 10.4% to 10.5%.
Crypto Market Postpones Rally
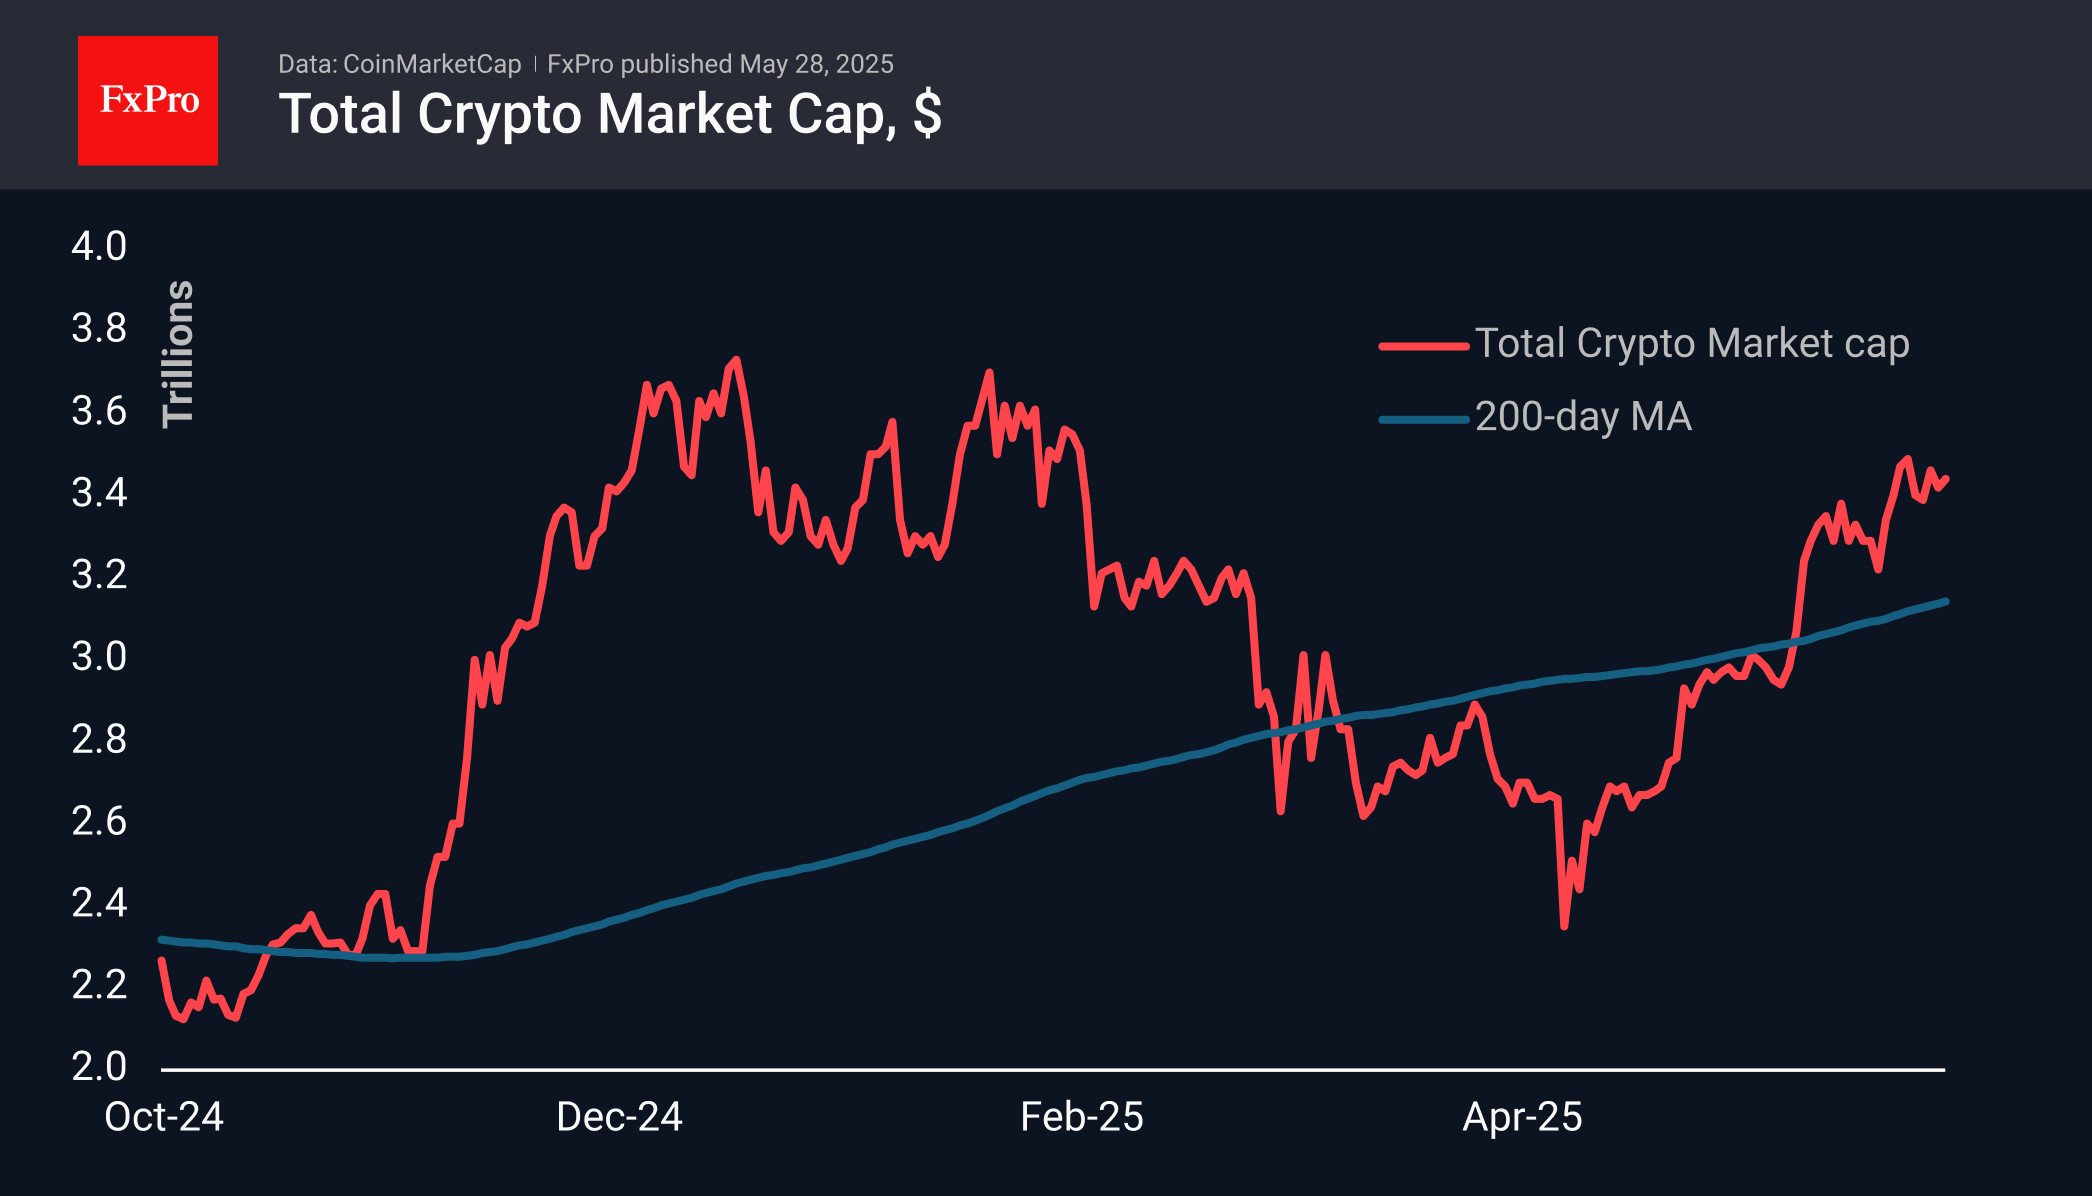
Market Picture
Market capitalisation has risen 0.5% in the last 24 hours to $3.44 trillion, but that’s below Tuesday’s intraday peaks of $3.49 trillion and last Friday’s highs of $3.54 trillion. This is an interesting development given the risk appetite in the stock markets over the last couple of days. Perhaps the behaviour of cryptocurrencies indicates that optimism isn’t so all-encompassing.
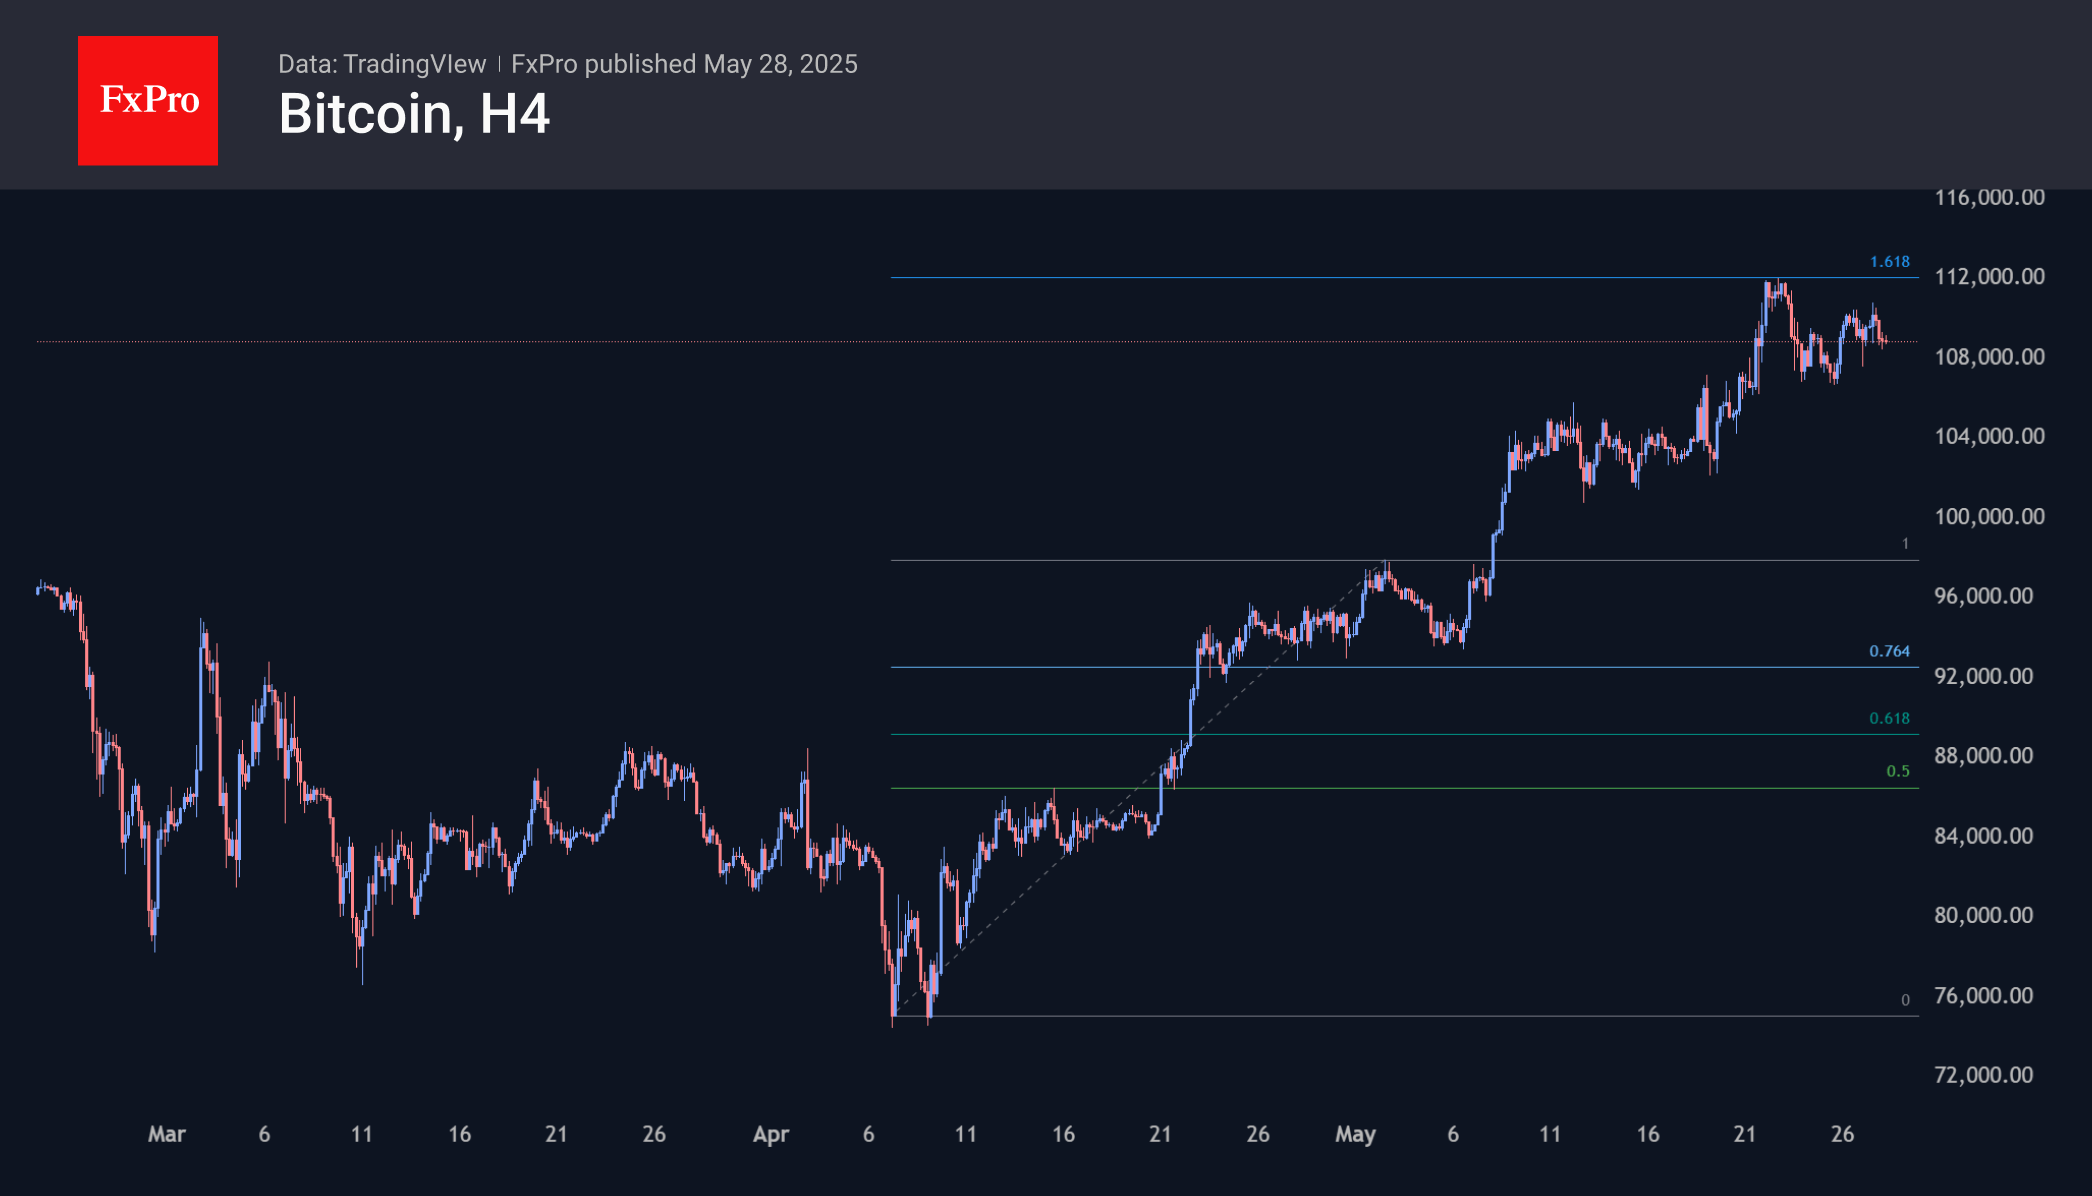
Bitcoin has been trading in a 5% range between $106.6k and $111.7k since 22 May and is currently in the middle. The current high area fits into a Fibonacci extension pattern at 161.8% of the first upside momentum from early April to the first days of May. Overcoming 112k would then be a prologue to 134k (261.8%).
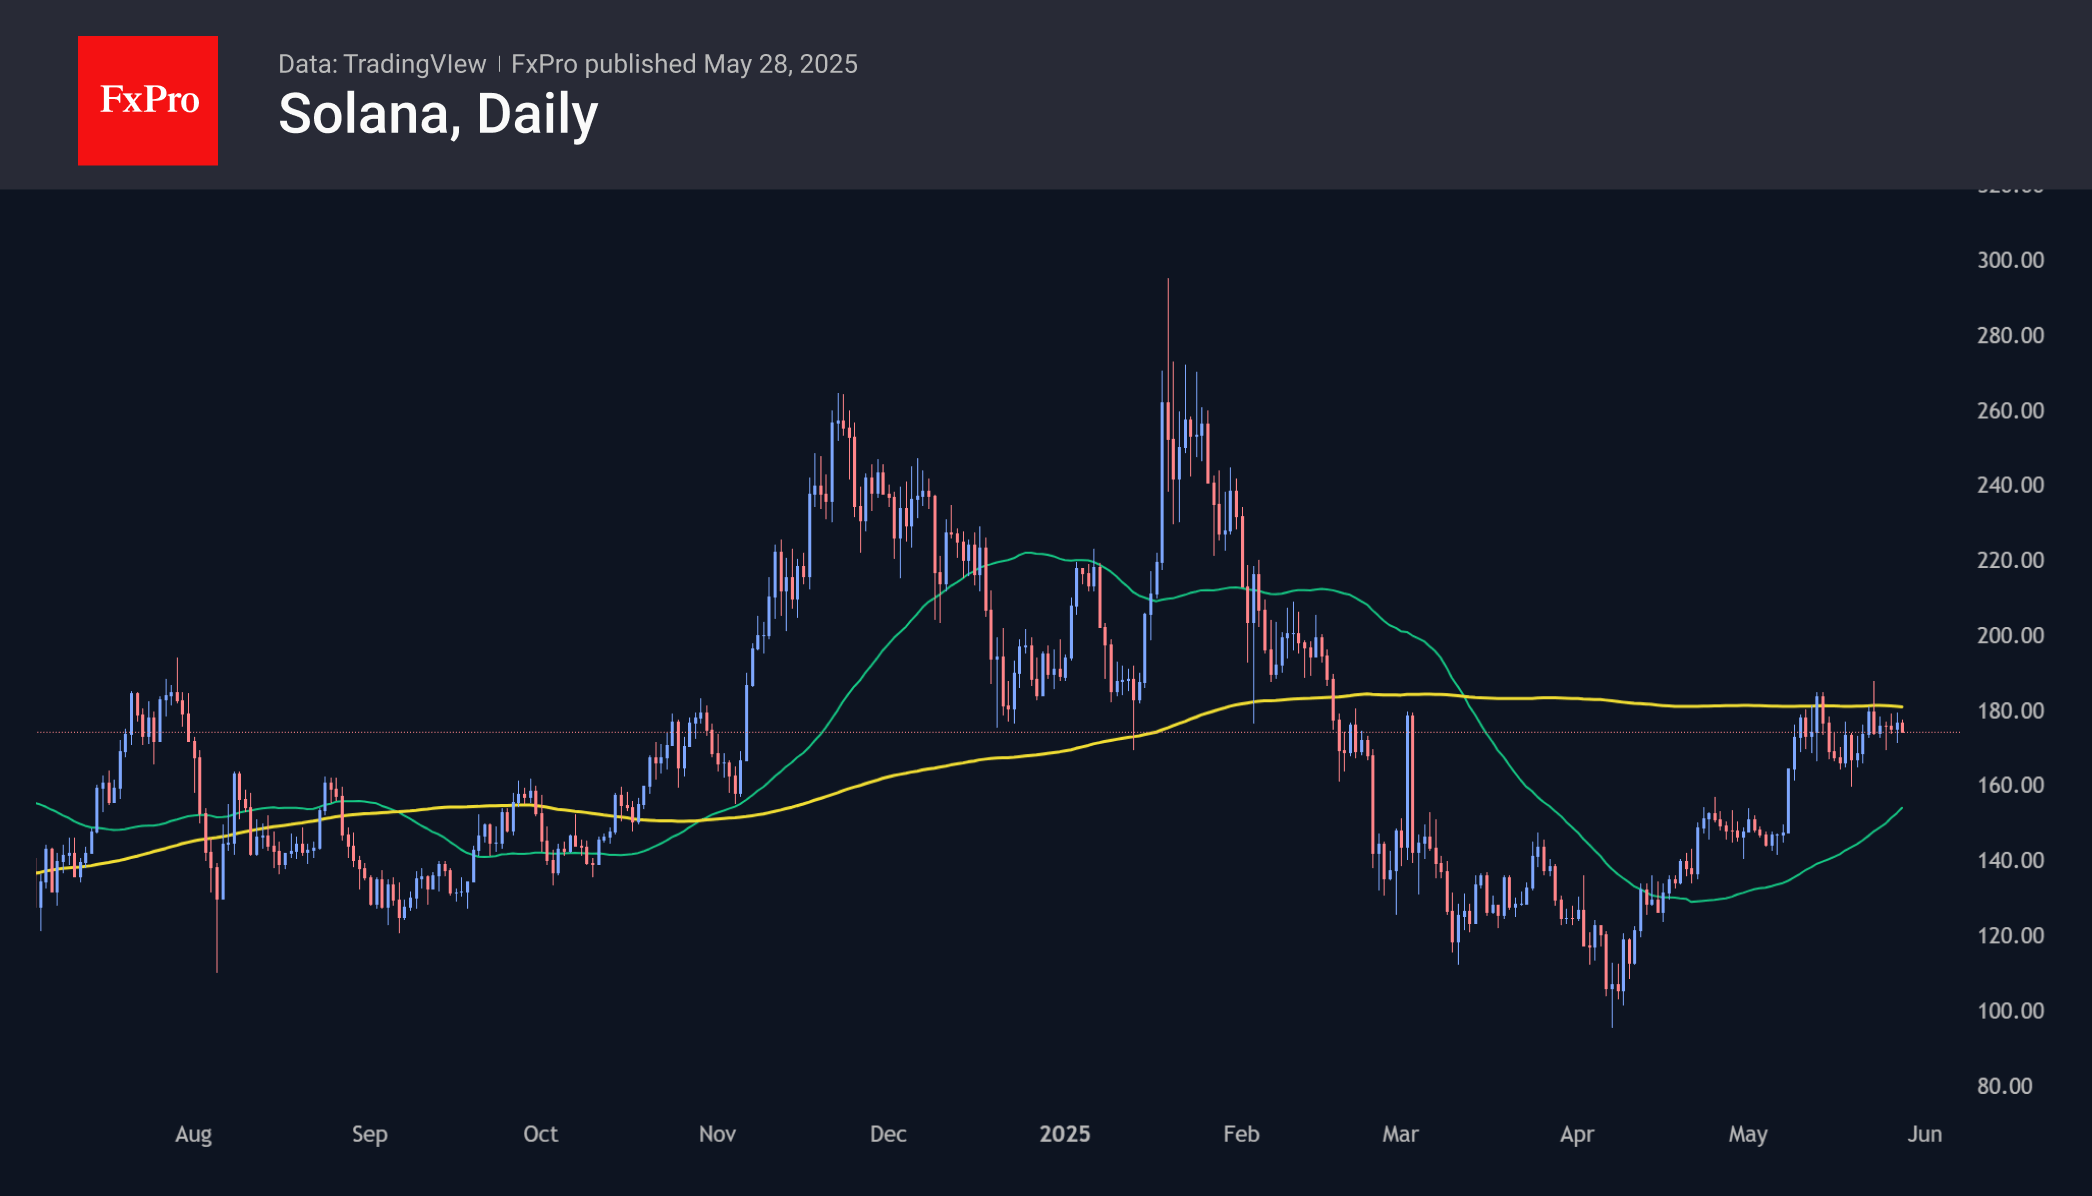
Ethereum and Solana have been battling resistance in the form of their 200-day moving averages for more than two weeks now. We seem to be dealing with an indecisive market choosing between a further mighty rally and fading after a rebound. Bitcoin’s rally has the potential to inspire big alts to break out, but for now, we are not there yet.
News Background
Bitcoin options maturing in June-July have been dominated by activity in calls with strikes of $115,000 and $120,000, Kaiko notes. The highest turnover was in contracts with expiry at $110,000, suggesting consolidation at established levels in the coming weeks.
Trump Media, a company linked to US President Donald Trump’s family, will raise $2.5bn through the sale of stocks and bonds to build a bitcoin reserve. The company has signed private placement agreements with about 50 institutional investors to raise the funds.
Circle, which issues the USDC stablecoin, has updated documents for an IPO on the NYSE. The goal is to raise about $600m with the firm’s valuation of $5.4bn.
Cardano founder Charles Hoskinson announced a willingness to integrate Ripple’s stablecoin RLUSD into its blockchain without charging fees, as a gesture of support for the XRP community.
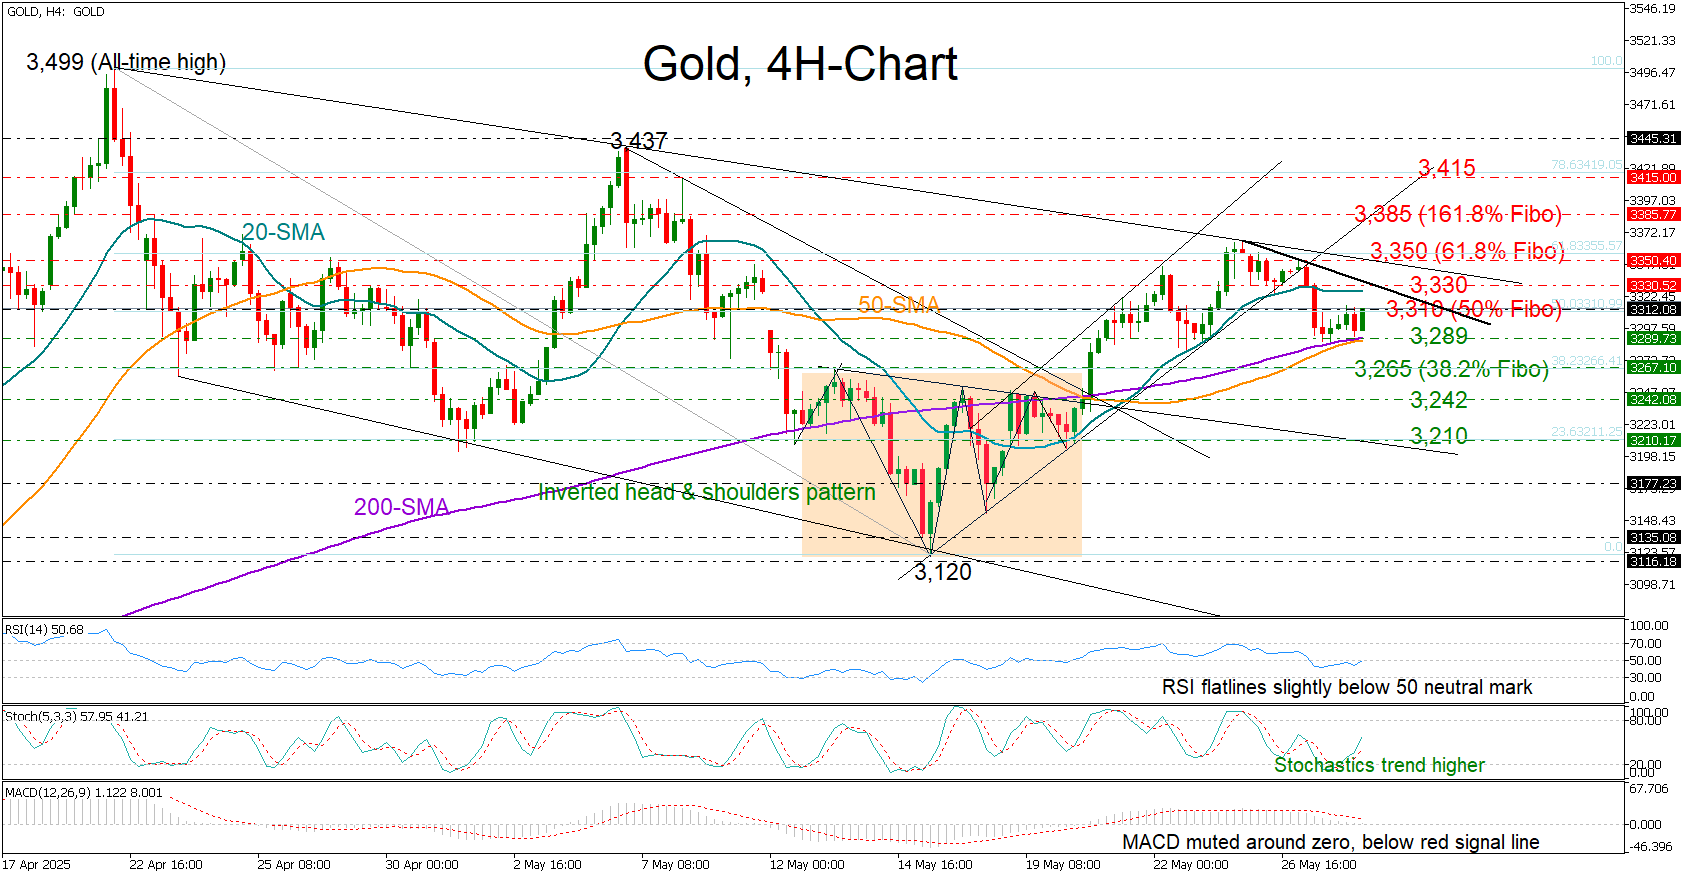
Gold’s Pullback Halts But Bears Still in Town
- Gold stabilizes near 200-SMA following bearish breakout.
- Technical signals still weak; resistance tested near 3,310.
Gold took a downturn after meeting the resistance line drawn from its all-time high of 3,499, raising concerns that a bearish wave similar to the one seen from May 5–15 could be underway.
With President Trump once again postponing his tariff threats against the EU, and the US dollar regaining some ground, the precious metal staged a bearish channel breakdown and closed below the protective 20-period simple moving average (SMA) on the four-hour chart.
The 200-period SMA has been curbing selling forces around the 3,285 region over the past couple of hours. However, whether the bulls will be able to establish a strong foothold there remains to be seen, as the RSI and MACD are showing no meaningful progress, unable to follow the stochastic oscillator higher. Friday’s core PCE inflation figures might be the next source of volatility.
If the support at 3,285 fails, the price could find footing near the 3,265 area, which overlaps with the 38.2% Fibonacci retracement of the April–May decline. The 3,245 level could also offer support, as it did back in April. If these levels do not hold, the price could slide toward the neckline of the completed inverted head-and-shoulders pattern at 3,212. A break below this neckline may extinguish any hopes for a rebound, potentially driving the price down to the 3,175 support zone.
On the upside, the 50% Fibonacci level at 3,310 has been a hurdle so far today. If the bulls manage to overcome that barrier, they would next need to reclaim the 20-period SMA at 3,330, and then pierce through the crucial resistance trendline at 3,350 to restore buying confidence. Even higher, resistance could emerge near the 3,385 level before a potential return to the 3,420 territory.
In summary, although gold has found a technically favorable support area for a potential bullish phase, it remains vulnerable according to current technical indicators, with sellers eyeing a break below 3,285 to stage the next leg down.
Gold Victorious Amid Tariff and Fiscal Uncertainty
- Gold gains 27% year-to-date due to safe-haven flows.
- ·Uncertainty about Trump’s tariff strategy has offered support.
- Central banks continue their gold-buying spree.
- Trump’s fiscal plans are also a reason for seeking shelter.
Is Gold the asset of choice for 2025?
Gold has been performing incredibly well since the start of the year, outperforming every other major asset under our radars. Its performance even surpasses that of bitcoin, gaining around 27%, while the crypto king added only 15% during the first five months of 2025.
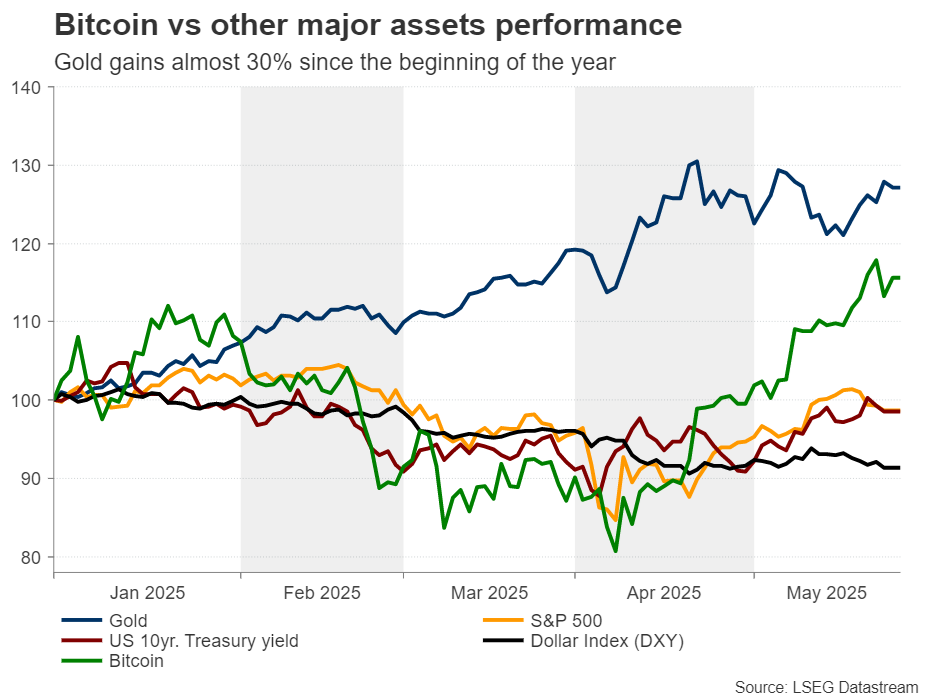
But why does gold seem to be the financial asset of choice nowadays? Traditionally, gold is considered a safe haven asset, gaining traction when investors are afraid of a global economic crisis or they are concerned about geopolitical tensions and conflicts. And during the last couple of months, we had both.
Trump’s tariff rhetoric and actions
Concerns about Trump’s tariff rhetoric and actions have sparked a flight to safety into gold as investors became concerned that the US President’s tactics will throw the US economy into recession. However, the 90-day delay on the reciprocal duties, alongside the trade accords with the UK and the US, eased such concerns, causing some risk-on trading. Stocks traded higher, the dollar rebounded somewhat, and gold pulled back.
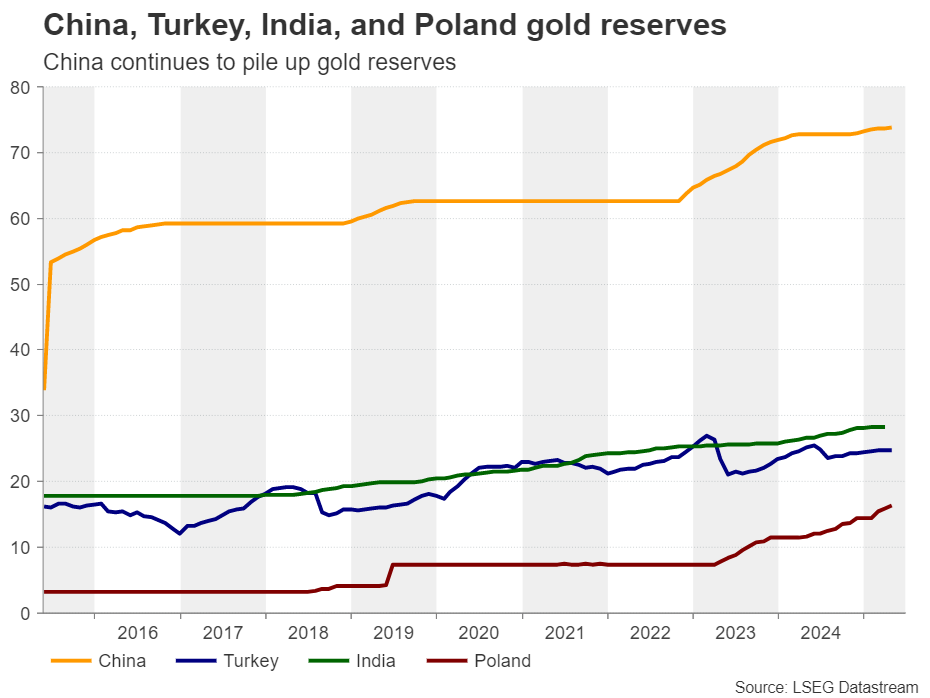
Central banks pile up reserves
However, the correction in gold was not of the same magnitude as the recovery in equities, which suggests that many market participants decided to maintain their holdings. It could also be due to major central banks, like the PBoC, which continue to add to their reserves. In an effort to further loosen its dependency on the US dollar and minimize the impact of Trump’s policies to the world’s second largest economy, the Chinese central back continued buying gold in April, for the sixth consecutive month.
Fiscal concerns add more fuel to Gold’s engines
Then came Trump’s fiscal bill, which triggered the alarm bells of the ballooning US debt. The bill, which is still pending Senate approval, is expected to add around $4 trillion to the US debt over the next decade, and the anxiety about this resulted in another round of ‘Sell America’. Investors sold their US stocks, bonds and the dollar. Gold benefited, moving in tandem with Treasury yields. The relationship between the precious metal and yields is usually inverse.
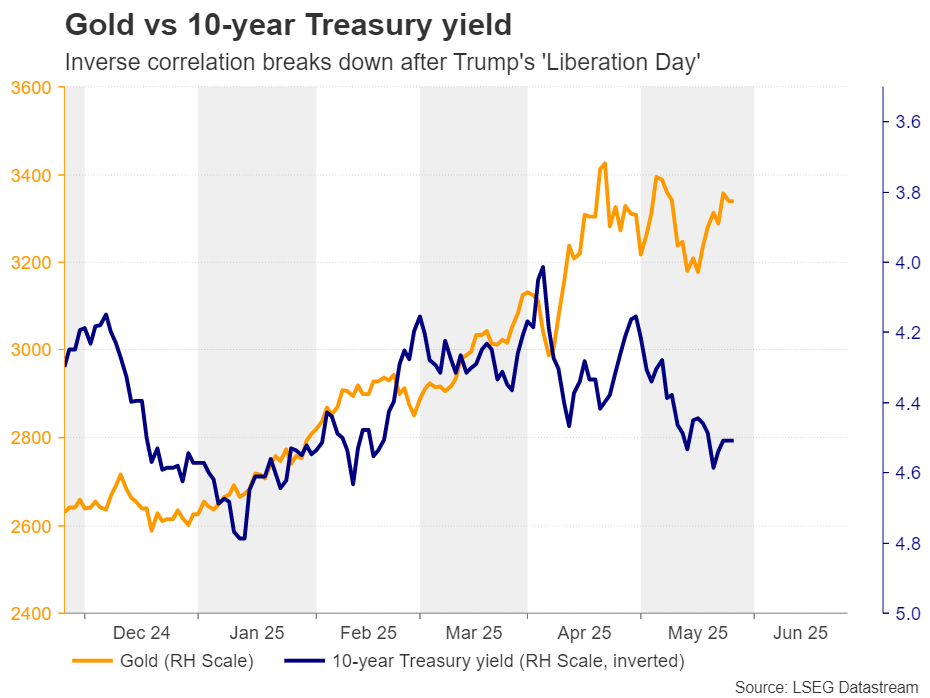
A ballooning debt could crowd out private investment, which could thereby slow down economic growth, and more importantly, it could limit the government’s ability to respond to crises with spending. Even if the Fed comes to the rescue through its liquidity channels, its actions could lead to an even weaker dollar and higher inflation. Higher inflation may require higher interest rates, which could translate into further advances in Treasury yields, making it even harder for the government to repay its debt.
Upside risks well entrenched
The risk of entering such a loophole may prompt more market participants to turn their attention to gold, even if yields continue to rise, as this would not reflect an increasing opportunity cost for holding gold, but rather increasing concerns about the downside risks to the US economy.
The unpredictable character of US President Trump is also a reason for private investors and central banks to stay active in the gold market. At the end of last week, he threatened to raise the tariff rate on EU goods to 50% as soon as June 1, due to negotiations proceeding very slowly, but just two days later, he posted on social media that he was pushing his deadline to July 9 after a “very nice” call with Ursula von der Leyen.
Therefore, with the environment still uncertain and the VIX index bottoming at higher levels than the lows it posted in 2024, gold is likely to stay supported for a while longer, even if it experiences some more noticeable pullbacks.
Awaiting the trend continuation sign
From a technical standpoint, gold pulled back this week, after hitting resistance near a downward sloping line drawn from the record high of $3,500, which was hit on April 22. That said, the metal is still trading above the uptrend line drawn from the low of December 31, which means that the outlook remains cautiously positive.
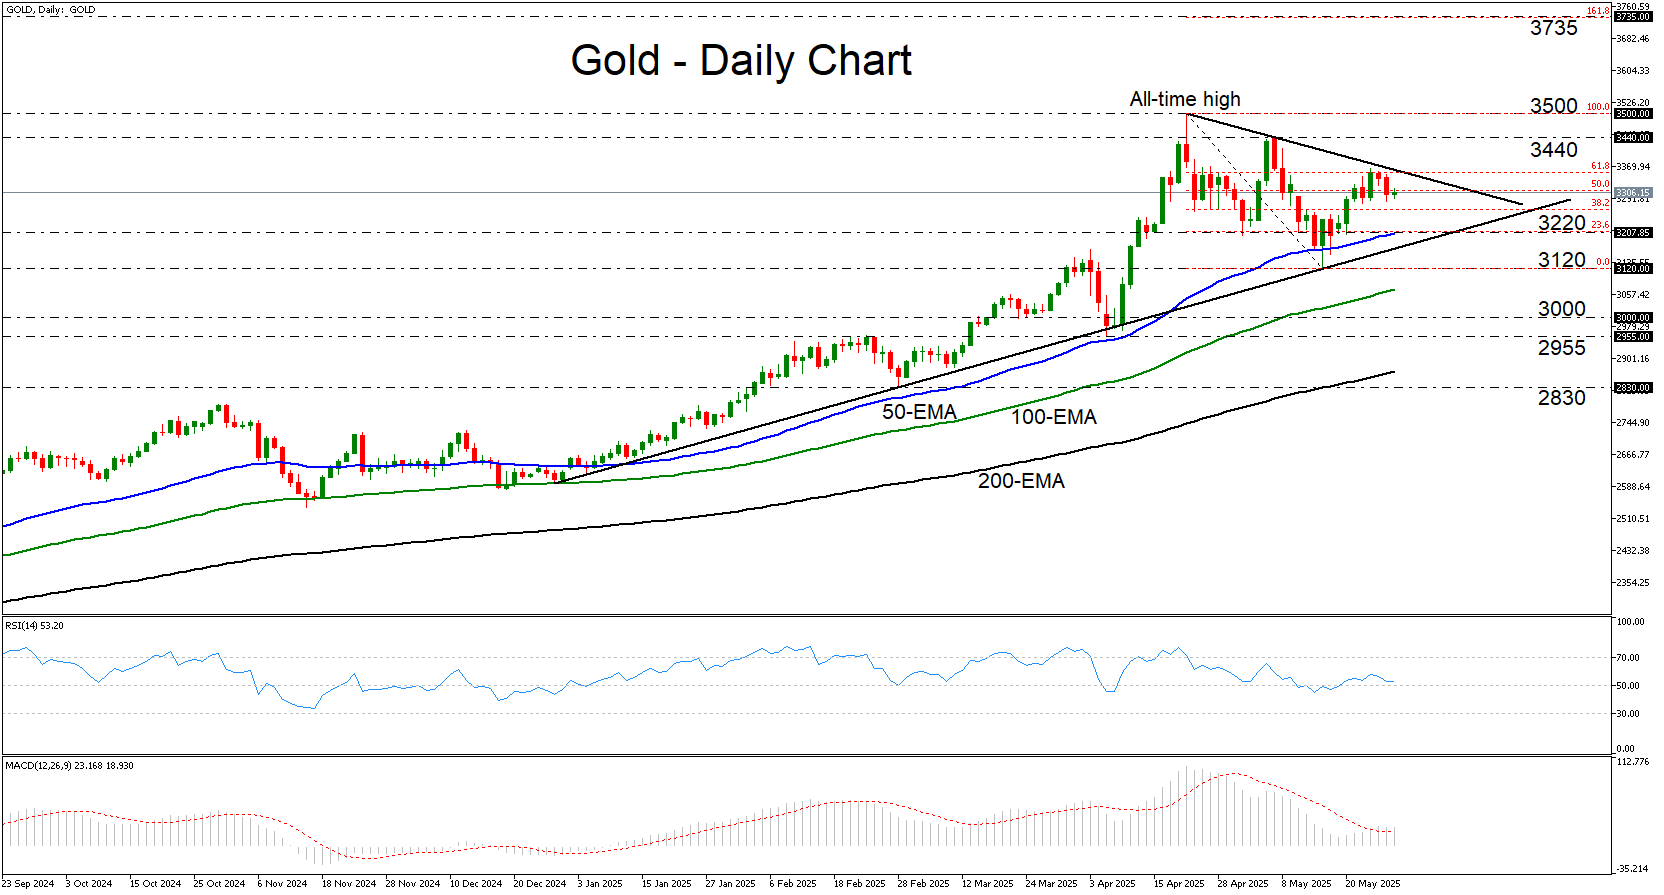
A move above $3,440 would solidify the break of the aforementioned downward sloping line and may allow advances towards the record high of $3,500. If the bulls are willing to go for another higher high, they could then climb all the way towards the $3,735 zone, which is the 161.8% Fibonacci extension level of the April 22 – May 15 correction. On the downside, a drop below $3,120 will confirm a forthcoming lower low and perhaps signal a bearish trend reversal.