Sample Category Title
(RBNZ) OCR lowered to 3.25%
The Monetary Policy Committee today voted to lower the OCR by 25 basis points to 3.25 percent.
Annual consumers price index inflation increased to 2.5 percent in the first quarter of 2025. Inflation expectations across firms and households have also risen. However, core inflation is declining and there is spare productive capacity in the economy. These conditions are consistent with inflation returning to the mid-point of the 1 to 3 percent target band over the medium term.
The New Zealand economy is recovering after a period of contraction. High commodity prices and lower interest rates are supporting overall economic activity.
Recent developments in the international economy are expected to reduce global economic growth. Both tariffs and increased policy uncertainty overseas are expected to moderate New Zealand’s economic recovery and reduce medium-term inflation pressures. However, there remains considerable uncertainty around these judgements.
Inflation is within the target band, and the Committee is well placed to respond to domestic and international developments to maintain price stability over the medium term.
Summary Record of Meeting – May 2025
Annual consumers price index (CPI) inflation remains within the Monetary Policy Committee’s 1 to 3 percent target band. While measures of inflation expectations have increased, core inflation and spare productive capacity in the economy are consistent with inflation returning to the target mid-point over the medium term. Elevated export prices and recent reductions in the OCR are expected to support a modest pace of growth in the New Zealand economy, even as increased global tariffs are expected to slow global economic growth.
Higher global tariffs and policy uncertainty are expected to lower global growth
The Committee noted that projections for global economic activity have weakened since the February Statement, reflecting the shift towards protectionist policies in some major economies. There have been downward revisions to economic growth projections for China and the US, reflecting the scale of tariff increases between these two countries.
The Committee noted that, in addition to the direct effect of higher tariffs, increased policy uncertainty in the international economy is likely to weigh on global investment and consumption. As well as uncertainty about tariff retaliation, it was unclear how countries would respond with fiscal and monetary policies. For example, it is possible that China could respond to weaker economic activity with a sizeable fiscal stimulus. US fiscal policy could place strains on the sustainability of its public debt. More generally, the uncertain trajectory of geoeconomic fragmentation and the decline in the quality of macroeconomic institutional arrangements were likely to result in precautionary behaviour by firms and households. In aggregate, economic growth in New Zealand’s main trading partners is expected to remain below potential over 2025.
Headline inflation within New Zealand’s trading partner economies has fallen over the past year. Projections for inflation for most of our trading partners have been revised down in recent quarters. The main exception is the US, where higher tariffs are expected to increase inflationary pressure.
The New Zealand economy is starting to recover, after contracting over the middle of 2024
The Committee noted that spare productive capacity remains in the New Zealand economy. This is projected to dissipate over the medium term as the economy recovers. Elevated export commodity prices and lower interest rates are supporting overall economic activity in the New Zealand economy. The Committee noted that the full economic effects of cuts in the OCR since August 2024 are yet to be fully realised.
The Committee discussed conditions in New Zealand’s labour market. Nominal wage growth is slowing, while firms report that it is easier to find workers. Employment growth is currently modest but expected to increase from the second half of the year in line with the broader economic recovery.
The announced increase in US tariffs will lower global demand for New Zealand’s exports, particularly from Asia, constraining domestic growth. Heightened global policy uncertainty is expected to weigh on business investment and consumption in New Zealand.
On balance, the Committee expects the increase in global tariffs to result in less inflationary pressure in the New Zealand economy. However, as discussed below, there is significant uncertainty about this assessment, depending on whether the impact of tariffs proves to be predominantly demand- or supply-side in nature. The domestic monetary policy response will focus on the medium-term implications for inflation.
Domestic fiscal policy is assessed as being broadly neutral from a medium-term inflation perspective, relative to February Statement projections. The change announced in Budget 2025 enabling businesses to bring forward depreciation allowances is assumed to increase investment activity. However, the inflationary consequences of this policy are assumed to be offset by an announced reduction in government spending.
Annual CPI inflation is expected to remain in the target band, and converge to the mid-point
The Committee discussed domestic inflationary pressure. New Zealand’s annual CPI inflation increased to 2.5 percent in the March 2025 quarter, largely in line with previous projections. Most annual core inflation measures continued to decline in the March 2025 quarter, and all are now within the target band for headline CPI inflation.
Annual CPI inflation is projected to increase to 2.7 percent in Q3 2025, then return to near the 2 percent target midpoint from 2026. The near-term increase in headline inflation includes higher food and electricity price inflation.
Non-tradables inflation is expected to continue to decline, consistent with spare productive capacity in the economy. Annual tradables inflation is projected to remain around 1 percent over the medium term, reflecting below average global growth and falling inflation within our trading partners.
The financial system remains stable
The Committee noted that most wholesale interest rates have fallen since the February Statement, resulting in lower mortgage and term deposit rates. The average interest rate on the stock of mortgages is expected to continue to decline in coming quarters as more mortgage holders refix at lower fixed-term interest rates. Close to half the stock of mortgages is due to reprice during the June and September 2025 quarters.
The Committee was briefed on financial system stability. While non-performing loans in the housing and small business sectors have increased in line with the past contraction in the economy, the banking system remains well capitalised and in a strong financial position to support customers. The Committee agreed that there is currently no material trade-off between meeting inflation objectives and maintaining financial system stability.
The Committee was briefed on the status of the Large Scale Asset Purchase programme. The Committee noted there has been increased volatility in domestic wholesale interest rates, reflecting increased global policy uncertainty. Despite this volatility, wholesale interest rate markets continue to function, without impeding monetary policy transmission.
Risks around the economic outlook are heightened
The Committee discussed several key risks around the central projection. Measures of business and household inflation expectations have increased. The Committee discussed whether this increase reflected factors like higher food prices and current reporting on the inflationary effect of tariffs in the US. The projections assume that medium-term inflation expectations remain consistent with the target mid-point. Some Committee members emphasised the risk that these increases reflect a more generalised and persistent increase in inflation expectations.
The Committee discussed the medium-term outlook for import prices. Members noted that a less productive global economy, against a background of deglobalisation, presents an upside risk to the current import price projection.
The Committee noted downside risks to the outlook for export prices. This reflects a weaker global growth outlook and the potential for a quicker international supply response to high prices from global meat and dairy producers.
The Committee noted the risk that large economic policy shifts in overseas economies could lead to additional volatility in financial markets. For example, concerns about US debt sustainability could lead to increased bond yields or declines in global asset prices.
There are alternative scenarios for the domestic outlook
In addition to the uncertain scale and duration of tariff policies, it is unclear how these will transmit to the New Zealand economy. Some members emphasised that the costs of trade could increase more than currently assumed, as global supply chains adapt to trade barriers and geoeconomic fragmentation. This could result in greater domestic medium-term inflationary pressure than in the central projection. Other members emphasised that policy uncertainty could lower global investment, and trade diversion could lower import prices by more than currently assumed. This could, instead, lower medium-term inflationary pressure relative to the central projection.
Two scenarios in the May Statement highlight how the realisation of these risks could affect the outlook for the domestic economy. These scenarios represent just two of many paths the economy may take as higher tariffs and uncertainty transmit through the system. They are intended to broadly highlight the trade-offs and considerations facing the Committee should these risks eventuate.
The Committee noted that, in practice, a broad range of factors contribute to its monetary policy decisions. Its response to any of these risks would depend on economic conditions at the time, the outlook for inflationary pressure, and its secondary objectives of avoiding unnecessary instability in the economy and having regard to financial system stability.
The Committee voted to reduce the OCR to 3.25 percent
The Committee agreed on the projected central path for the OCR.
The Committee discussed the options of keeping the OCR on hold at 3.50 percent or reducing it to 3.25 percent. The case for lowering the OCR to 3.25 percent highlighted that CPI inflation is in the target range and there is significant spare capacity in the economy. Measures of core inflation and wage inflation have continued to decline. In addition, there is a weaker outlook for domestic activity and inflationary pressure relative to the February Statement, because of international developments. Some members also emphasised that non-tradable inflation was currently being boosted by administered prices. Given these factors, a 25 basis point decline in the OCR was seen as consistent with medium-term price stability.
In considering the merits of holding the OCR unchanged at 3.50 percent for this meeting, some members noted that this would allow the Committee to better assess whether increased economic policy uncertainty was having a noticeable impact on household and firm behaviour. An unchanged OCR could also further consolidate inflation expectations around the target mid-point, and guard against the risk of higher-than expected inflation from the supply-side effects of increased tariffs.
On Wednesday 28 May, the Committee took the decision to vote on the two options. By a majority of 5 votes to 1, the Committee agreed to decrease the OCR by 25 basis points from 3.50 percent to 3.25 percent.
Inflation is within the target band, and the Committee is well placed to respond to both domestic and international developments to maintain price stability over the medium term.
Attendees
Members of MPC: Christian Hawkesby (Chair), Bob Buckle, Carl Hansen, Karen Silk, Paul Conway, Prasanna Gai
Treasury Observer: Dominick Stephens
MPC Secretary: Adam Richardson
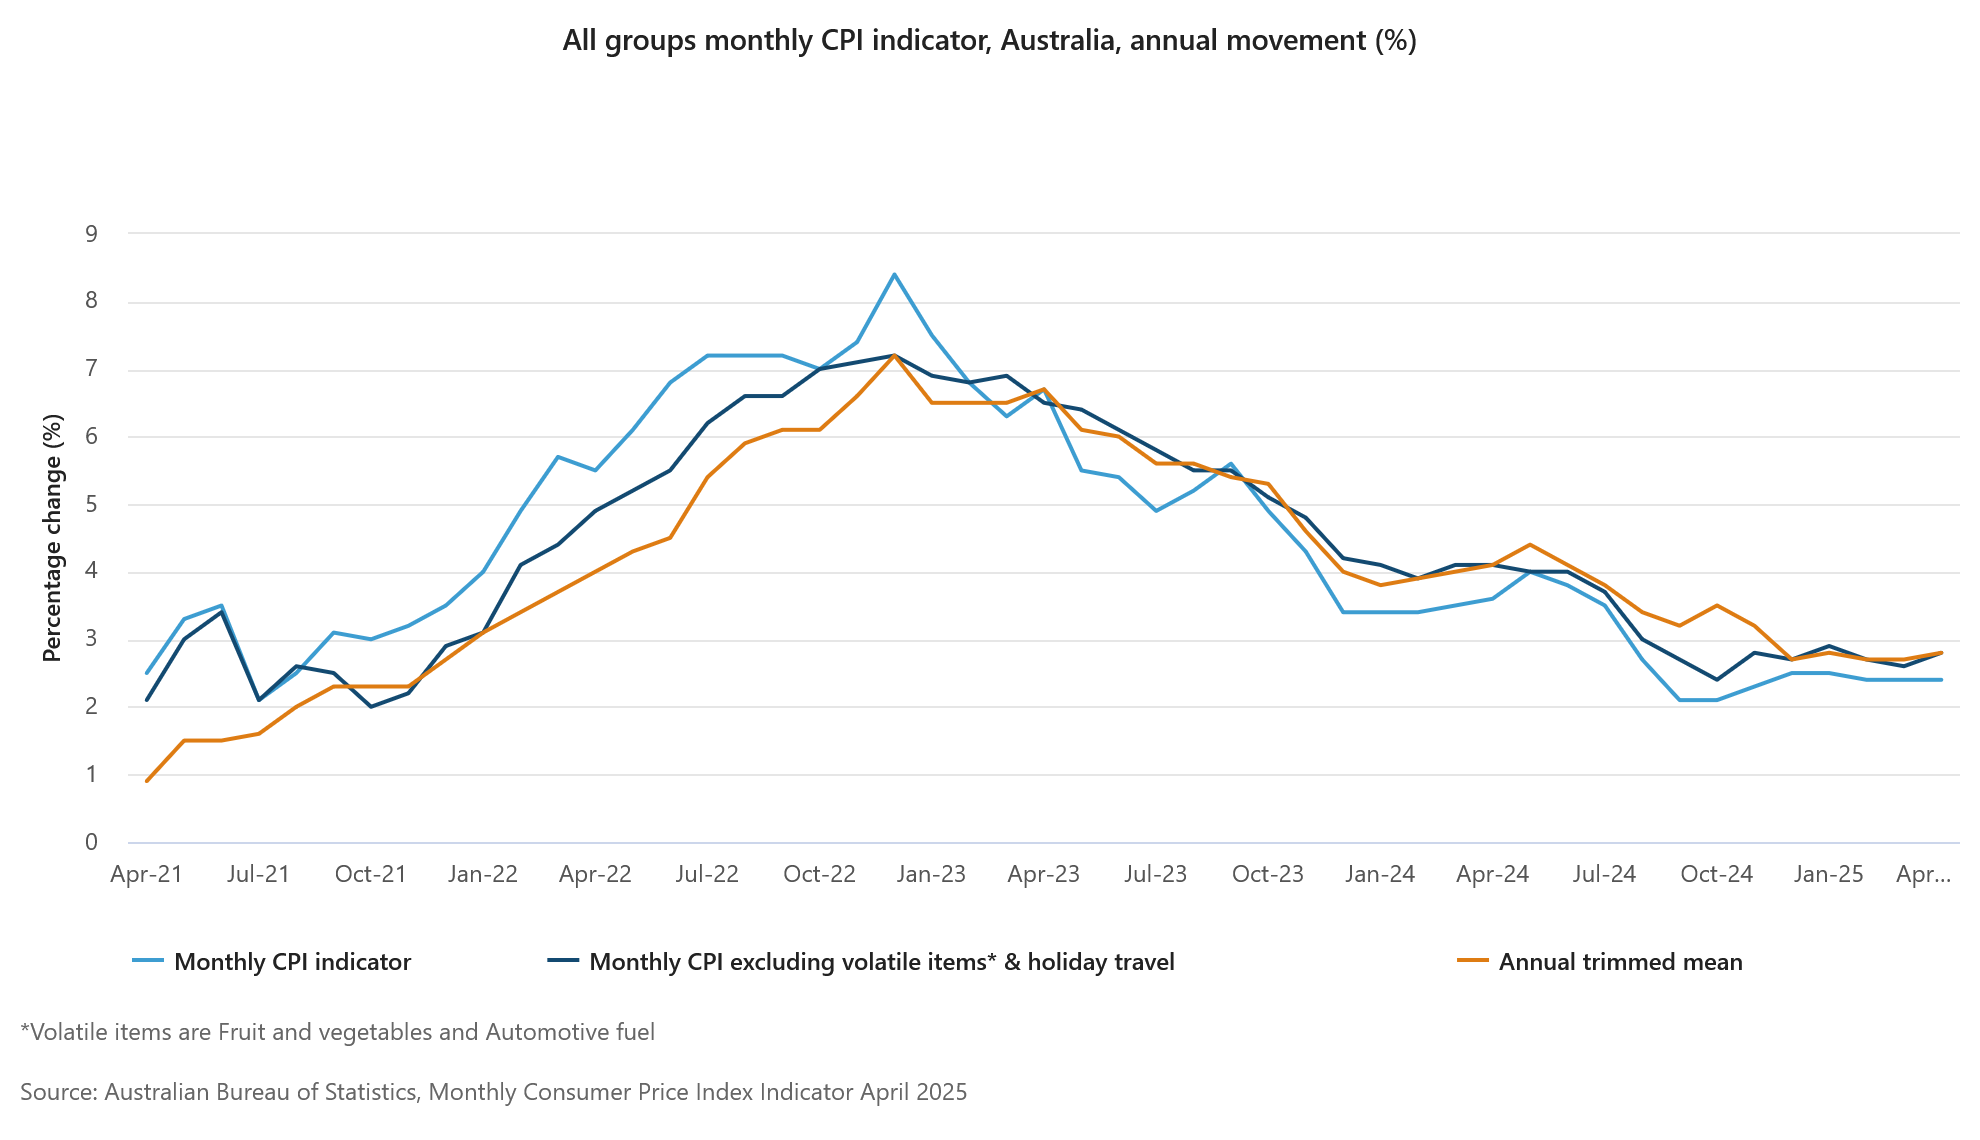
Australia’s monthly CPI unchanged 2.4%, core inflation edges higher
Australia’s monthly CPI held steady at 2.4% yoy in April, slightly above expectations of 2.3% yoy, marking the third consecutive month of unchanged headline inflation.
However, underlying inflation measures moved higher, with CPI excluding volatile items and holiday travel rising to 2.8% yoy from 2.6% yoy. Trimmed mean CPI also tickd up from 2.7% yoy to 2.8% yoy.
These developments suggest that while headline inflation appears stable, price pressures beneath the surface remain persistent.
Key contributors to the annual inflation rate included food and non-alcoholic beverages (+3.1%), recreation and culture (+3.6%), and housing (+2.2%).
BoJ’s Ueda highlights focus on short- and medium-term rates
BoJ Governor Kazuo Ueda told parliament today that shifts in short- and medium-term interest rates have a more pronounced impact on economic activity than movements in super-long yields.
He explained that corporate and household debt is more concentrated in those shorter maturities, making the economy more sensitive to changes in that segment of the yield curve.
However, Ueda also acknowledged the spillover effects of volatility in super-long bond yields, noting that sharp moves in that part of the curve can ripple through to shorter maturities and influence overall financial conditions.
"We'll carefully watch market developments and their impact on the economy, he emphasized.
Fed’s Williams stresses need for vigilance on inflation expectations
New York Fed President John Williams emphasized the importance of acting decisively to prevent inflation from becoming entrenched, warning that delayed responses risk making price pressures permanent.
Speaking at a conference in Tokyo, Williams noted, "you want to avoid inflation becoming highly persistent because that could become permanent".
"And the way to do that is to respond relatively strongly" when inflation begins to deviate from target.
He also highlighted the sensitivity of inflation expectations, cautioning that any significant shift could be "detrimental" to economic stability.
Key Technical Levels for EURUSD
The world’s most traded currency pair has seen significant volatility in the first half of 2025. After nearing parity early in the year—reaching lows around 1.0180— 4 months after, EUR/USD has since rebounded, returning to its historical average range from the 20th century, between 1.10 and 1.20.
The uptrend came to an abrupt halt on April 21, when EUR/USD peaked at 1.15730 before retreating to lows of 1.10650 by mid-May.
Next, we’ll dive into Intra-day timeframes to identify potential trading opportunities and key levels to watch.
EUR/USD Intra-Day Analysis
EUR/USD 4H Timeframe
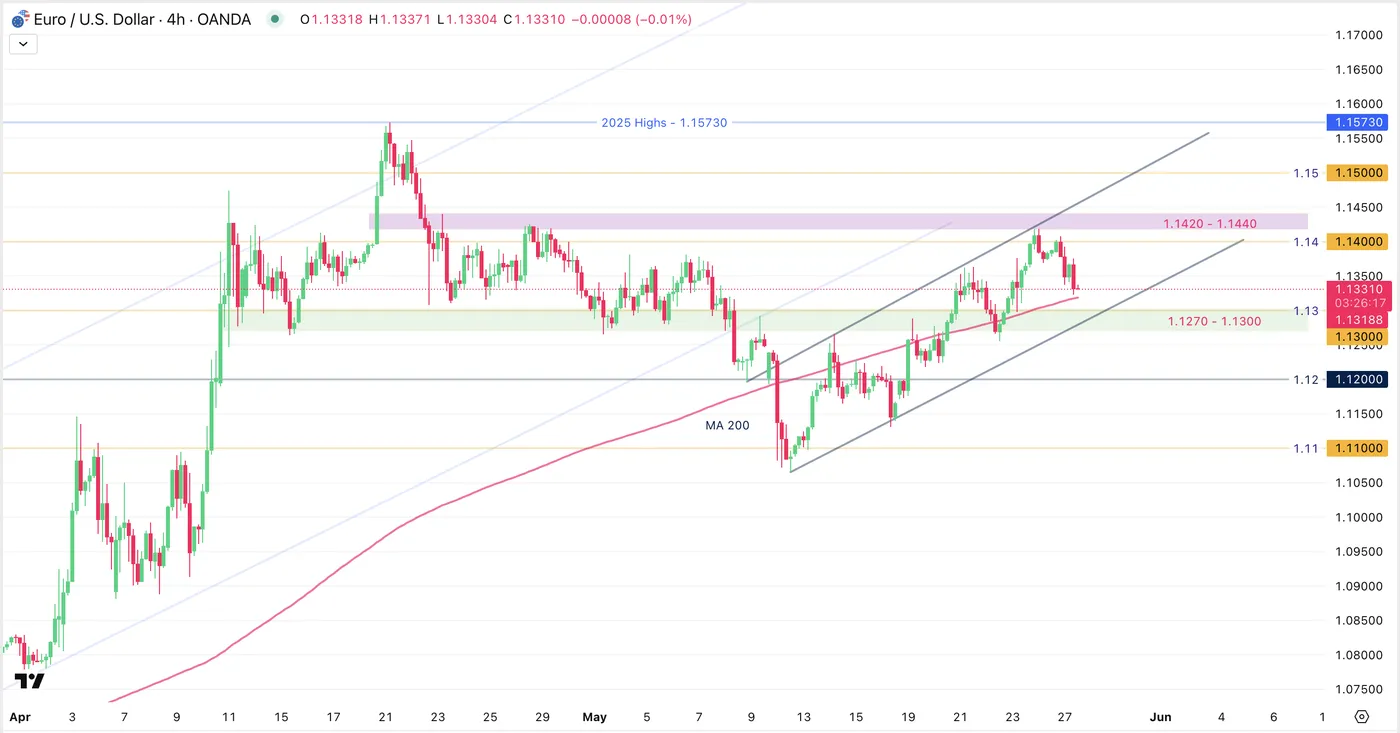
EUR/USD 4H Chart, May 27. Source: TradingView
EUR/USD bounced significantly in the past 2 weeks, up 2.40% from its May 13th lows.
The MA 200 on the 4H timeframe, sitting at 1.13200 is acting as immediate support.
Further support is standing in the 1.1270 - 1.1300 support zone which coincides with the bottom of the newly formed Upwards channel.
Prices rejected the 1.1420 - 1.1440 resistance Zone, as US dollar strength came back to begin the week.
EUR/USD 1H Timeframe
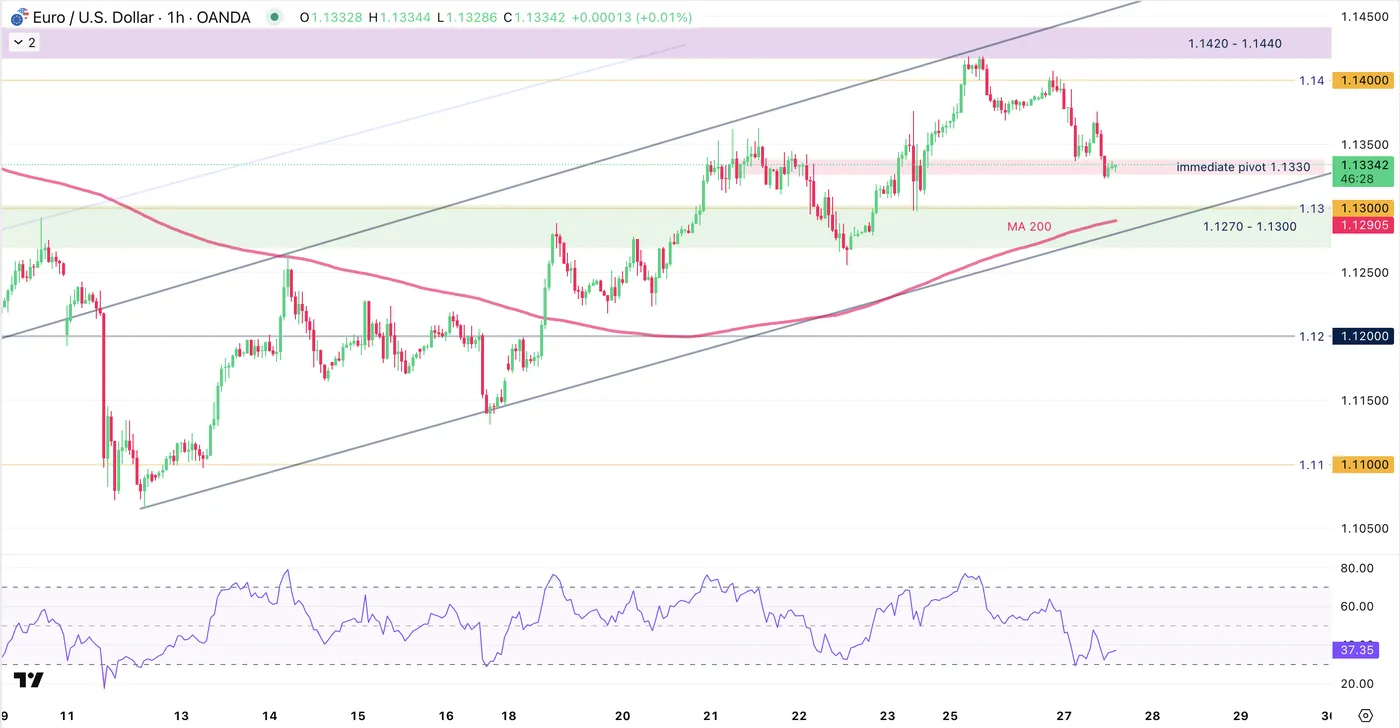
EUR/USD 1H Chart, May 27. Source: TradingView
The rejection at the top of the ascending channel hints at a return towards the 1H MA 200, currently at 1.1290, in a confluence with the channel lows and the support zone from higher timeframes.
The RSI is approaching oversold territory, but traders appear to be waiting for a clearer shift in momentum before taking action. The North American afternoon session has remained quiet so far, with most of the day’s movement unfolding during the overnight and early morning hours.
Prices are hanging around the immediate pivot standing at 1.1300.
Safe trades!
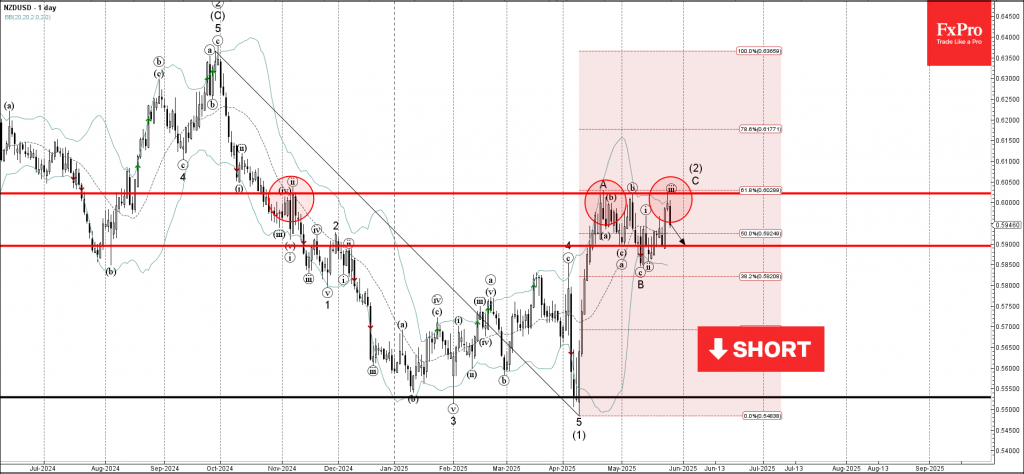
NZDUSD Wave Analysis
NZDUSD: ⬇️ Sell
- NZDUSD reversed from the pivotal resistance level 0.6020
- Likely to fall to support level 0.5900
NZDUSD currency pair recently reversed down from the pivotal resistance level 0.6020 (which has been reversing the price from November).
The downward reversal from the resistance level 0.6020 formed the daily Shooting Star – which stopped the C-wave of the previous ABC corrections (2).
NZDUSD currency pair can be expected to fall to the next support level 0.5900, which has been reversing the price since the middle of May.
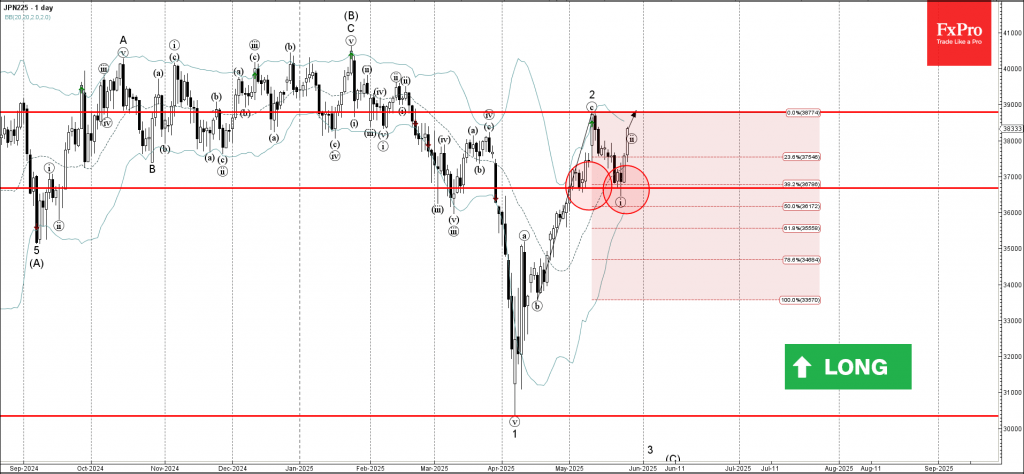
Nikkei 225 Wave Analysis
Nikkei 225: ⬆️ Buy
- Nikkei 225 reversed from support level 36675,00
- Likely to rise to resistance level 38800,00
Nikkei 225 index recently reversed up from the pivotal support level 36675,00 (which formed the daily Japanese candlesticks reversal pattern Morning Star at the start of May).
The support level 36675,00 strengthened by the 20-day moving average and by the 38.21% Fibonacci correction of the previous upward impulse from April.
Nikkei 225 index can be expected to rise to the next resistance level 38800,00, top of the previous minor correction 2.
Volatile USD/JPY Moves: What’s Driving the Action
Another day where markets hang on to a positive sentiment following a similar picture from yesterday - risk-assets are in the green and safe-havens are lagging on the day.
The US dollar as recently shines on optimist flows from markets, though as the DXY is still trading below the 100.00 level. The Greenback is leading today's forex action.
On the other hand, the Yen is not showing such a rosy picture. Comments from the Minister of Finance Katsunobu Kato about reducing the issuance on long-end bonds made Japanese yields go down and the Yen got dragged with it.
How do yields moving down influence the Yen?
For a quick-to-understand explanation, longer-end yields have been hedging up with the latest inflation data being high - a situation where bond traders start to sell some parts of the curve to price in chances of hikes around the curve and reduce their exposure.
Funds in Japan are big buyers of all types of government bonds to provide interest, so if there is less supply of bonds and fewer bonds to buy for these entities, the rarity creates more demand, and then yields go down again.
When Yields go down in Japan, investors make more money by placing money in other higher yielding assets like US Treasuries or Equities, hence the Yen goes down.
USD/JPY Intra-Day Technical Analysis
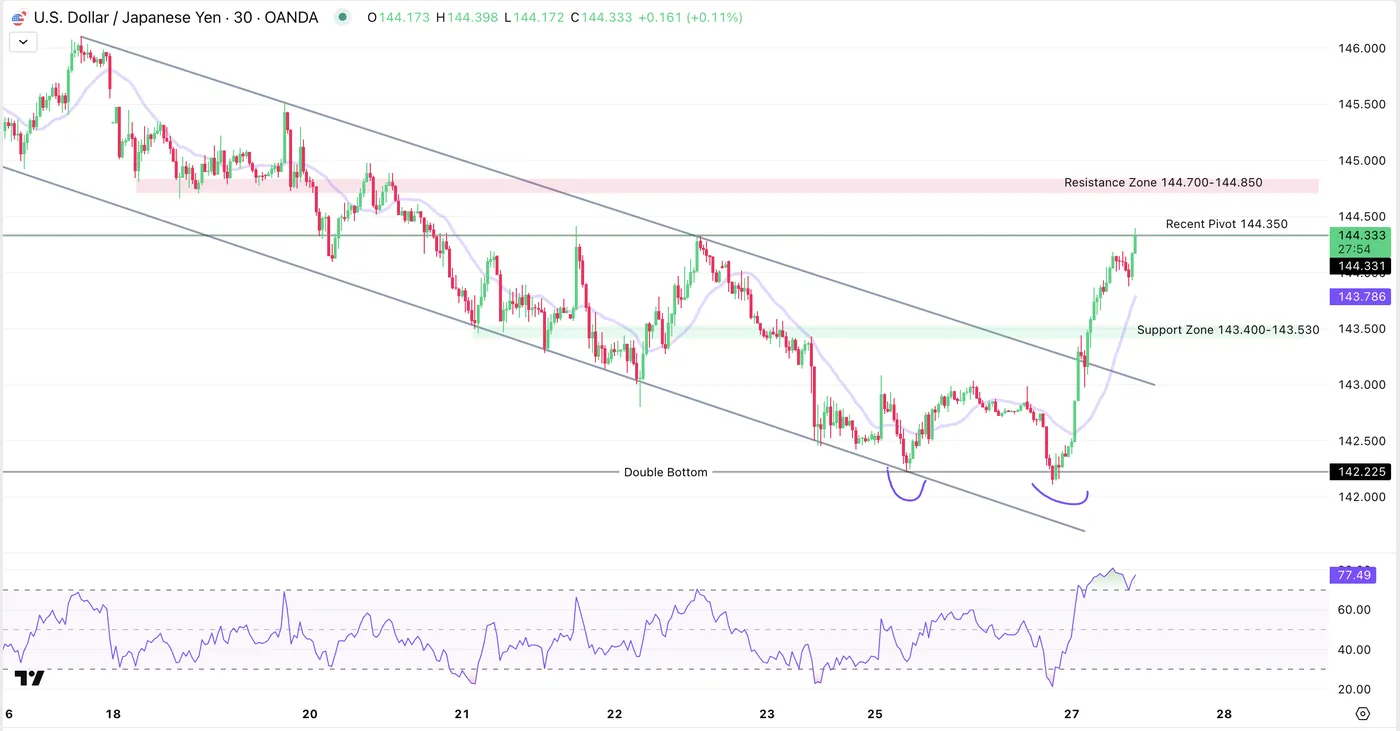
USDJPY 30M Chart, May 27, 2025. Source: TradingView
USD/JPY rallied on the recent comments from the Minister of Finance Kato, forming a double bottom - now up 1.11% on the session.
Last week's USD weakness created a descending channel from which prices broke out overnight. The RSI is overbought on all timeframes below 1H but the momentum is strong.
Having just crossed the last key pivot at 144.350, eyes are on these zones:
For immediate support, there is the MA 20 standing at 143.800.
A deeper retracement would retest the most recent Support Zone situated between 143.400 to 143.530.
Keep an high on a retest of the upper-bound of the descending channel, though prices are far and would require USD weakness to retrace that much - not the theme of the day.
For resistances on a pursued breakout, look at the Resistance Zone 144.700 - 144.850.
The next key resistance eyes to the 145.00 psychological level.
Safe Trades!
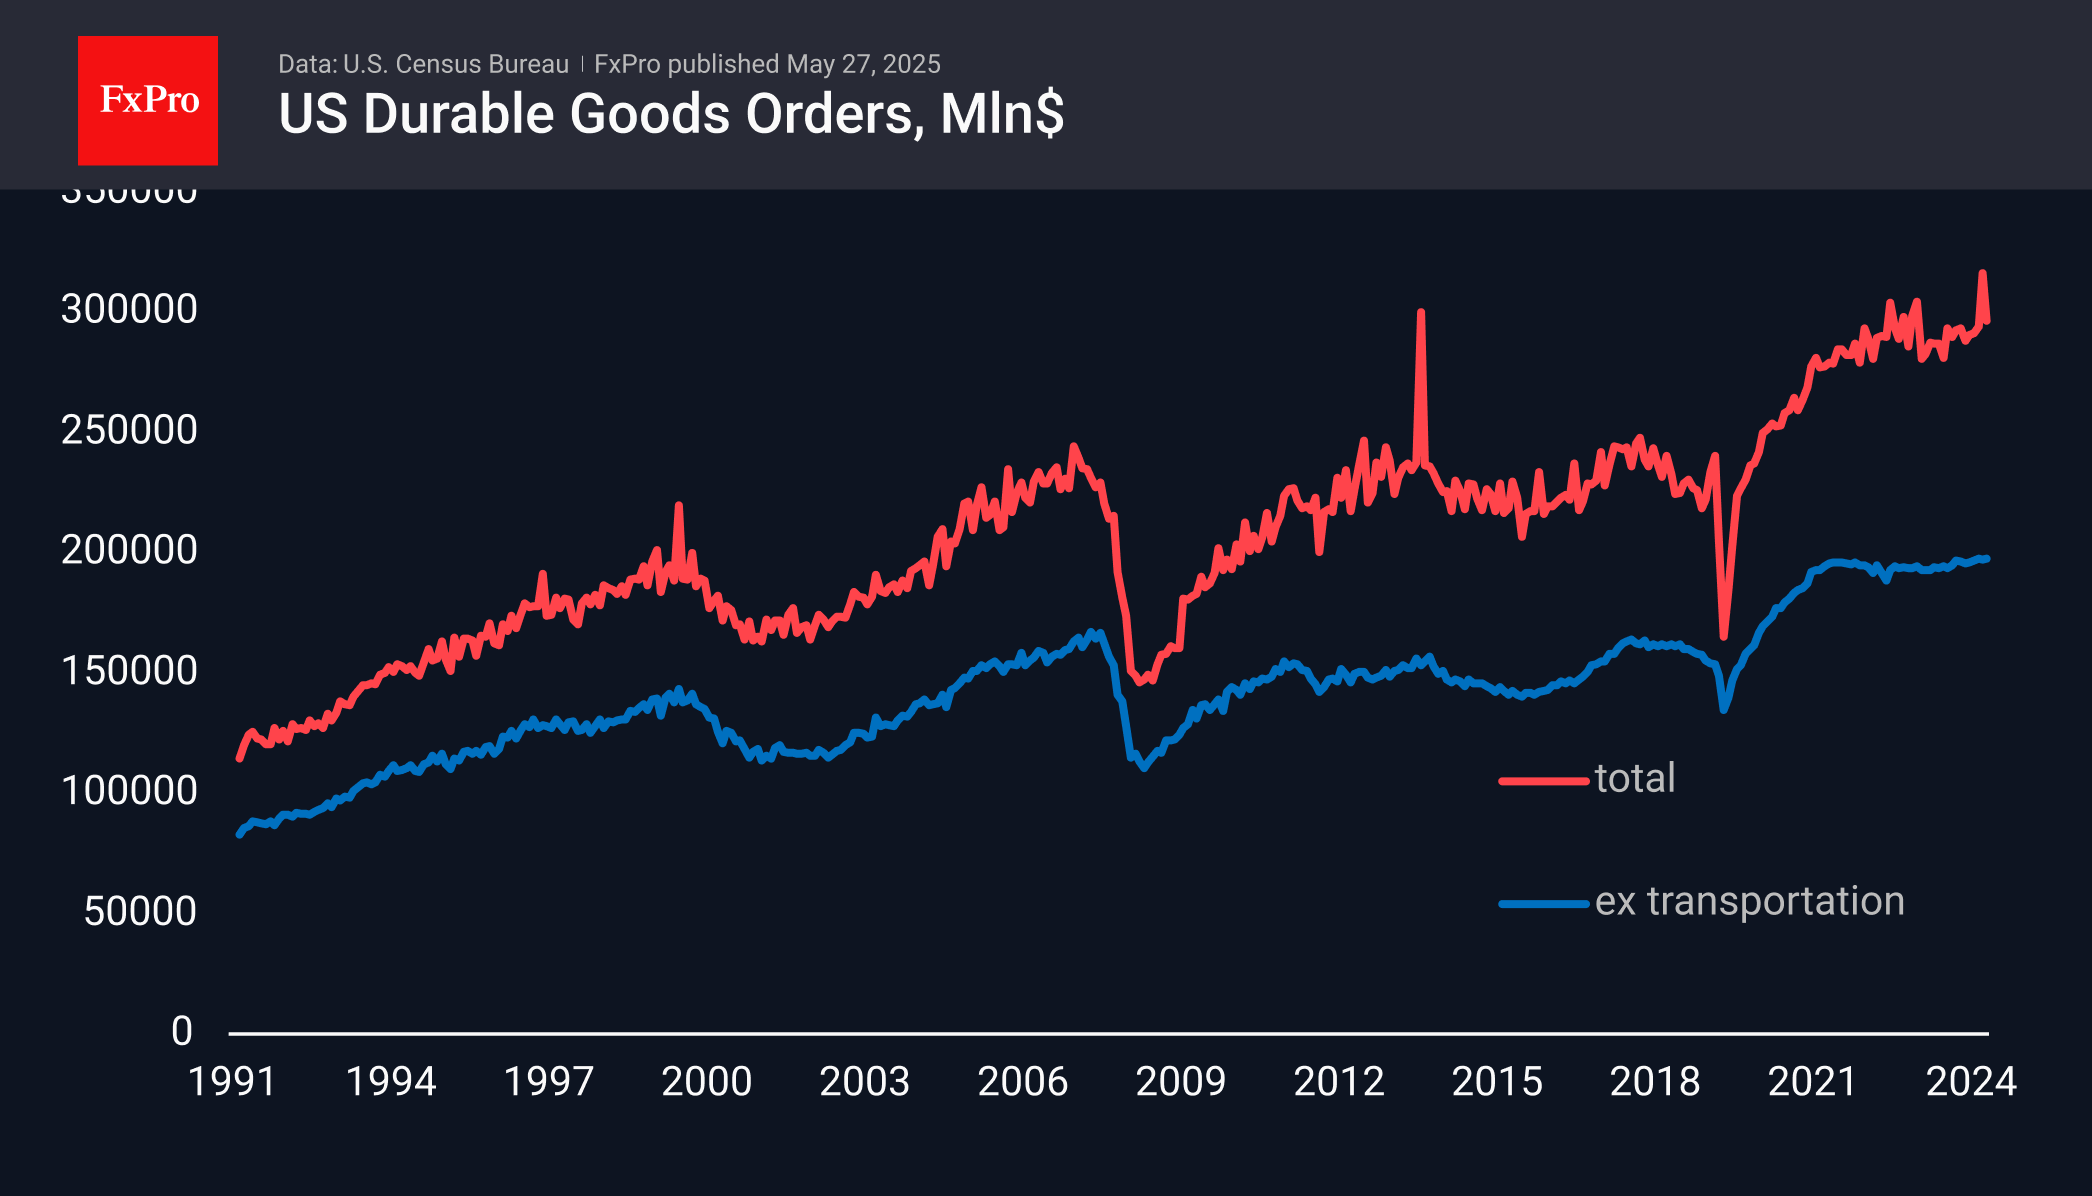
Three-Year Stagnation in US Durable Goods Orders
Preliminary estimates of durable goods orders in the US showed a less sharp than expected dip in April. The decline was 6.3% versus a 7.5% jump a month earlier and an expected 7.6% drop.
The volatility is almost entirely due to the transport sector, and without that component, there was a 0.2% gain for the month after a commensurate decline earlier. This indicator has been near a plateau for the past three years, adding only 1% in money over that time against a 12% rise in the Core CPI and a 9% rise in Core PPI. Simply put, America has been cutting investment in durable goods for about as long as the Fed has been shrinking its balance sheet.
In the short term, the current report is relatively positive for demand for US assets, including the dollar, coming in above expectations. However, in the medium term, it is worth paying attention to the decline in orders expressed in real prices. This may indicate a growing threat of stagnation, if not contraction, of the US economy, bringing the Fed rate cut closer.