Sample Category Title
Elliott Wave Outlook: FTSE to Signal Market Direction Soon
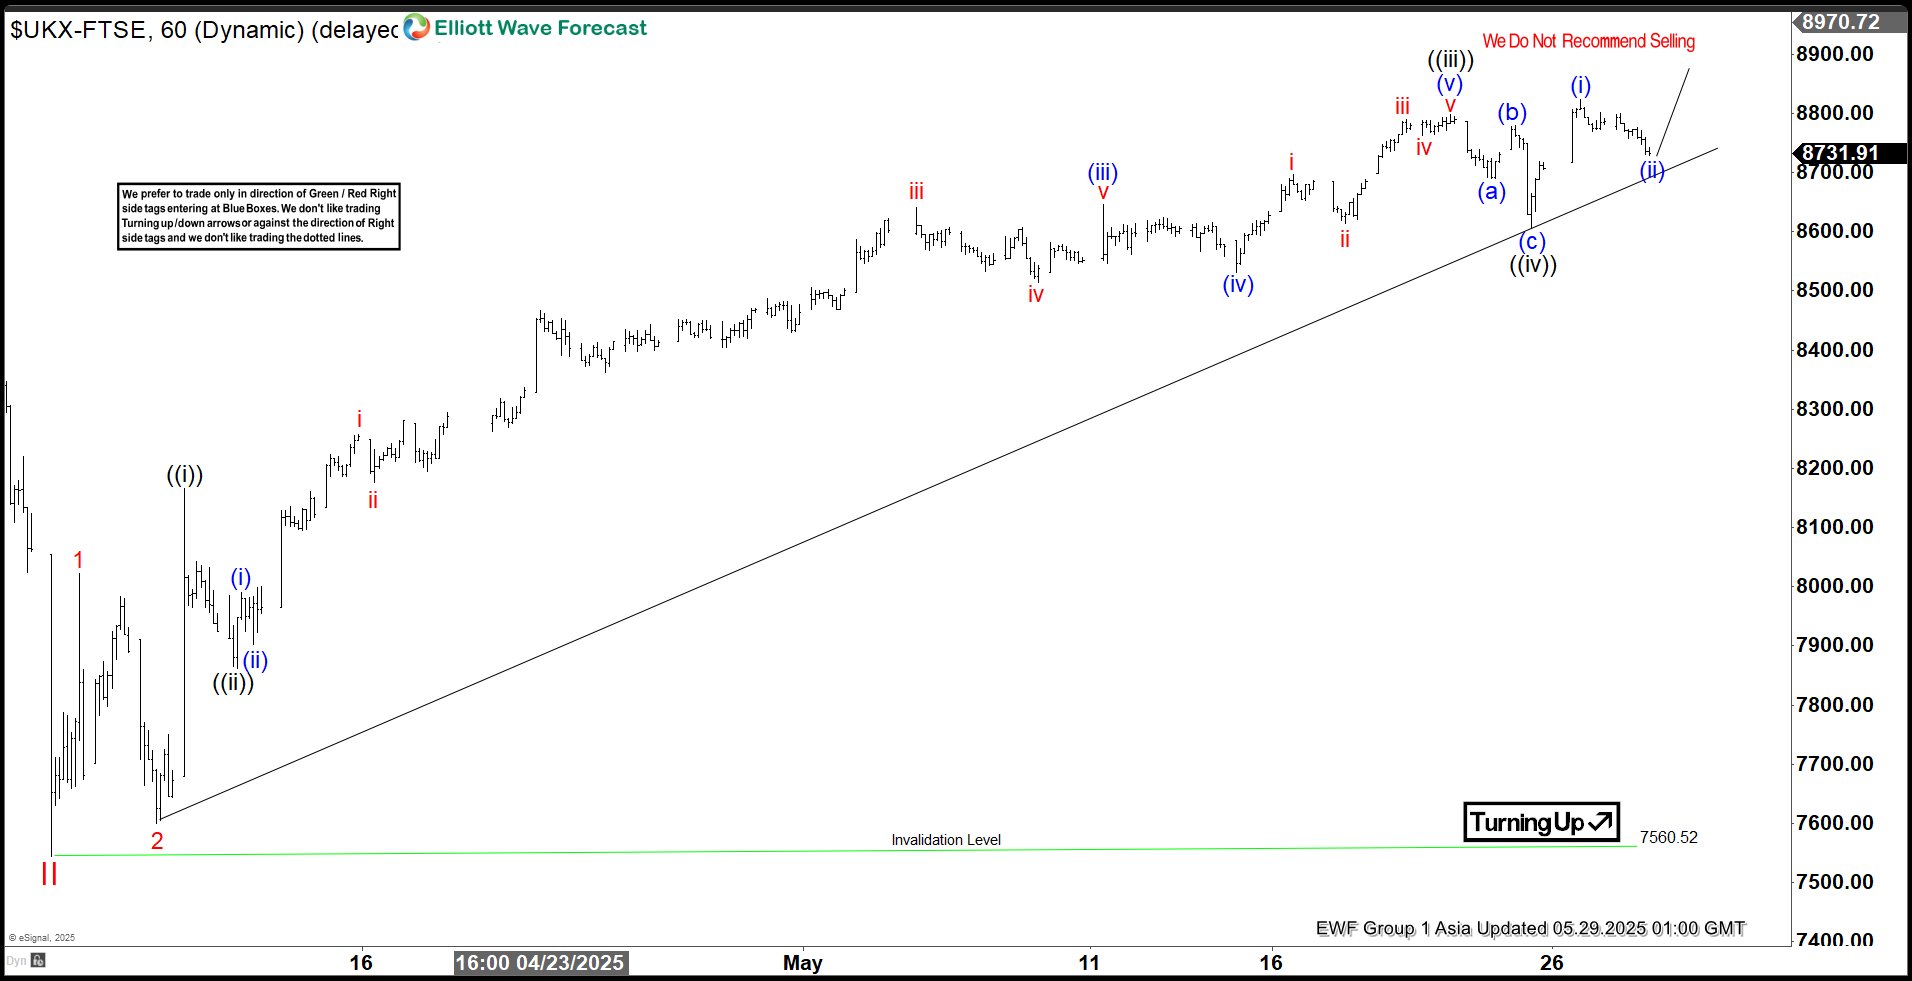
The short-term Elliott Wave outlook for FTSE indicates that wave II concluded at 7560.5. This marked the start of an upward movement in wave III. Wave III is unfolding as a five-wave impulse structure, characterized by a series of higher highs and higher lows. From the wave II low, wave 1 advanced to 8021.77, followed by a pullback in wave 2 to 7599.56. The Index then resumed its upward trajectory in wave 3, with its internal subdivisions further defining the bullish momentum.
Within wave 3, wave ((i)) peaked at 8166.53, followed by a corrective wave ((ii)) that found support at 7862.72. The subsequent rally in wave ((iii)) reached 8798.46, and a minor pullback in wave ((iv)) ended at 8604.8. The Index is now poised to continue its upward trend, likely completing the five-wave rally that began from the April 7 wave II low. Once this rally concludes, a larger corrective pullback is anticipated. The pullback is potentially unfolding in 3, 7, or 11 swings to correct the prior advance.
Currently, the Index is approaching a critical level, nearing a break above the previous wave I peak of 8908.82, recorded on March 4, 2025. A decisive move above this level would confirm that wave II is firmly in place, ruling out the possibility of a double correction. Such a breakout would provide strong confirmation of the bullish market direction, signaling continued upward momentum in the near term.
FTSE 60-Minute Elliott Wave Technical Chart
FTSE Elliott Wave Technical Video
https://www.youtube.com/watch?v=ndwHI4ZxzYY
GBP/USD Forecast: Sterling Retraces from 3-Year Highs Versus Dollar
Currently trading at around ~1.34650, GBP/USD trades 0.32% lower in today’s session. Easing from multi-year highs made last week, cable continues to benefit from robust economic data and underlying dollar weakness.
GBP/USD: Key takeaways from today's trading
- Seeing convincing buying pressure in Friday’s session, GBP/USD recently rallied to highs of 1.35934, a level last seen in early 2022
- Recently easing from highs, markets now look to reassess rate-cut bets from the Federal Reserve and Bank of England, with BoE Governor Andrew Bailey expected to speak tomorrow
GBP/USD gains on US trade-tariff uncertainty
With Donald Trump renewing threats of US-EU tariffs over the weekend, continued uncertainty surrounding the US economy and future trade relations continues to weigh negatively on the dollar.
First threatening a 50% tariff on EU imports to be imposed June 1st, only to renege days later, frustrations in ongoing negotiations between the US and the European Union regarding trade further general ‘risk-off’ sentiment, and a general cautiousness on world equity markets.
The obvious comparison is that, unlike the United Kingdom, the United States has been unable to strike a deal with the European Union, with Trump taking a seemingly less diplomatic approach to negotiations.
While a list of trade negotiation deadlines loom, dollar upside is likely to be limited until the picture on global trade becomes clearer and, most importantly, more certain.
Better-than-expected retail sales extend GBP/USD gains
With last Friday representing cable’s best performance in over three weeks, gaining 0.89%, an unexpected rise in reported retail sales data helped boost cable pricing to three-year highs.
Beating expectations by some margin, Friday’s data showed retail sales data rising for the fourth consecutive month, suggesting increasing consumer confidence and somewhat vindicating the current Bank of England strategy on monetary policy.
The result has been a remarkable rise in sterling value versus the dollar.
US market holiday shines light on anti-dollar sentiment
With the US observing Memorial Day on Monday, lower-than-usual trading volumes did not deter GBP/USD from making further gains, ending the day 0.18% higher.
In a vacuum, this would suggest that the recent rise in GBP/USD pricing is not dependent on active US market participation, indicating that capital flows outside the US are at least somewhat influencing price action.
Markets eye Thursday speech for cues on BoE monetary policy
With this trading week noticeably sparse for UK-facing economic events, GBP/USD traders will closely monitor Bank of England commentary, which may suggest their likely next move.
While recent rises in retail sales would otherwise encourage the Bank of England to become more dovish, inflation in the United Kingdom remains uncomfortably high at 3.5% year-over-year in April.
Writing ahead of BoE Governor Bailey’s speech tomorrow, most predict rates will remain unchanged in the upcoming June decision.
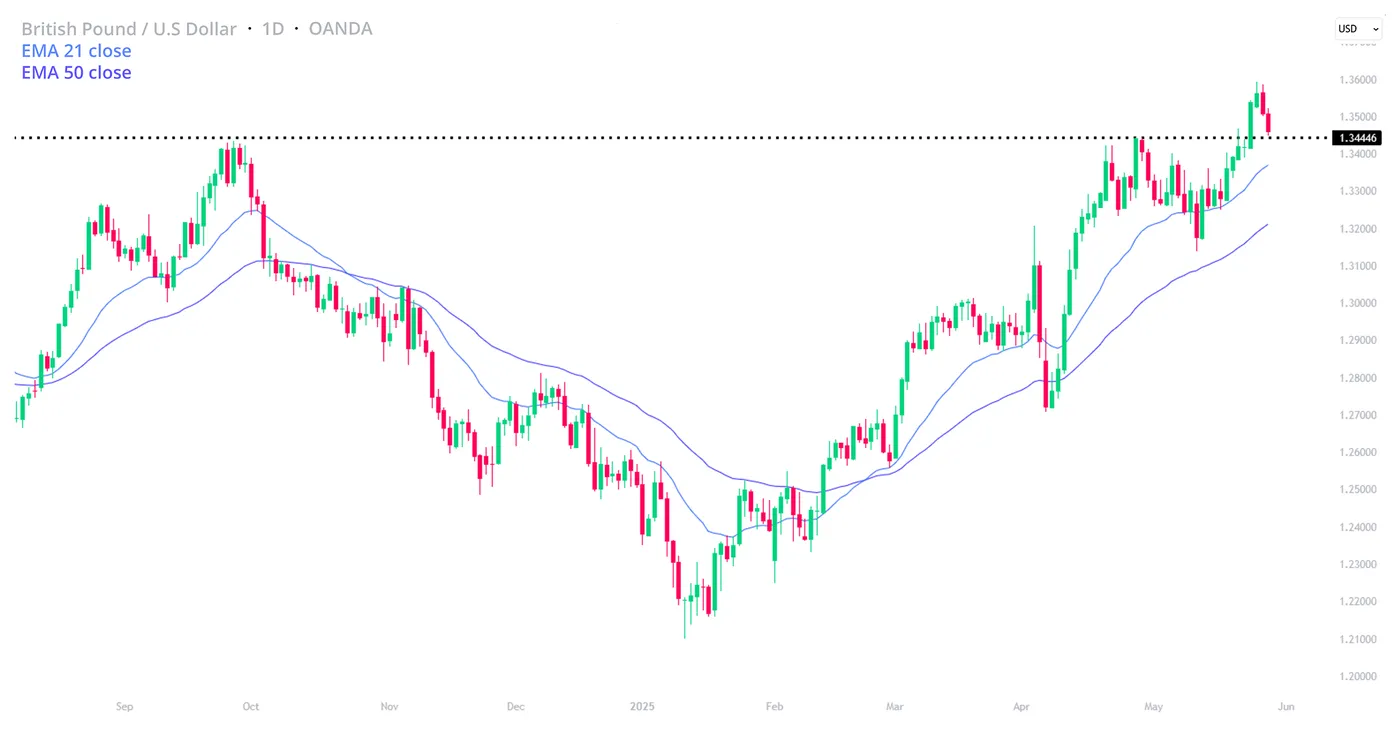
A chart showing the recent price action of GBPUSD. OANDA,TradingView, 28/05/2024
GBP/USD technical analysis
- In line with Fibonacci retracements, we can expect GBP/USD to find some support at the current price. If price can stage a move upwards, bulls will likely target 1.36405, then 1.36798.
What to Take from the May 2025 FOMC Minutes
Powell laid out in his post-meeting press conference and what has already been echoed in recent speeches by other Fed officials. Persistent uncertainty around trade policy, risks to both sides of the Fed’s dual mandate (employment and inflation), and the ongoing debate about which side presents the greater medium-term risk are keeping the FOMC in wait-and-see mode.
So far, nothing in the incoming data through early May appears to have shifted the Fed’s stance or prompted a lean toward any specific policy path. Participants agreed that with growth and the labor market remaining solid, and policy already moderately restrictive, the Fed is well positioned to stay patient. The minutes note that heightened uncertainty warrants a cautious approach until the full economic effects of recent government policy changes become clearer.
A reminder on what the FED is waiting to cut
Those hoping for more concrete guidance will find little in these minutes. The Committee reiterated that future decisions would be guided by a broad set of data, the economic outlook, and the balance of risks. New York Fed President John Williams recently stated that clarity on the impact of tariffs likely won’t emerge until the June or July meetings, while Cleveland FED's Hammack and Atlanta’s Bostic (both non-voting members this year) suggested it could take until late summer or even three to six months to gather enough information.
For now, the Fed is keeping its options wide open. It is expected that to that we get 25bp rate cut in September, as labor market softness is expected to outweigh residual inflation concerns by then. While uncertainty around policy shifts clouds the forecast, we believe the current market pricing—reflecting only about a 45% chance of a cut by September—is underestimating the likelihood of easing.
DXY Intra-Day Chart
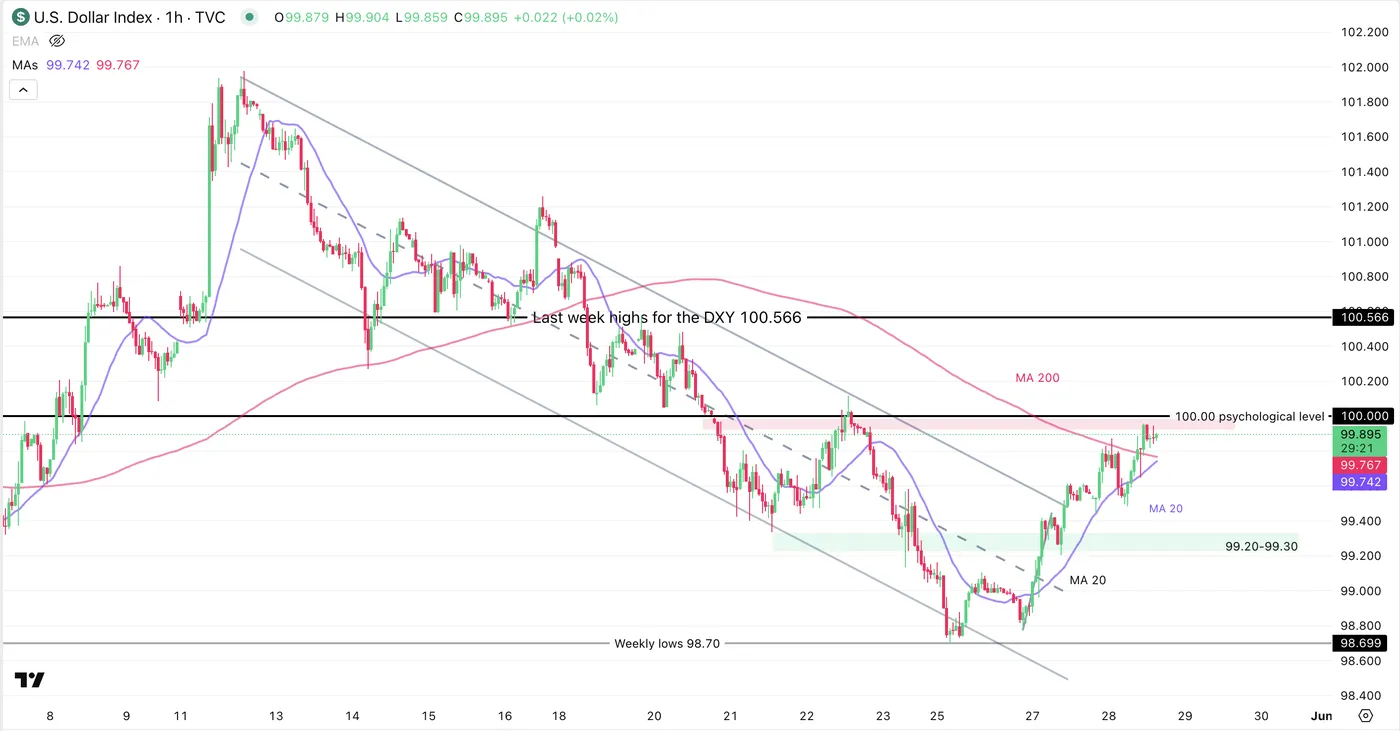
DXY 1H Chart, 28 May. Source: TradingView
The FOMC Minutes did not add much to the volatility as the DXY is consolidating just below the 100.00 Psychological Level.
Both the MA 20 and 200 are acting as support.
It is notable that the DXY broke out of the past week's descending channel.
Safe Trades!
Minutes Show Fed in No Rush to Cut Rates Amid Heightened Policy Uncertainty
The Federal Open Market Committee (FOMC) held the policy rate steady in the target range of 4.25-4.5% at its May 6-7th meeting. Unsurprisingly, the minutes from that meeting revealed a growing uncertainty among participants on the economic outlook, as this was the first FOMC deliberation following President Trump's reciprocal tariff announcement on April 2nd.
A key focal point of the discussion centered around heightened trade and economic policy uncertainty, with Committee members judging the "uncertainty around the projection as elevated relative to the average over the past 20 years".
The staff projection in May – not to be confused with the Summary of Economic Projections – for real GDP growth in 2025 and 2026 was weaker than what was presented at the March meeting. The labor market was also expected to "weaken substantially, with the unemployment rate forecast moving above the staff's estimate of its natural rate by year-end and remaining there through 2027". The outlook for inflation was also revised higher in light of the announced trade policies.
On the current labor market situation, participants continued to judge conditions as "broadly balanced". However, several participants referenced business surveys or their contacts reporting limiting or pausing hiring because of elevated uncertainty. Some participants acknowledged the risk that the labor market could weaken over the coming months but noted that the outlook ultimately hinges on the evolution of trade and other government policy.
Regarding inflation, participants acknowledged that recent progress has been uneven and noted that the uptick in short-term survey and market-based measures of inflation expectations following a period of higher inflation could make firms more willing to increase prices. Some participants also noted that supply chain disruptions caused by tariffs could have persistent effects on inflation, as they did during the pandemic.
The vote to hold rates steady was unanimous. Participants assessed that the Committee was well positioned to wait for more clarity on the policy front as it maintained still restrictive monetary policy against a backdrop of still solid domestic growth and a healthy labor market.
Key Implications
The minutes underscored the heightened economic uncertainty policymakers were facing during their last interest rate decision. While trade tensions have generally eased since that meeting, there remains considerable uncertainty on how the new administration's tariff and other policy changes will ultimately ripple through the economy. We remain of the view that today's still elevated tariff levels will lead to some softening in domestic spending and upward pressure on inflation through the second half of this year.
That said, the economy has so far held up better than expected. The labor market has shown no signs of buckling, consumer spending has remained largely resilient, and equity markets have more than recovered from April's selloff. With policymakers characterizing today's policy stance as "well positioned" and only "moderately restrictive", the FOMC continues to show little desire to adjust its policy rate until the economic data compels them to do so.
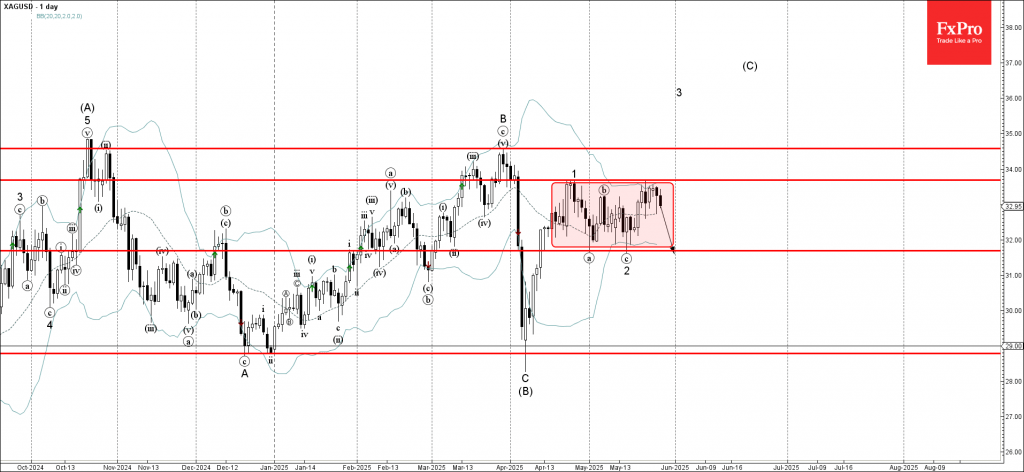
Silver Wave Analysis
Silver: ⬇️ Sell
- Silver reversed from resistance level 33.70
- Likely to fall to support level 31.70
Silver recently reversed from the resistance level 33.70 (which is the upper border of the sideways price range inside which the price has been trading from April).
The resistance area near the resistance level 33.70 was strengthened by the upper daily Bollinger Band.
Silver can be expected to fall to the next support level 31.70 (lower border of the active sideways price, which reversed the previous waves a and 2).
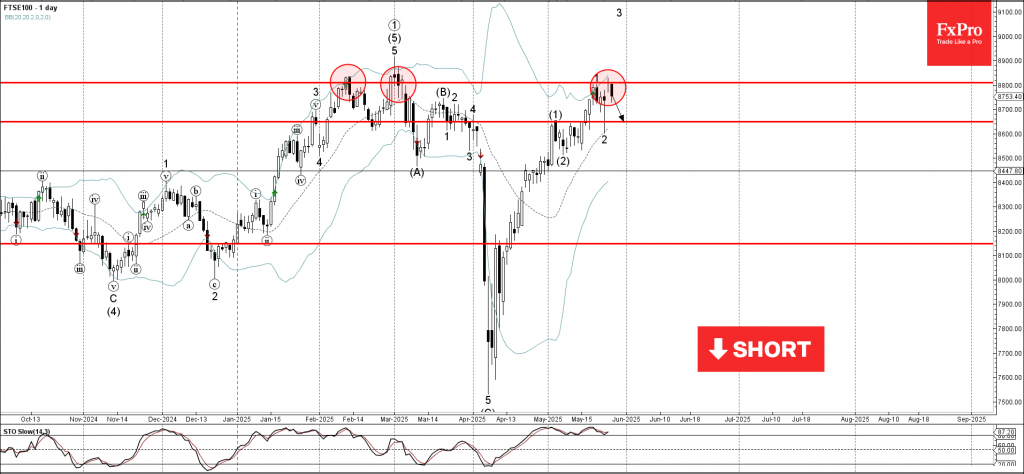
FTSE 100 Wave Analysis
FTSE 100 index: ⬇️ Sell
- FTSE 100 index reversed from key resistance level 8800.00
- Likely to fall to support level 8650,00
The FTSE 100 index recently reversed from the key resistance level 8800.00 (which has been steadily reversing the index from the start of February).
The resistance area near the resistance level 8800.00 was strengthened by the upper daily Bollinger Band.
Given the overbought daily Stochastic, FTSE 100 index can be expected to fall to the next support level 8650,00 (former top of wave (1) from the start of May).
Sunset Market Commentary
Markets
After a bullish correction yesterday, bond investors at the long end of the curve kept their cool today as well. A closely watched Japanese 40-y bond auction again met with mediocre demand, but the collateral damage on the broader market was limited. After jumping higher immediately after the sale, the Japanese 40-y yield closed at 3.36% (+3.3 bps) but remains well off last week’s top near 3.70%. The focus toward the performance of the long end of the curve (and debate on fiscal sustainability) is here to stay, but last week’s tentative ‘panic’ has subsided for now. It’s a calm day for now also on European bond markets. German yields add 1- 2 bps across the curve. Inflation expectations at the ECB April consumer survey for the next 12 months rose to 3.1% from 2.9%, despite a softening in the actual measure over the previous months (2.2% EMU HICP in April, new flash reading Tuesday next week). However, markets clearly don’t see this as a reason for the ECB to backtrack on an further ‘pre-emptive’ 25 bps cut next week. With the ECB moving further into neutral territory, we are keen to see whether an uncertain (inflation) outlook also causes the ECB to shift from a proactive to a more reactive approach, as did many other central banks. Except for the Richmond Fed and Dallas Fed confidence measures, which usually are no market movers, US markets later today look out for the Minutes of the Fed’s May policy meeting, a $70bn 5-y Treasury action and Nvidia earnings. US bonds after yesterday’s rally are rising about 2 bps across the curve (2-y benchmark change). NY Fed President Williams overnight warned that policy makers should not only aim to anchor long tern consumer inflation expectations, but the whole curve to avoid that ‘highly persistent’ inflation can become ‘permanent’. On equity markets, European indices fail to build on yesterday’s strong WS close (Eurostoxx 50 -0.4%). Nvidia results after the close might decide whether there is a case to revisit the top levels reached in February. After a reversal/rebound yesterday, the dollar remains better bid as high profile negative drivers for the US currency (trade war, debt sustainability) temporary move to the background.. DXY rises from 99.53 to 99.55. USD/JPY gains modestly (144.9). EUR/USD eased from 1.133 to trade near 1.1300. Sterling fails to extend a solid performance of late. EUR/GBP still struggles to sustainably break below the 0.84 handle.
News & Views
European consumer inflation expectations for the year ahead rose for a second month straight in April. The ECB’s consumer expectations survey showed the gauge quickening from 2.9% to 3.1%, the highest since February 2024. It’s the first time since July 2021 that inflation seen for the upcoming year was not lower than the perceived one over the last 12 months (3.1%). It’s a sign (and therefore warning signal to the ECB) of households no longer assuming disinflation. Expectations for three years ahead remained unchanged at 2.5%, similarly matching the numbers seen early last year. The longest-term measure (5 year) for a fifth time straight came in at 2.1%. European households expect nominal spending growth of 3.7% in the coming year, up from the 3.4% in March, but anticipate their income to grow slightly slower (0.9% from 1%). Economic growth expectations for the next 12 months became more negative, falling to -1.9% in April from -1.2% in March but consumers remain fairly optimistic on the labour market. They see an only slightly higher unemployment rate compared to the recent past. They are more bullish on the housing market, believing their home prices will rise 3.2%, up from 3.1% in March. Access to credit is expected to become more difficult: the net percentage assuming a tightening rose from 15.5% to 20.8%.
Belgian inflation fell 0.16% m/m to 2.01% y/y in May. That’s down from 2.55% in April and the fourth y/y decline in a row. Core inflation (ex. unprocessed food and energy products) slowed from 2.82% to 2.59% and services CPI eased from 3.96% to 3.65%. The most significant price increases in May were registered for, amongst others, meat, private rents, hotel rooms and mobile telephone services. The top three decliners were natural gas (-6.2% m/m), electricity (-4% m/m) & plane tickets. Motor fuels fell 0.5% m/m. Inflation according to the European harmonized method (HICP) amounts to 2.8%.
EUR/USD Mid-Day Outlook
Daily Pivots: (S1) 1.1299; (P) 1.1353; (R1) 1.1382; More...
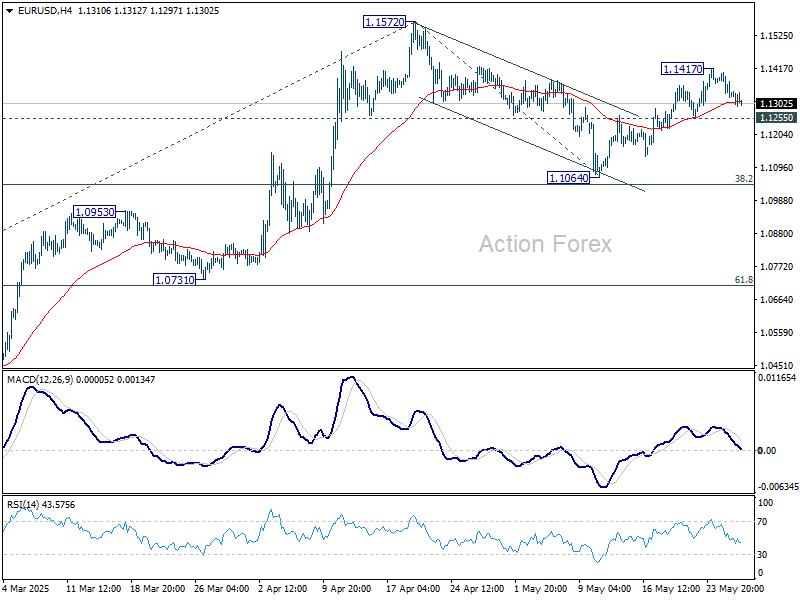
Intraday bias in EUR/USD stays neutral at this point, and further rise is still in favor as long as 1.1255 support holds. Above 1.1417 will bring retest of 1.1572 high first. Decisive break there will resume larger up trend to 61.8% projection of 1.0176 to 1.1572 from 1.1064 at 1.1927. On the downside, however, break of 1.1255 will turn bias back to the downside to extend the corrective pattern from 1.1572 with another falling leg.
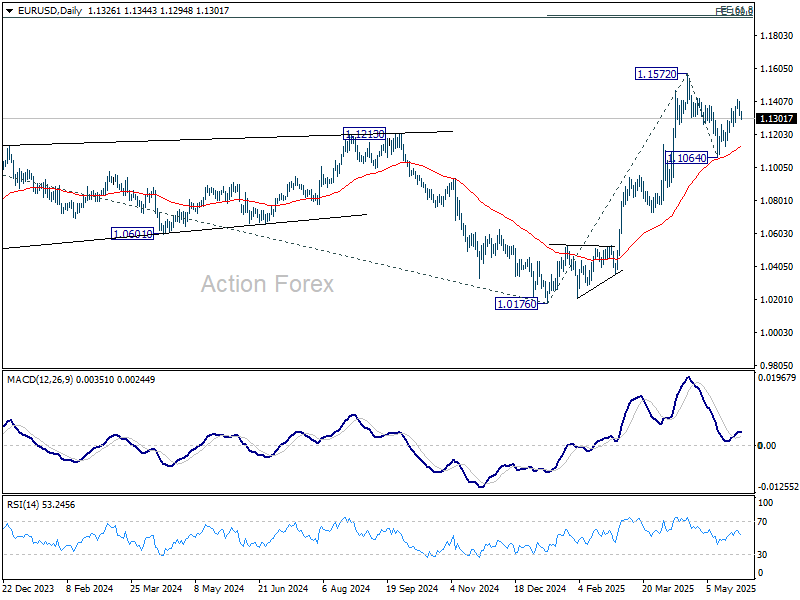
In the bigger picture, rise from 0.9534 long term bottom could be correcting the multi-decade downtrend or the start of a long term up trend. In either case, further rise should be seen to 100% projection of 0.9534 to 1.1274 from 1.0176 at 1.1916. This will now remain the favored case as long as 55 W EMA (now at 1.0858) holds.
GBP/USD Mid-Day Outlook
Daily Pivots: (S1) 1.3476; (P) 1.3531; (R1) 1.3563; More...
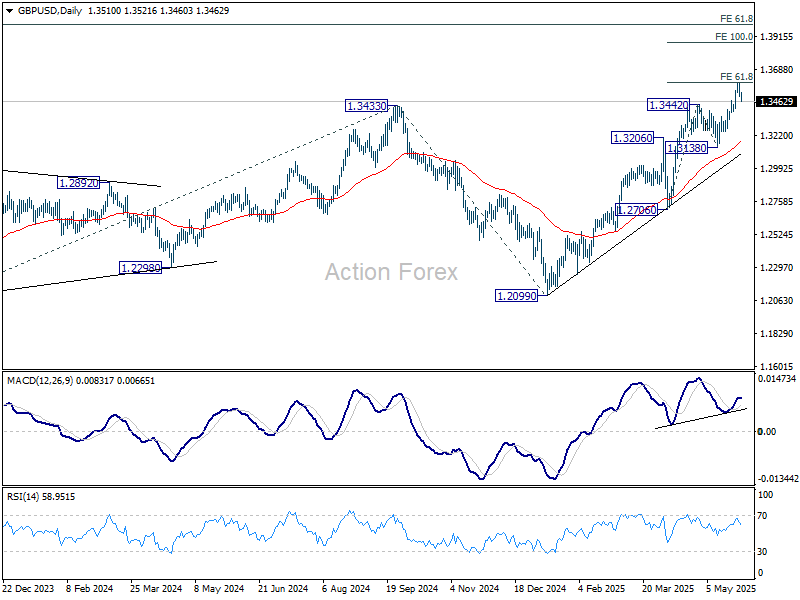
Intraday bias in GBP/USD remains neutral for consolidations below 1.3592. Further rise is expected as long as 1.3389 minor support holds. On the upside, firm break of 1.3592 will resume larger rally for 100% projection of 1.2706 to 1.3442 from 1.3138 at 1.3874. However, decisive break of 1.3389 will confirm short term topping, and turn bias back to the downside for 1.3138 support instead.
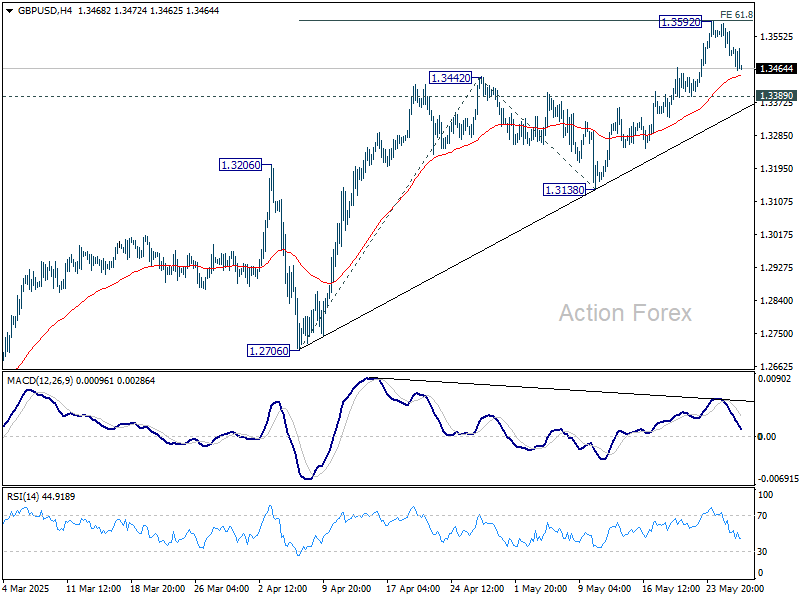
In the bigger picture, up trend from 1.3051 (2022 low) is in progress. Next medium term target is 61.8% projection of 1.0351 to 1.3433 from 1.2099 at 1.4004. Outlook will now stay bullish as long as 55 W EMA (now at 1.2870) holds, even in case of deep pullback.