
Sample Category Title
USD/CHF Mid-Day Outlook
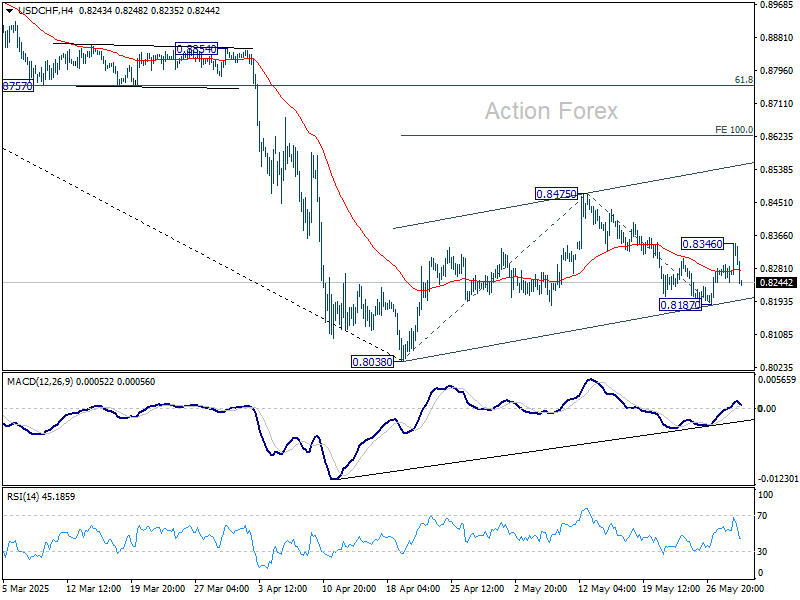
Daily Pivots: (S1) 0.8247; (P) 0.8269; (R1) 0.8293; More….
Intraday bias in USD/CHF is turned neutral first with current retreat. On the upside, above 0.8346 will target 0.8475 resistance. Firm break there will target 100% projection of 0.8038 to 0.8475 from 0.8187 at 0.8624. However, below 0.8187 will bring retest of 0.8038 low instead.
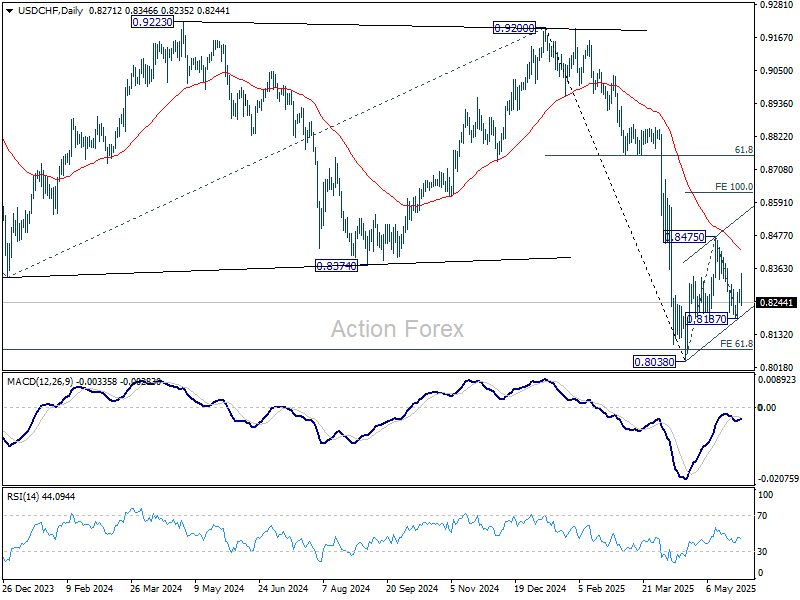
In the bigger picture, long term down trend from 1.0342 (2017 high) is still in progress and met 61.8% projection of 1.0146 (2022 high) to 0.8332 from 0.9200 at 0.8079 already. In any case, outlook will stay bearish as long as 55 W EMA (now at 0.8713) holds. Sustained break of 0.8079 will target 100% projection at 0.7382.
USD/JPY Mid-Day Outlook
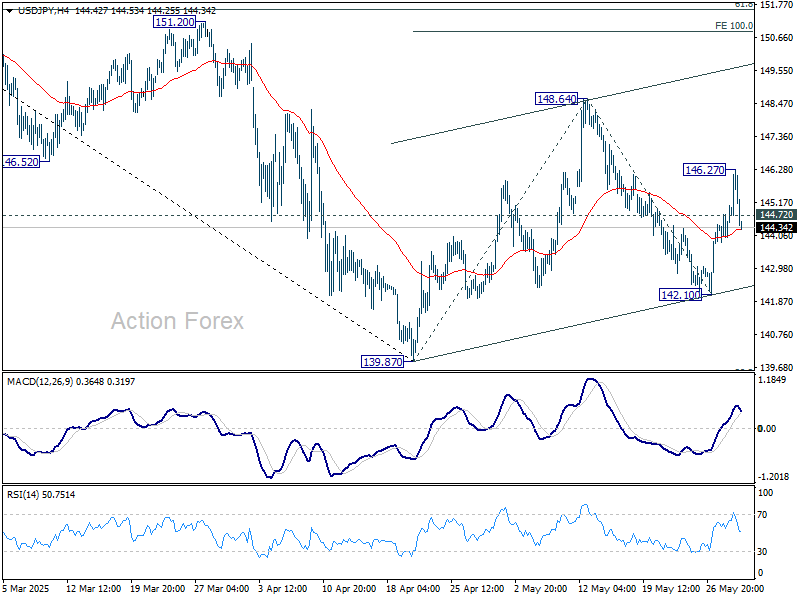
Daily Pivots: (S1) 144.12; (P) 144.60; (R1) 145.35; More...
Intraday bias in USD/JPY is turned neutral with current retreat. On the upside above 146.27 will target 148.64 resistance first. Firm break there will resume the rebound from 139.87 to 100% projection of 139.87 to 148.64 from 142.10 at 150.87. Nevertheless, break of 142.10 will bring deeper fall back to 139.87 low.
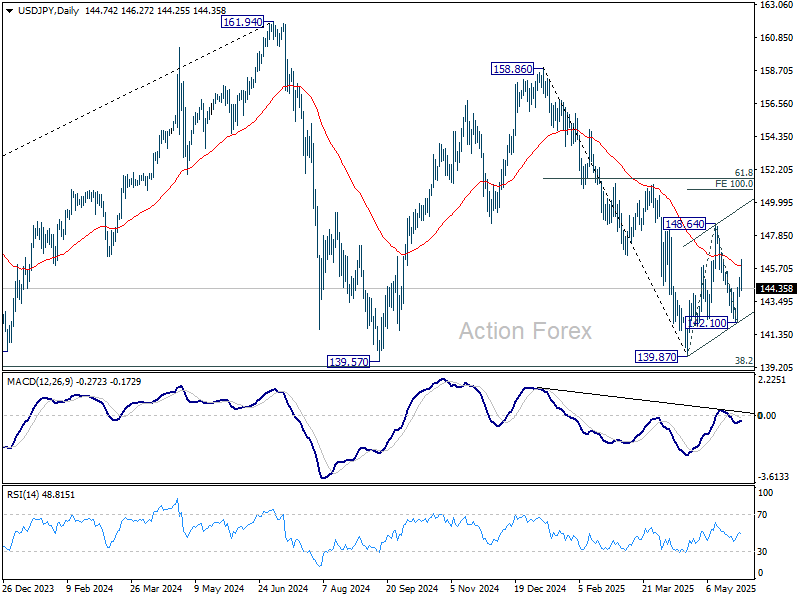
In the bigger picture, price actions from 161.94 are seen as a corrective pattern to rise from 102.58 (2021 low), with fall from 158.86 as the third leg. Strong support should be seen from 38.2% retracement of 102.58 to 161.94 at 139.26 to bring rebound. However, sustained break of 139.26 would open up deeper medium term decline to 61.8% retracement at 125.25.
GBP/USD Mid-Day Outlook
Daily Pivots: (S1) 1.3440; (P) 1.3481; (R1) 1.3512; More...
Intraday bias in GBP/USD remains neutral for the moment. With 1.3389 support intact, further rally is expected. On the upside, firm break of 1.3592 will resume larger rally for 100% projection of 1.2706 to 1.3442 from 1.3138 at 1.3874. However, decisive break of 1.3389 will confirm short term topping, and turn bias back to the downside for 1.3138 support instead.
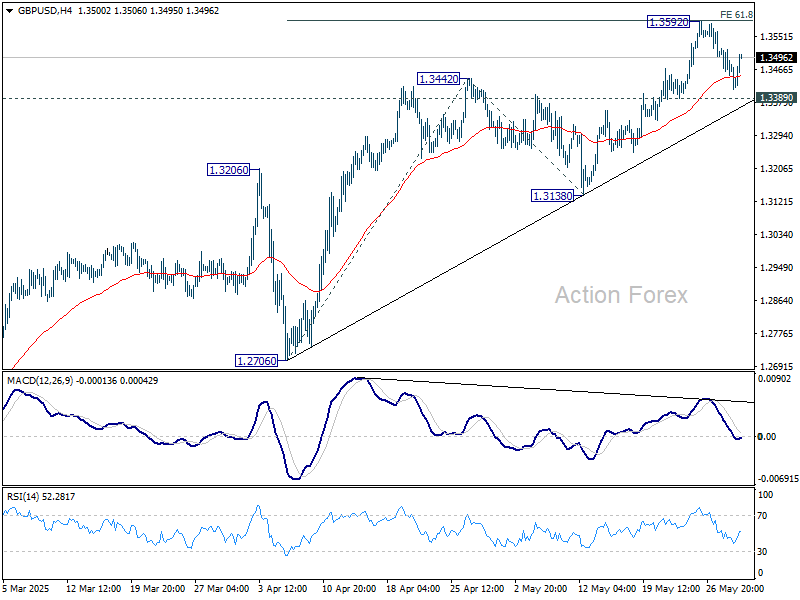
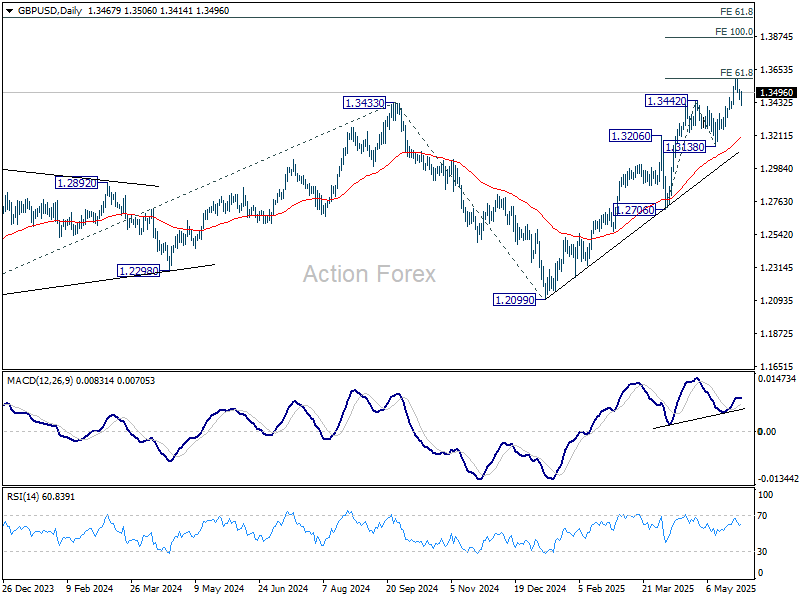
In the bigger picture, up trend from 1.3051 (2022 low) is in progress. Next medium term target is 61.8% projection of 1.0351 to 1.3433 from 1.2099 at 1.4004. Outlook will now stay bullish as long as 55 W EMA (now at 1.2870) holds, even in case of deep pullback.
Dollar Reverses as Markets Doubt Lasting Impact of US Tariff Ruling
Dollar initially surged after the US Court of International Trade ruled against President Donald Trump’s sweeping reciprocal tariff orders. Market participants initially interpreted the ruling as a potential turning point in the US trade policy, fueling a rally in the greenback and risk assets.
However, the greenback's rally proved short-lived. As the US session opened, the greenback reversed course and turned broadly lower. Traders began to reassess the practical implications of the ruling, with many suspecting that the Trump administration could still find legal or procedural workarounds to reinstate the tariffs.
In that context, the ruling may have increased legal complexity but done little to reduce the overarching geopolitical uncertainty. Traders are clearly skeptical that the legal setback will lead to a meaningful shift in trade tensions.
Indeed, skepticism is evident across financial markets. DOW futures, which had gained more than 500 points earlier in the day, gave back almost all of those gains. NASDAQ remained resilient, supported by tech sector optimism, but broader risk appetite appeared to fade. Gold, meanwhile, rebounded above the 3300 level as safe-haven demand returned, signaling that markets are still hedging against unresolved geopolitical and policy risks.
In currency markets, the shift in sentiment was clear. Dollar is now the weakest performer of the day, followed by Sterling and then Yen. Aussie emerged as the top gainer, while Euro and Kiwi also firmed. Swiss Franc and Canadian dollar are trading in the middle of the pack.
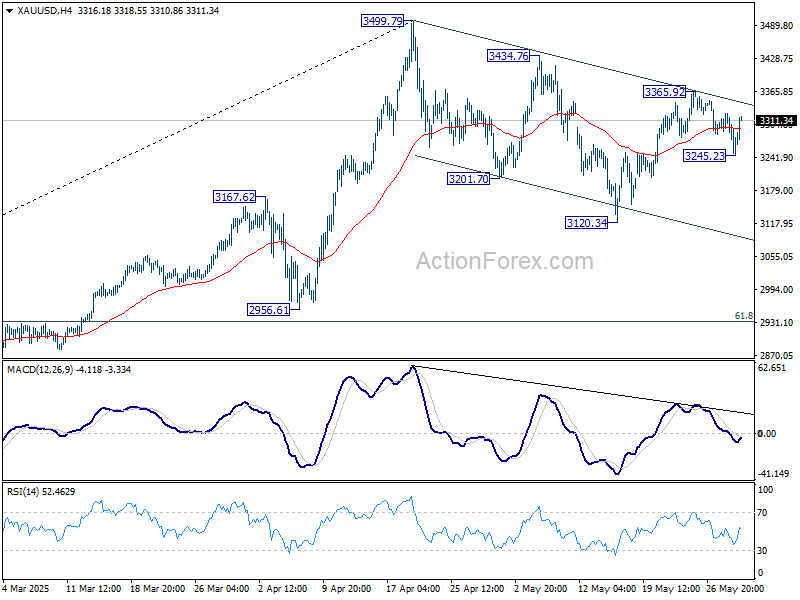
Technically, intraday bias in Gold is turned neutral first with current recovery. On the upside, break of 3365.92 resistance will revive the case that correction from 3499.79 has completed with three waves down to 3120.34, and bring retest of 349.79 high. Nevertheless, below 3245.23 will extend the corrective pattern with another falling leg.
In Europe, at the time of writing, FTSE is flat. DAX is up 0.23%. CAC is up 0.63%. UK 10-year yield is down -0.006 at 4.726. GErmany 10-year yield is down -0.005 at 2.551. Earlier in Asia, Nikkei rose 1.88%. Hong Kong HSI rose 1.35%. China Shanghai SSE rose 0.70%. Singapore Strait times rose 0.13%. Japan 10-year JGB yield rose 0.003 to 1.520.
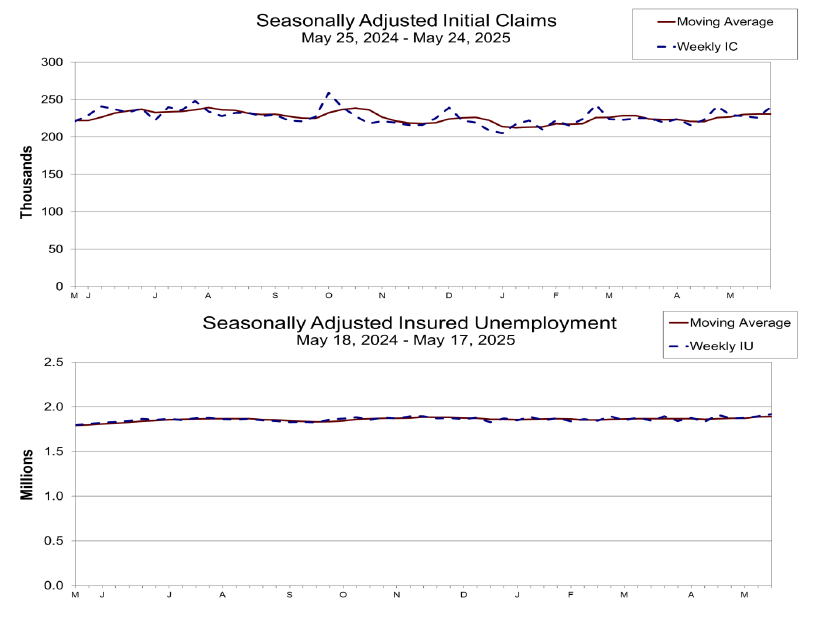
US initial jobless claims rise to 240k vs exp 230k
US initial jobless claims rose 14k to 240k in the week ending May 24, above expectation of 230k. Four-week moving average of initial claims fell -250k to 231k.
Continuing claims rose 26k to 1919k in the week ending May 17, highest since November 13, 2021. Four-week moving average of continuing claims rose 3k to 1890k, highest since November 27, 2021.
RBNZ’s Hawkesby: OCR in neutral zone, July cut not a done deal
RBNZ Governor Christian Hawkesby told Bloomberg TV today that another rate cut at the July meeting is “not a done deal” and “not something that’s programmed.”
With the OCR at 3.25% after this week's reduction, it's now sitting within the estimated neutral range of 2.5% to 3.5%. Hawkesby emphasized the central bank has entered a phase of “considered steps,” guided closely by incoming data rather than a preset easing path.
He acknowledged rising uncertainty, noting that near-term growth headwinds have intensified and both demand and inflation pressures are weaker than they were back in February. He also highlighted the uncertainty surrounding global trade policy, particularly tariff developments, which could play out in various ways.
NZ ANZ business confidence falls to 36.6, supporting case for further RBNZ easing
New Zealand’s ANZ Business Confidence index dropped sharply in May, falling from 49.3 to 36.6. Own Activity Outlook, a key indicator of firms’ expectations for their own performance, declined to 34.8 from 47.7.
Profit expectations also plunged to 11.1, indicating mounting pressure on margins. Although cost and wage expectations eased slightly, they remain elevated, while inflation expectations edged up from 2.65% to 2.71%.
According to ANZ, the survey paints a mixed picture: the economy is in recovery mode, but businesses continue to face tough operating conditions, particularly in passing on cost increases. The data reinforces the view that RBNZ can afford to support growth through further rate cuts, barring any major inflation or data surprises.
ANZ expects the OCR to eventually fall to 2.5%, as global headwinds and domestic fragilities persist.
GBP/USD Mid-Day Outlook
Daily Pivots: (S1) 1.3440; (P) 1.3481; (R1) 1.3512; More...
Intraday bias in GBP/USD remains neutral for the moment. With 1.3389 support intact, further rally is expected. On the upside, firm break of 1.3592 will resume larger rally for 100% projection of 1.2706 to 1.3442 from 1.3138 at 1.3874. However, decisive break of 1.3389 will confirm short term topping, and turn bias back to the downside for 1.3138 support instead.
In the bigger picture, up trend from 1.3051 (2022 low) is in progress. Next medium term target is 61.8% projection of 1.0351 to 1.3433 from 1.2099 at 1.4004. Outlook will now stay bullish as long as 55 W EMA (now at 1.2870) holds, even in case of deep pullback.
US initial jobless claims rise to 240k vs exp 230k
US initial jobless claims rose 14k to 240k in the week ending May 24, above expectation of 230k. Four-week moving average of initial claims fell -250k to 231k.
Continuing claims rose 26k to 1919k in the week ending May 17, highest since November 13, 2021. Four-week moving average of continuing claims rose 3k to 1890k, highest since November 27, 2021.
New Zealand Central Bank Sees Less Growth, FOMC Says It Will Remain Cautious, Trump Tariffs Upended
The New Zealand dollar declined as much as 0.67% earlier but has recovered. In the European session, NZD/USD is trading at 0.5969, up 0.04% on the day.
RBNZ's Hawkesby sees weaker growth, lower inflation
A day after the Reserve Bank of New Zealand lowered interest rates, Governor Christian Hawkesby testified before a parliamentary committee on Thursday. Hawkesby said the central bank could hold rates in July and that rate decisions would be data-dependent. The Governor said he expected slower global growth would dampen New Zealand's recovery and there was uncertainty around the impact of the US tariffs.
The RBNZ has been aggressive, chopping 225 basis points in the current easing cycle, which has brought the cash rate down to 3.25%, its lowest level in almost three years. At yesterday's meeting, the RBNZ said that the cash rate was currently in a neutral zone, where it neither stimulates nor curbs economic growth.
FOMC minutes: Increasing uncertainly could mean "difficult tradeoffs"
In the FOMC minutes of the May 7 meeting, members expressed concern about the government's fiscal and trade policy. Members said that "uncertainty about the economic outlook had increased further", making it appropriate to remain cautious until these policies became clearer. Members warned that if inflation remained high and growth and employment weakened, the Fed might have to make "difficult tradeoffs".
There was another twist to the Trump tariffs saga, as the US Court of International Trade declared the tariffs illegal. The Court ruled that Trump had exceeded his authority by imposing wide-sweeping tariffs against US trading partners. The decision puts a hold on the tariffs, but that may not last long as the US Justice Department has filed an appeal.
NZD/USD Technical
- NZD/USD has pushed below support at 0.5954 and 0.5937. Below, there is support at 0.5914
- There is resistance at 0.5977 and 0.5994
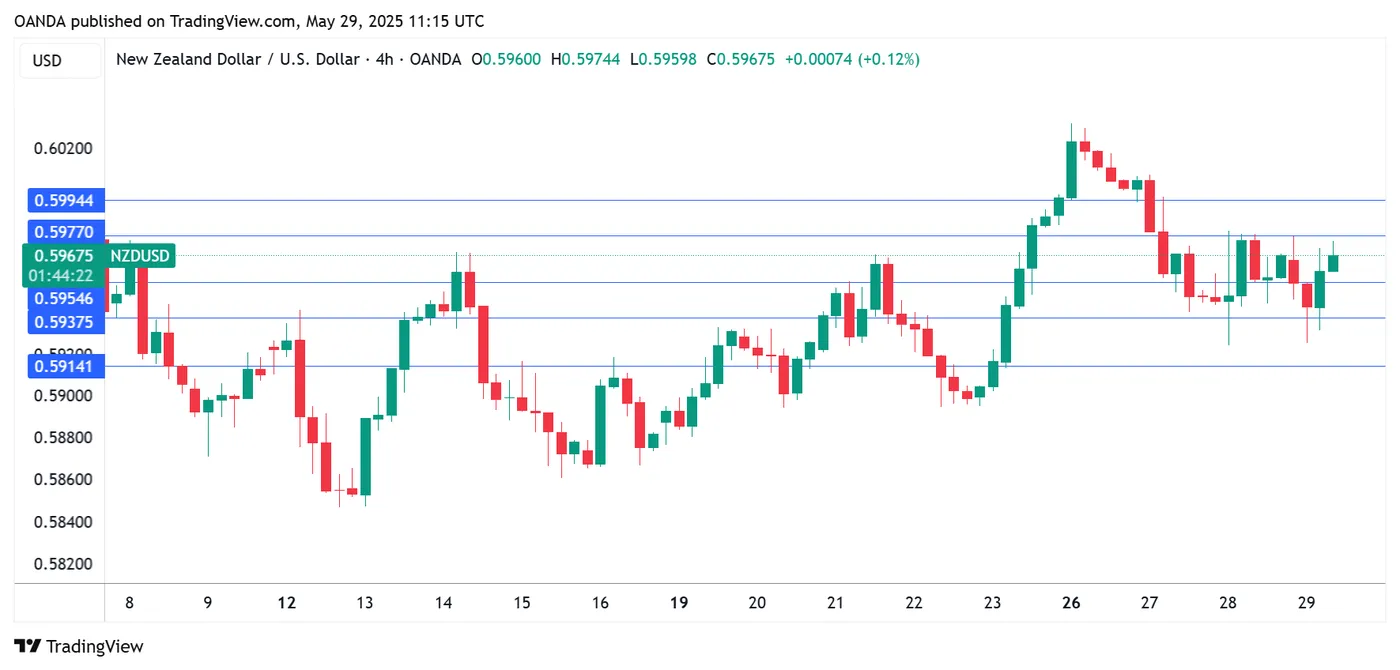
NZDUSD 4-Hour Chart, May 29, 2025
Ethereum Accelerates as Bitcoin Consolidates
Market Picture
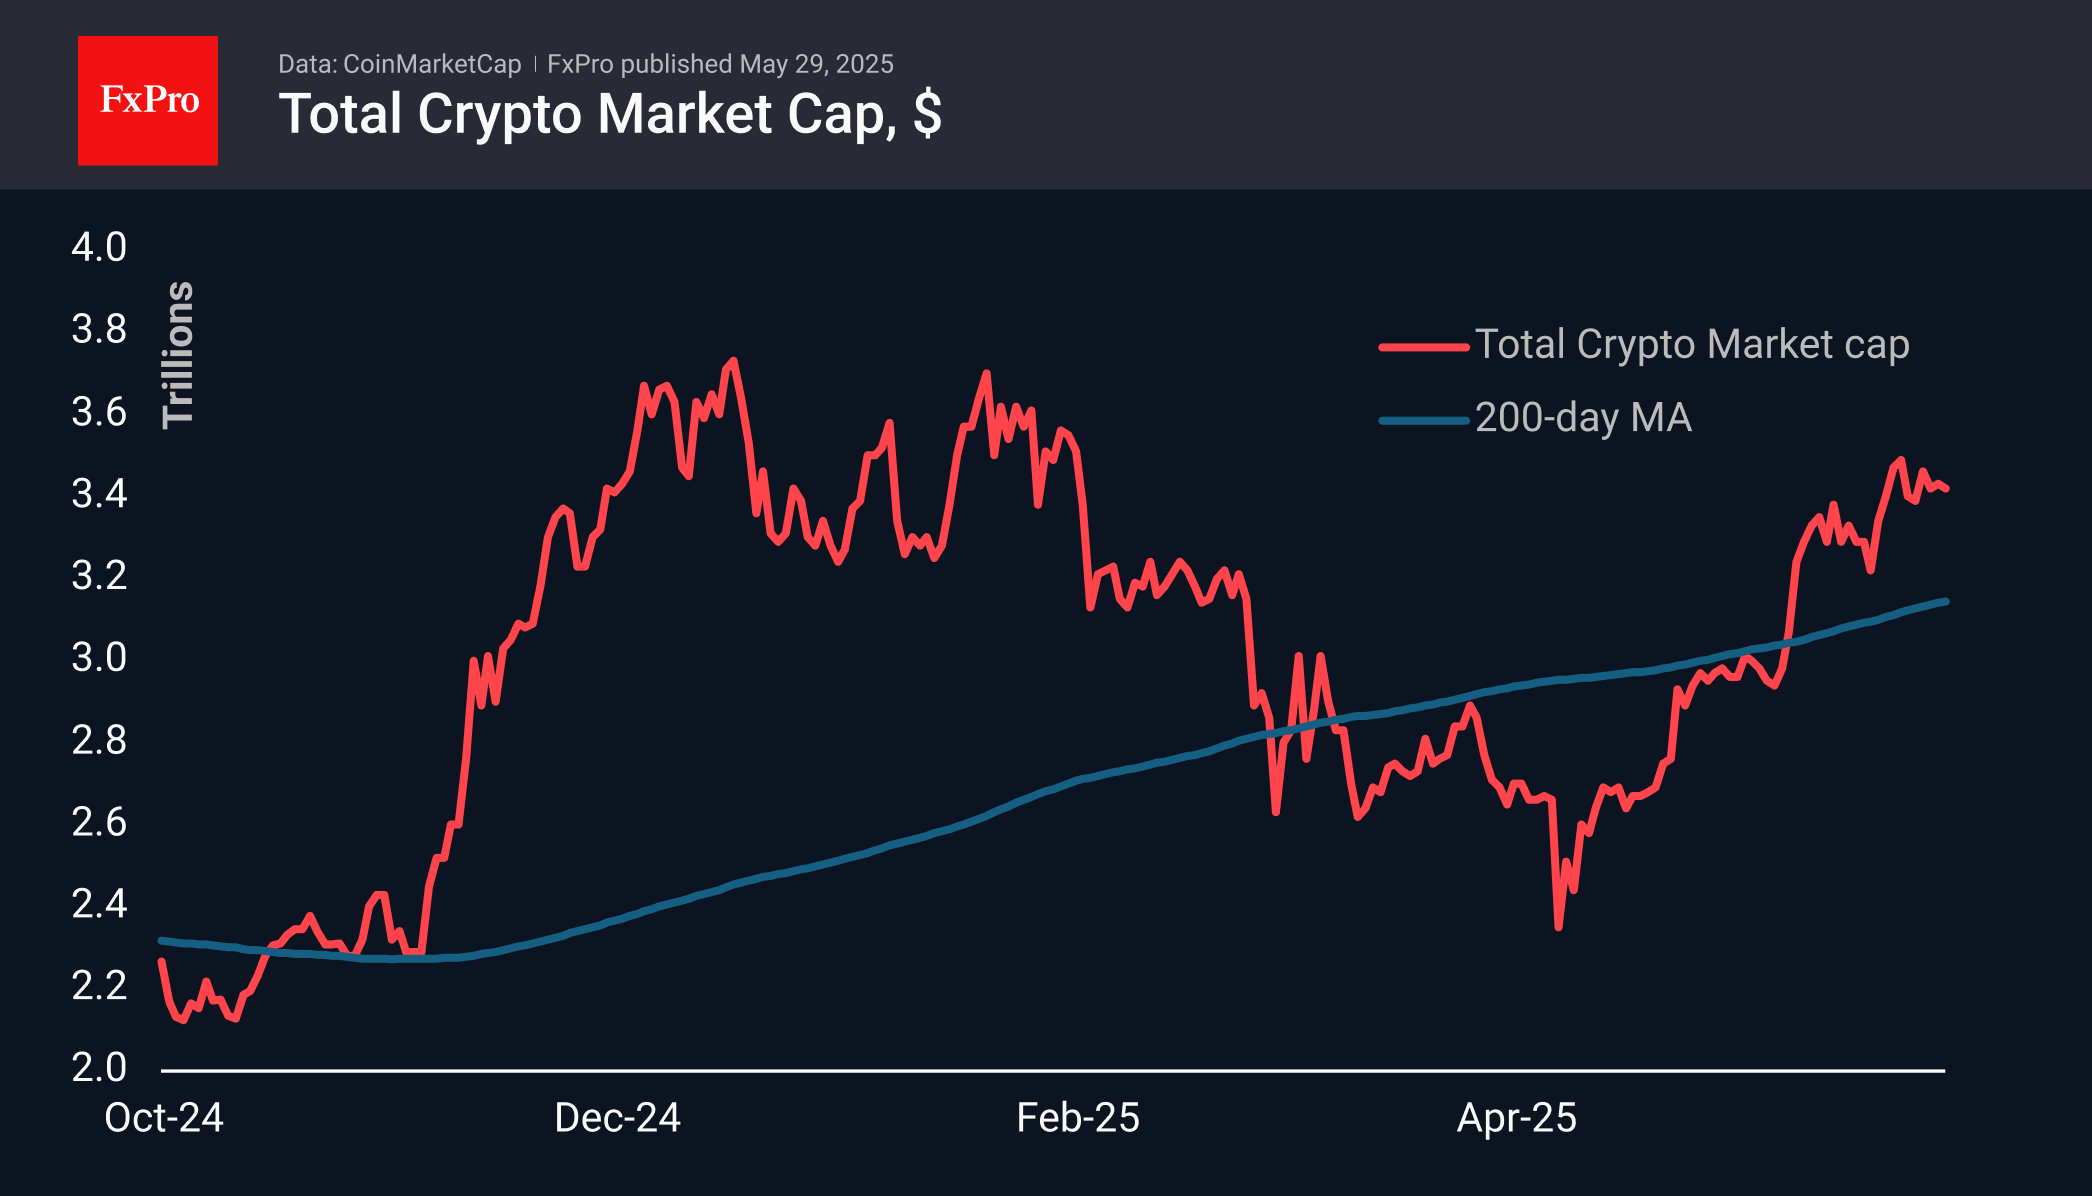
Market capitalisation has changed little over the last day, hovering around the $3.42 trillion mark. Cryptocurrencies prefer not to notice positive stock market movements as they are related to tariffs and company reports, not money supply. In addition, the dollar’s exchange rate is rising for the third day.
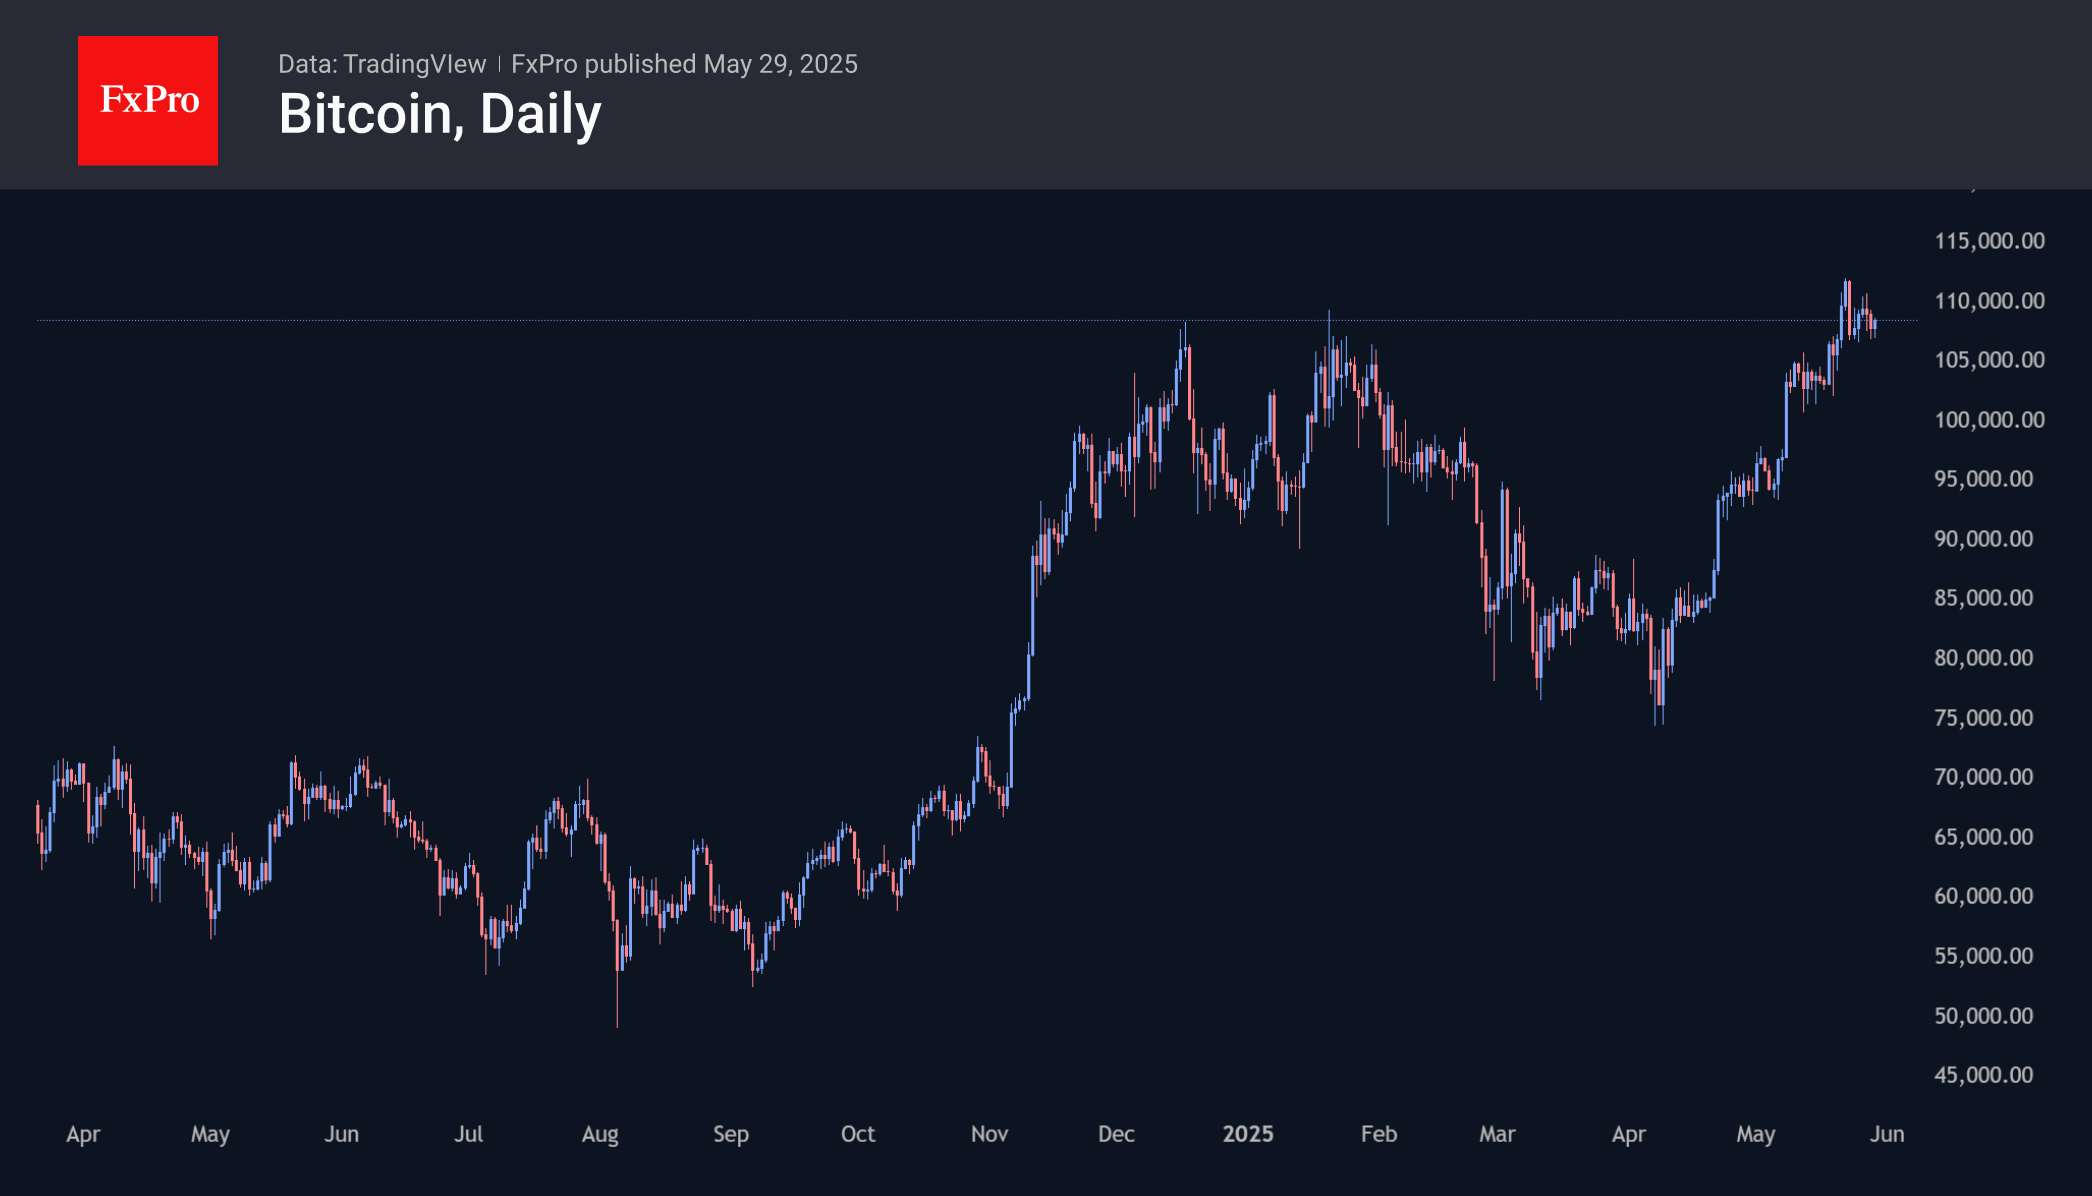
The day before, Bitcoin retreated from the trading range’s upper boundary at 110k to its lower boundary at 107k. This rest at previous highs effectively removes the local overheating of the market. As the institutional presence in Bitcoin expands, its dynamics are becoming more similar to the behaviour of stock and commodity market instruments, with less pronounced FOMO periods.
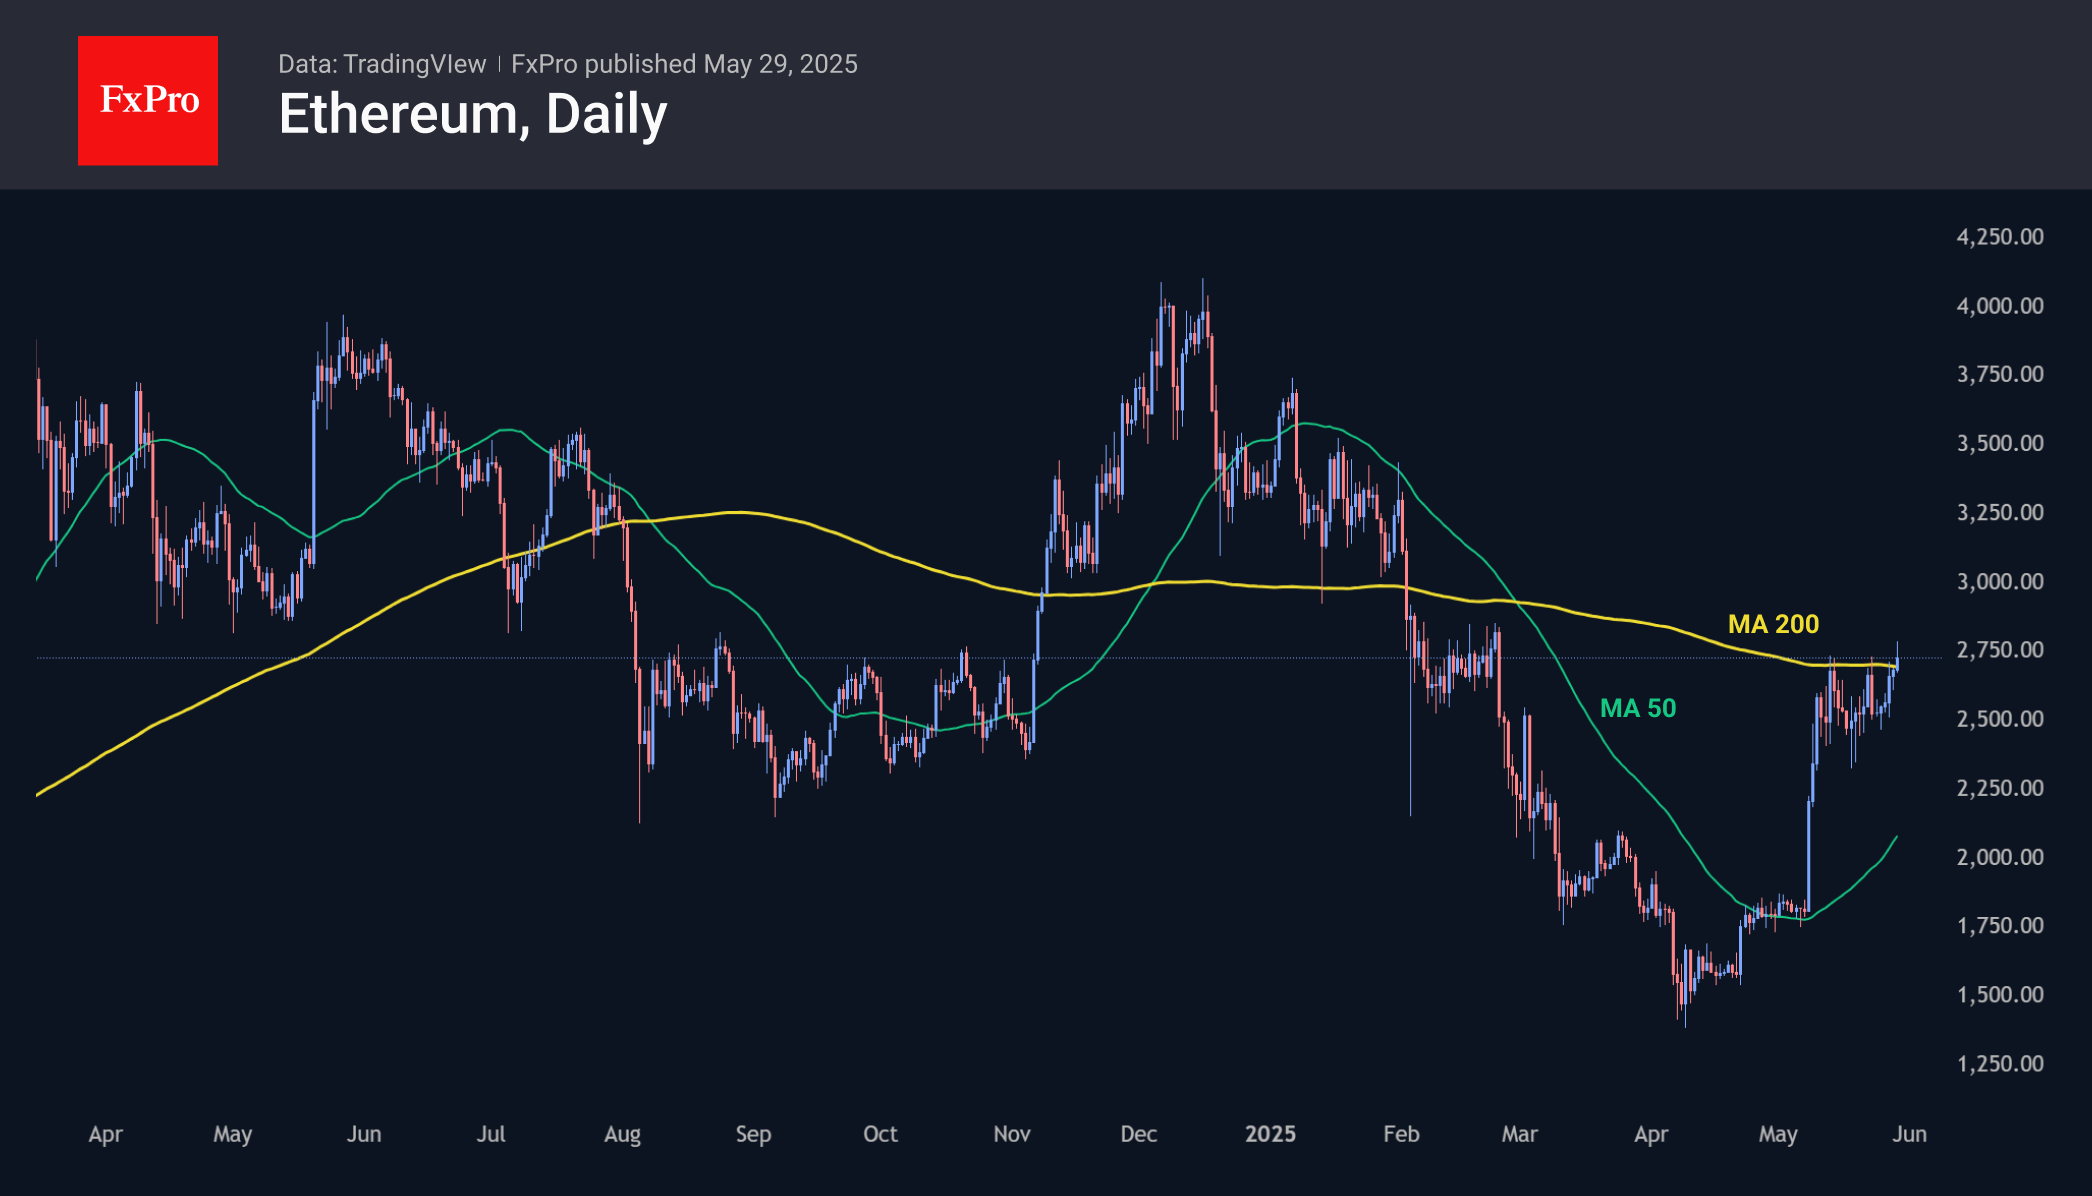
Ethereum was briefly above $2780 on Thursday morning, hitting new highs from February and the 200-day moving average. A consolidation above $2700 has the potential to attract the attention of broader traders, kick-starting momentum to $3300 or even $4000.
News Background
The positive trend in US spot bitcoin-ETFs has continued for 9 consecutive trading sessions and 24 trading days out of the last 27.
Strategy additionally bought an additional 4,020 BTC ($427.1 million) last week at an average price of $106,237 per coin. The company now owns 580,250 BTC with an average price of $69,979 and is in profit by almost $22 billion at current prices. Strategy continues to buy BTC, but the pace of acquisitions has slowed from its November peak.
According to mining company Marathon Digital Holdings (mara), the U.S. government can increase the bitcoin reserve if it finds a way to do so without new taxes and increased government debt. The US government can replenish the bitcoin reserve in many ways, including mining the first cryptocurrency.
The futures and options markets point to growing interest from large investors in Ethereum over Bitcoin. Coindesk analyst Omkar Godbole said this signals a possible shift in focus in the crypto market.
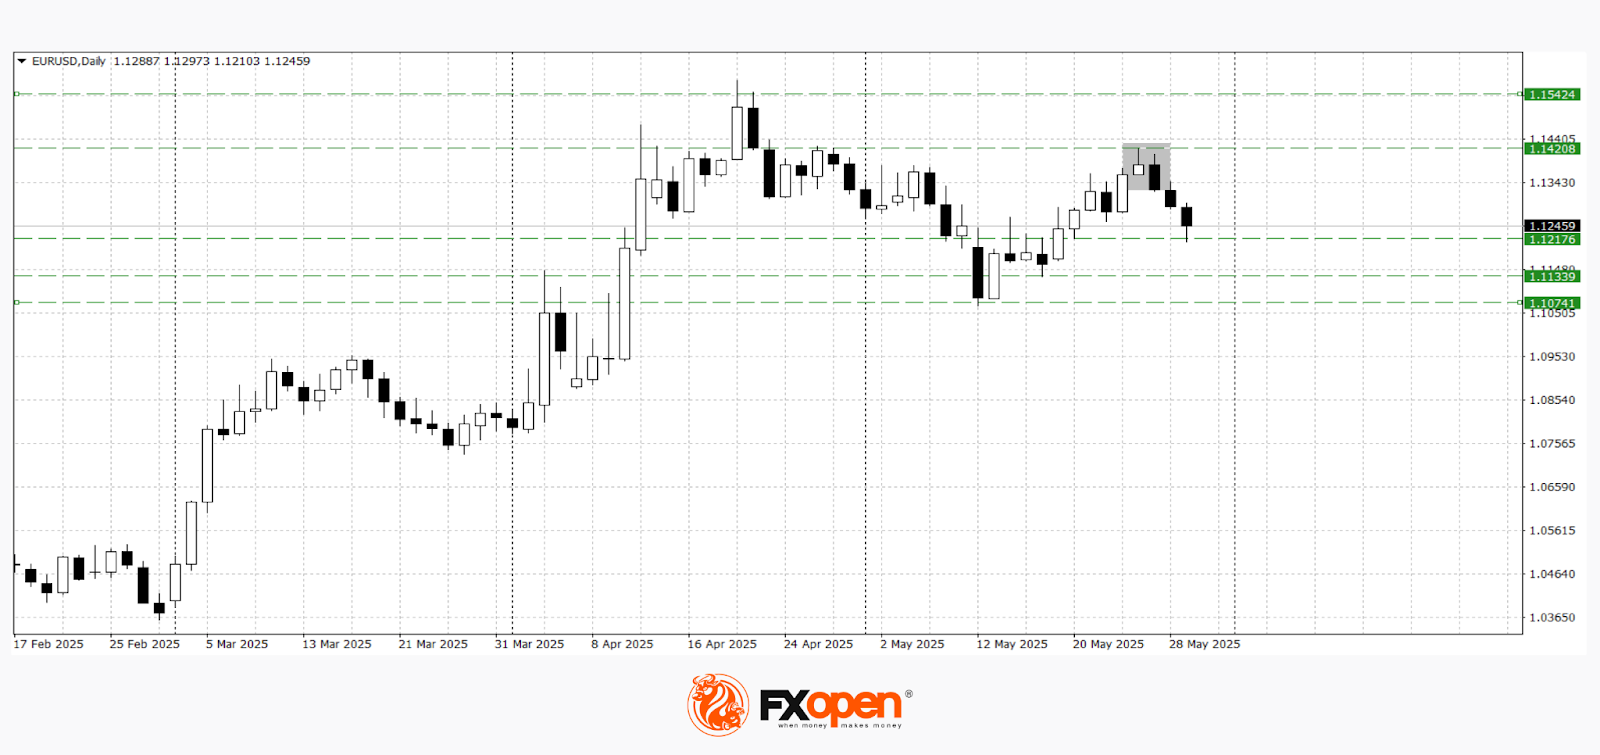
EUR/USD Extends Losses for Third Consecutive Day
The euro/dollar pair continues to decline on Thursday, edging closer to 1.1256 as the US dollar strengthens for a third straight session. This development follows a US federal court ruling that former President Donald Trump overstepped his authority by imposing retaliatory tariffs.
Key factors driving EUR/USD movement
The US Court of International Trade ruled that the tariffs were unlawful not only for the five companies that brought the lawsuit but also for all parties. The court ordered the immediate and permanent revocation of these tariffs, although the Trump administration is expected to appeal the decision.
Meanwhile, investors are closely monitoring debates in the US Senate over Trump’s expansive tax and budget bill, which is likely to face substantial amendments in the upper chamber.
Yesterday’s release of the Federal Reserve meeting minutes revealed a cautious, wait-and-see stance among officials. Policymakers are evaluating the economic repercussions of recent government measures and the ongoing tariff dispute, with noted concerns over rising inflation and unemployment risks.
Thursday’s market focus will shift to key economic data, including the second estimate of US Q1 GDP and the weekly US jobless claims report.
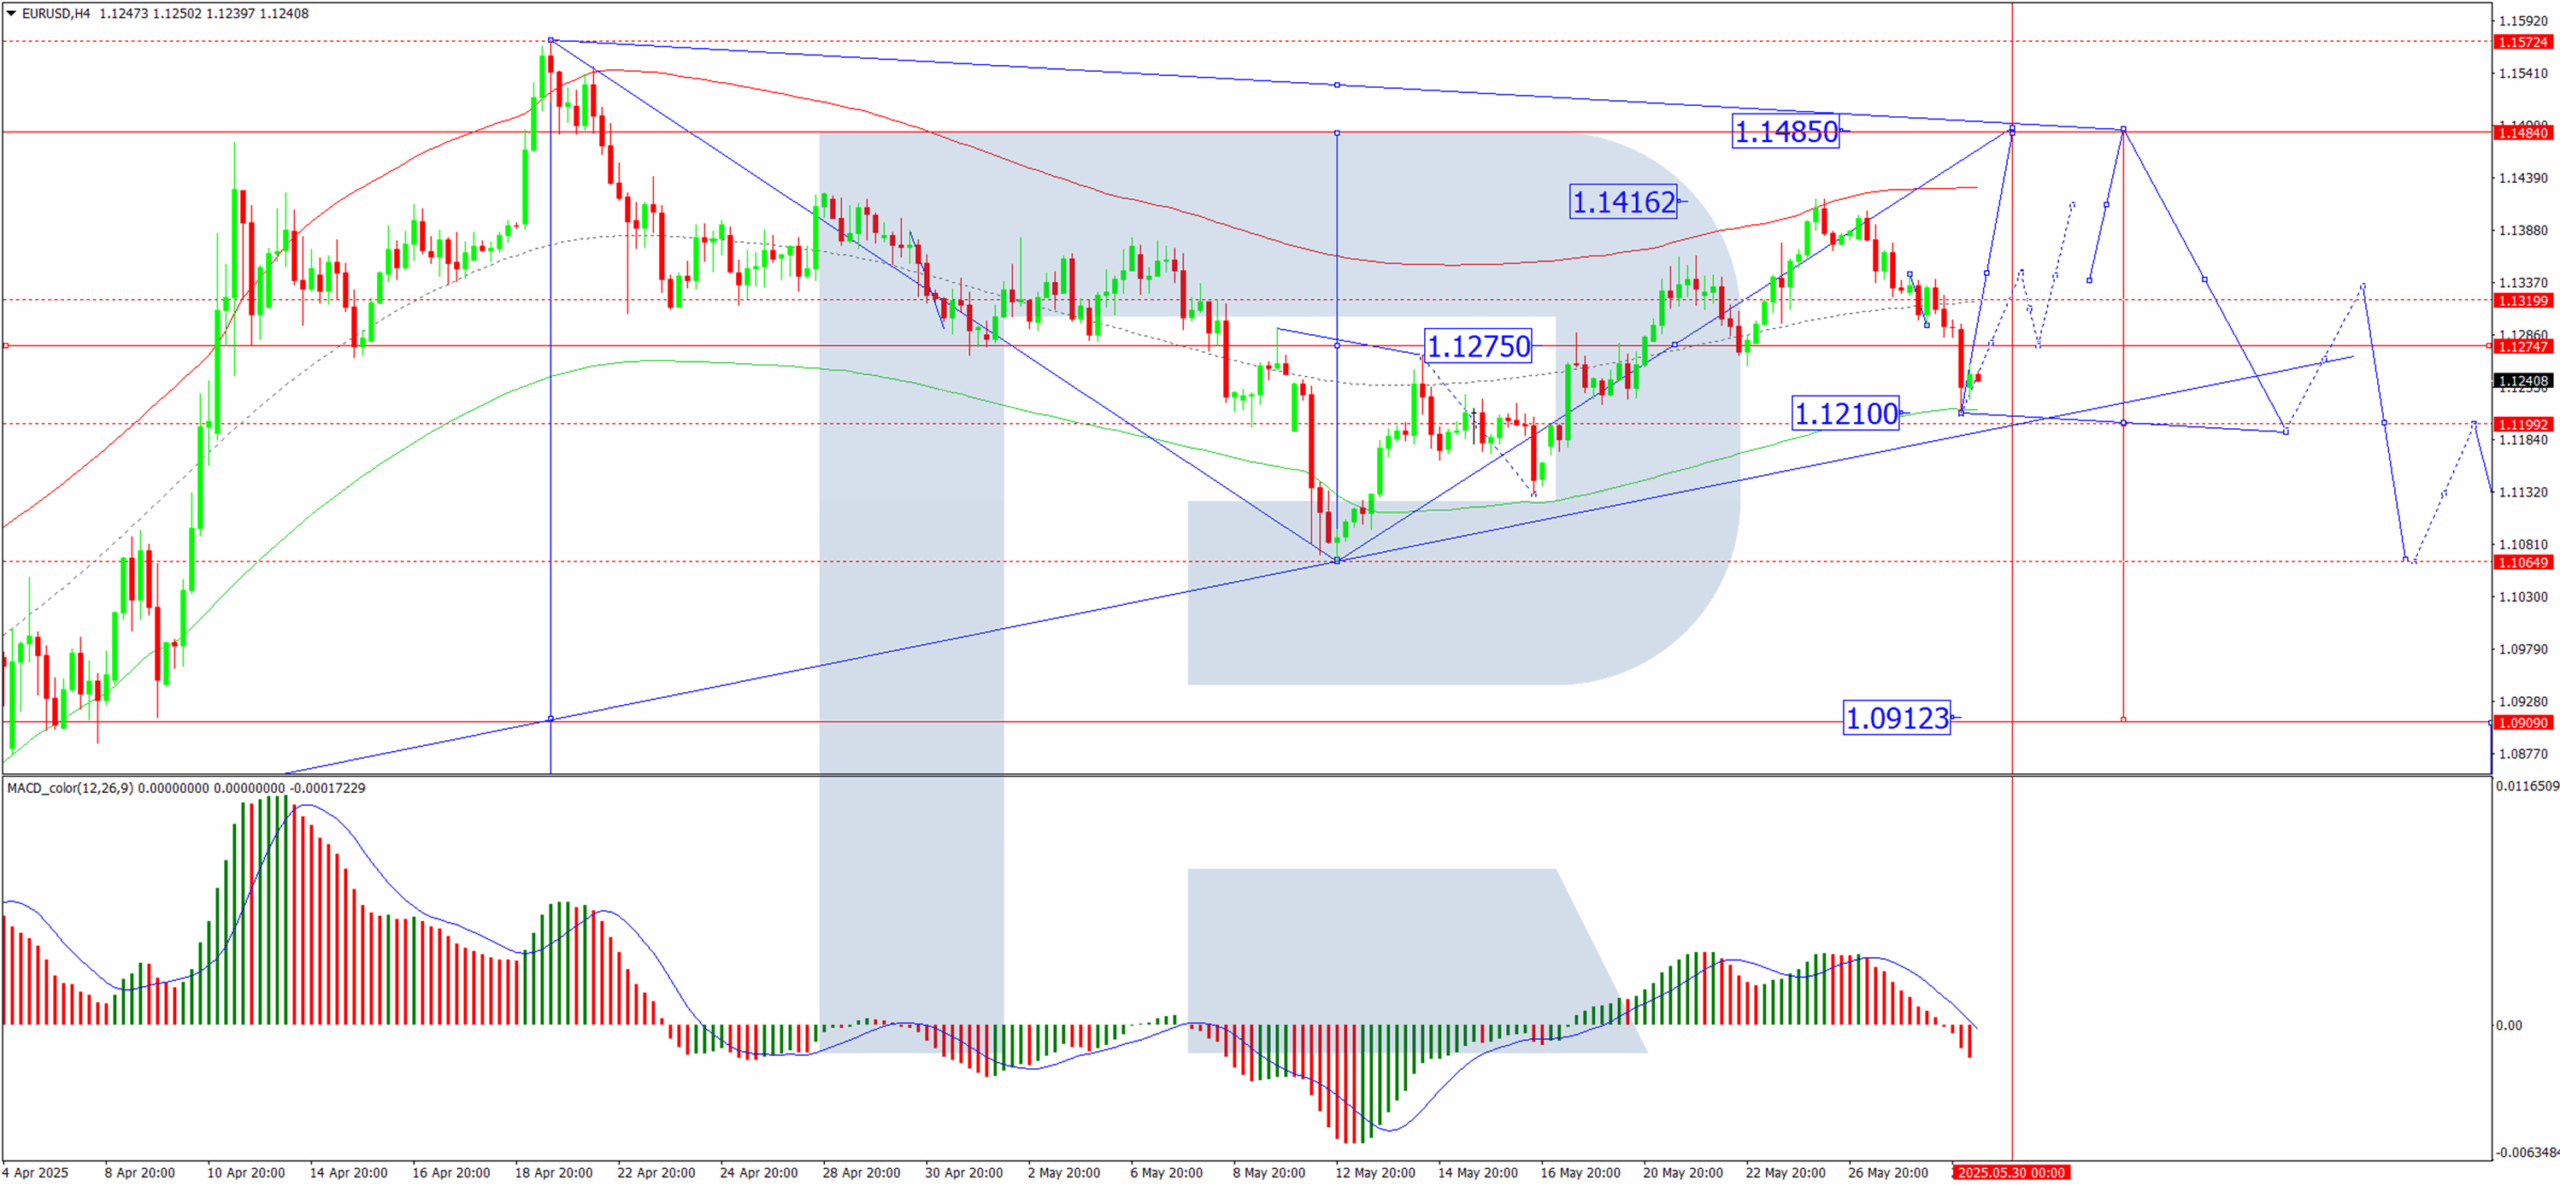
Technical analysis: EUR/USD
H4 Chart:
- The pair formed a consolidation range around 1.1313 before breaking downward to 1.1210
- A technical retracement to 1.1313 (testing from below) is anticipated today
- If the price breaks downward from this range, the downtrend could extend towards 1.1080
- Conversely, an upward breakout may signal a corrective move towards 1.1485
- The MACD indicator supports this outlook, with its signal line below zero and pointing sharply downward.
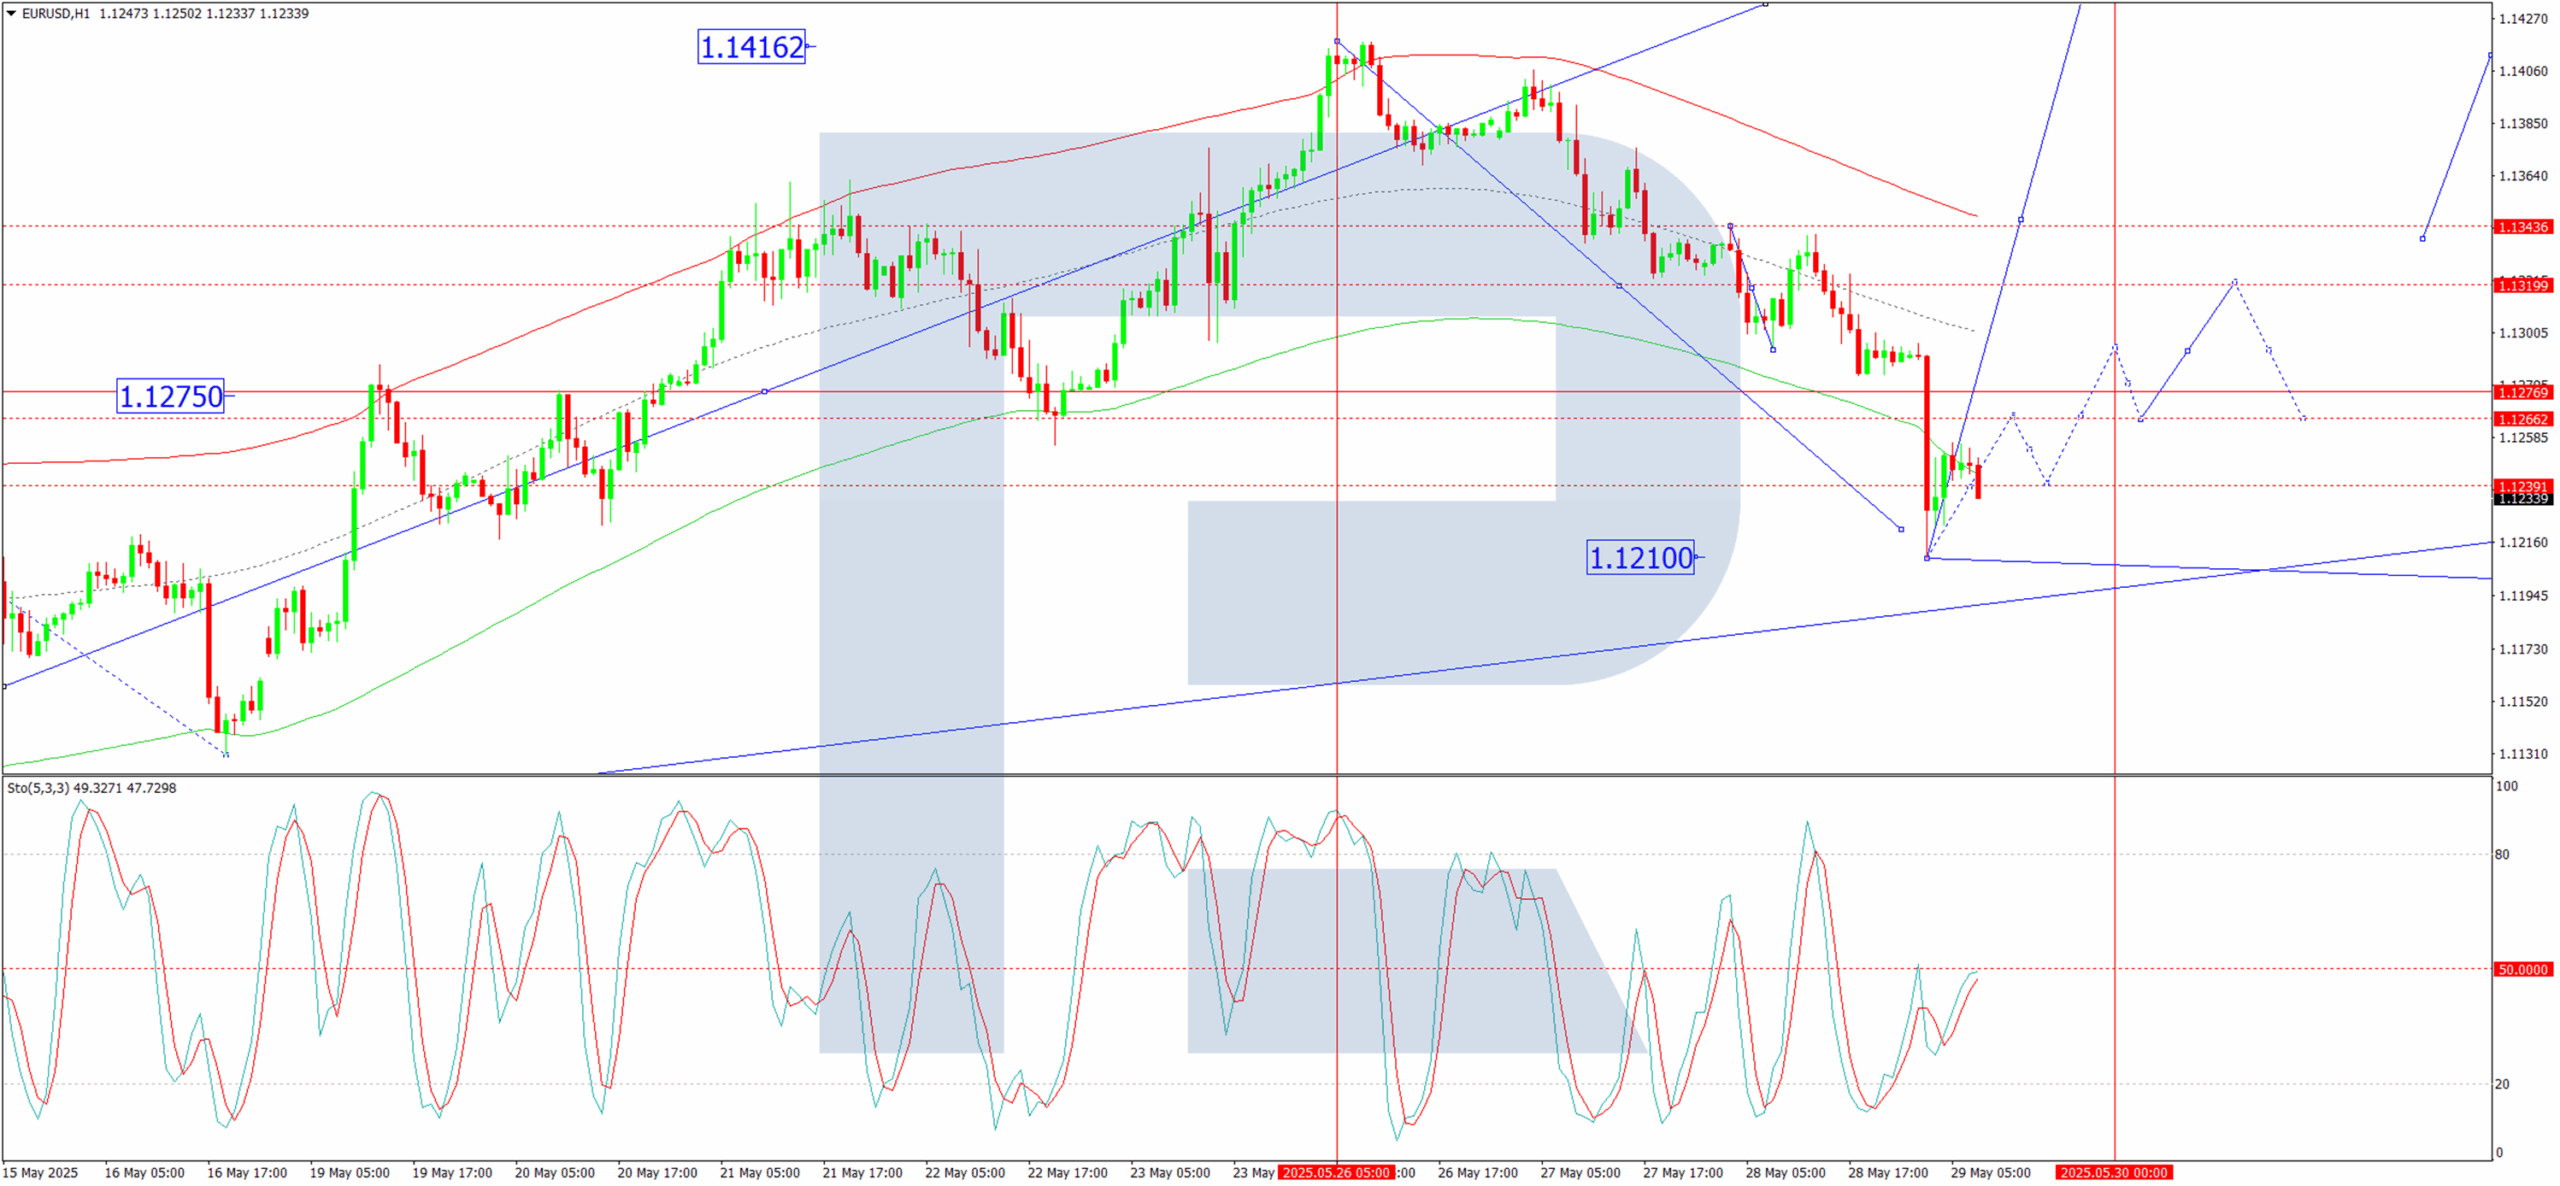
H1 Chart:
- The market completed a downward wave to 1.1313, followed by consolidation and a further drop to 1.1210 in a double-wave extension structure
- Today, a potential upside wave to 1.1260 is in play, with a possible continuation towards 1.1313
- The Stochastic oscillator aligns with this scenario, with its signal line above 50 and rising towards 80
Conclusion
The EUR/USD remains under pressure amid dollar strength and political uncertainty, with technical indicators suggesting further downside potential unless a corrective rebound materialises.
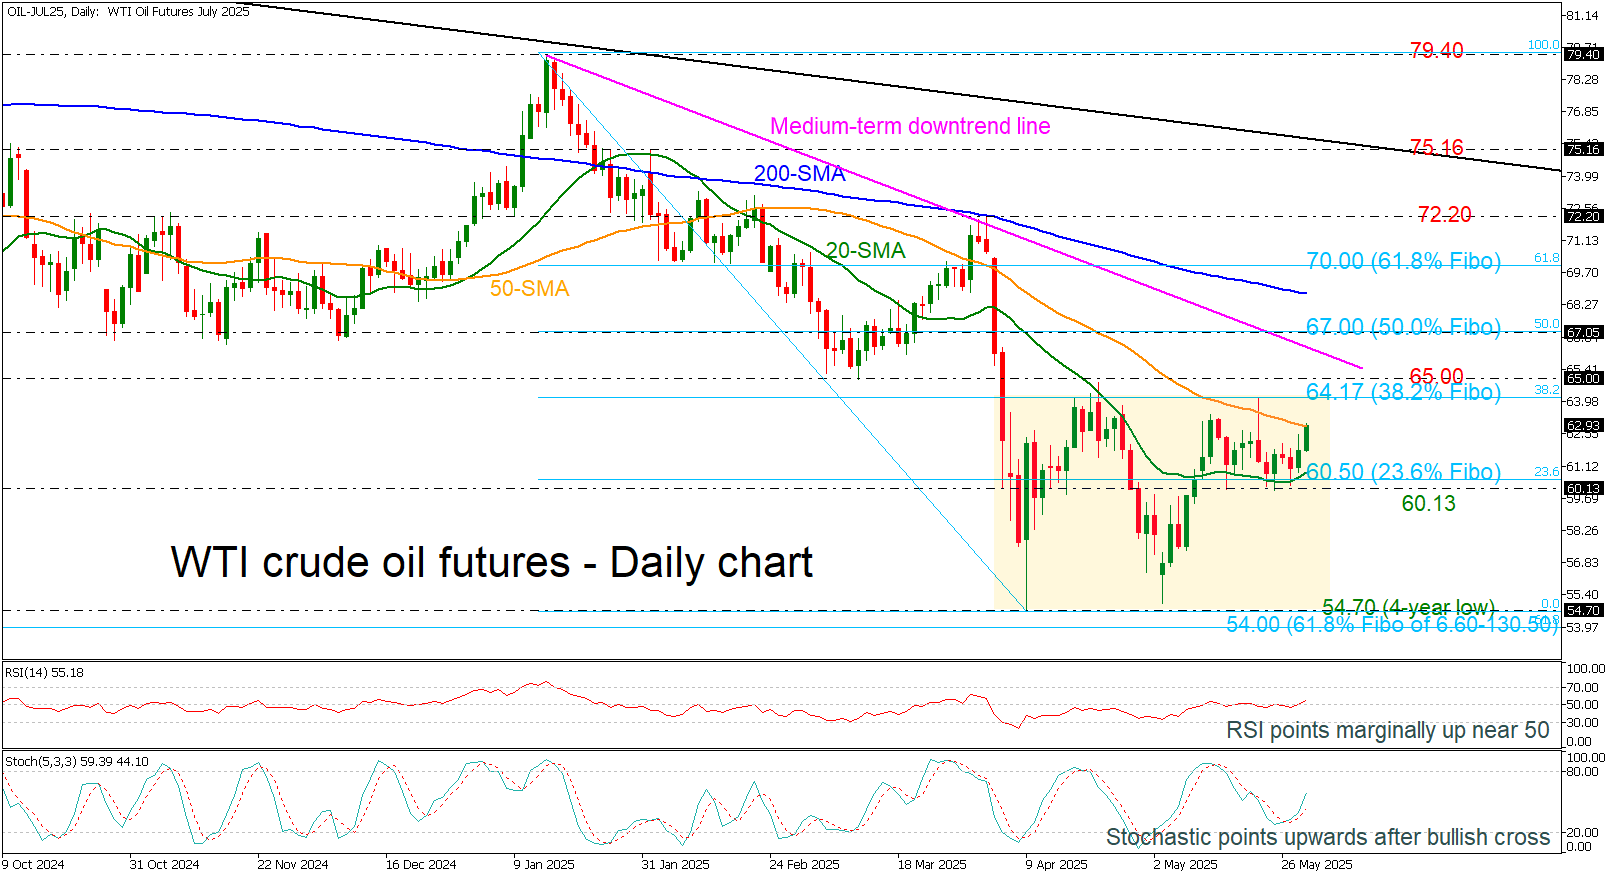
WTI Crude Oil Futures Push Higher, Eyes on 65.00 and Beyond
- WTI crude oil futures repeatedly bounce off 60.13.
- Momentum oscillators suggest bullish move.
WTI crude oil futures are rebounding off the 60.13-60.50 support region, which encapsulates the 23.6% Fibonacci retracement level of the downward wave from 79.40 to 54.70 and the 20-day simple moving average (SMA). In the short-term view, the commodity has still been developing within a consolidation area of 54.70-64.17 since the beginning of April.
The price is currently fighting with the 50-day SMA around 63.00, with the potential to reach the upper boundary of the range and even higher near the critical 65.00 resistance. More upside pressures could lead investors to the 50.0% Fibonacci at 67.00, which holds near the medium-term falling trend line. Above these restrictions, the 200-day SMA at 68.70 and the 61.8% Fibonacci at 70.00 may prove to be tough obstacles for oil.
On the other hand, a downside move below the 60.13-60.50 area would take the price toward the four-year low of 54.70, ahead of the 61.8% Fibonacci retracement level of the down leg from 6.60 to 130.50 at 54.00. Below that, the next support would come far lower at 43.80.
The technical oscillators confirm the recent upswing in the market with the RSI pointing upwards, crossing above the 50 level, while the stochastic is heading north.
To sum up, WTI crude oil futures are making another bullish attempt to reclaim and break out of the trading range to the upside, but they need additional momentum.
Yen and Euro Slow Their Gains
The USD/JPY and EUR/USD currency pairs are showing moderate corrections. Market participants are locking in profits and shifting to a wait-and-see approach after the release of the Federal Reserve's meeting minutes, in which the regulator reaffirmed its commitment to the current interest rate levels amid uncertainty about the macroeconomic outlook.
In the coming trading sessions, market attention will focus on a batch of statistics from the US, Japan, and the Eurozone. Today, weekly US jobless claims data and the second estimate of Q1 US GDP growth rate are expected. Tomorrow, the focus will shift to Japanese inflation data (CPI), unemployment rate, and industrial production, which could significantly impact the USD/JPY pair.
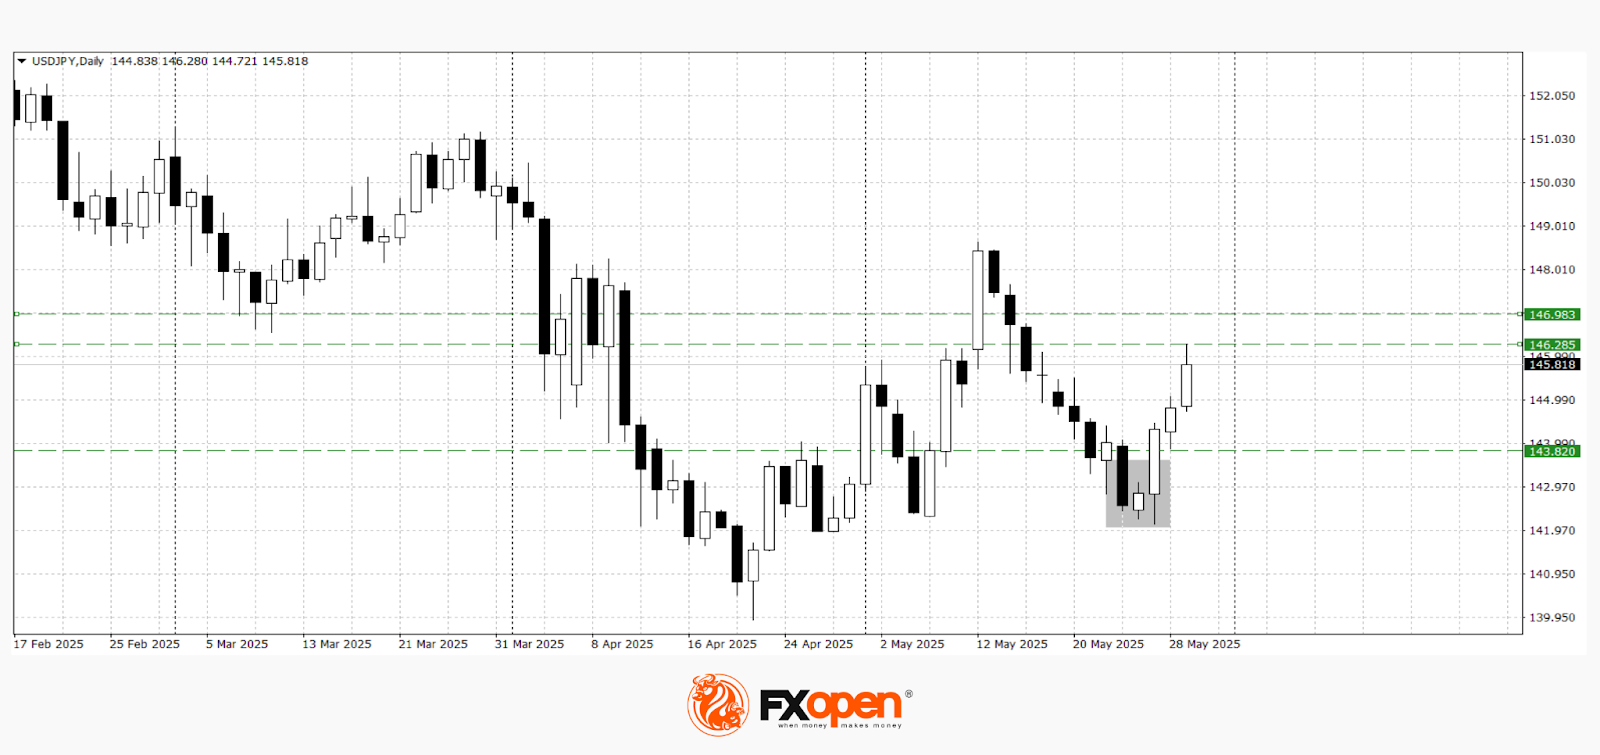
USD/JPY
The USD/JPY pair is trading near the 145.80 level, correcting in response to changes in Japanese government bond yields. The yield on 30-year bonds has dropped to 2.85% from last week’s high of 3.2%, while the yield on 10-year bonds fell to 1.46%. According to sources close to Japan’s Ministry of Finance, a survey among primary dealers indicates structurally low demand for long-term bonds — this could signal a future reduction in their issuance. Amid declining yields, the yen's strengthening has slowed, and interest in the dollar has stabilised.
Technical analysis of USD/JPY indicates a potential upward movement towards the 146.30–147.00 range, as a "piercing line" candlestick pattern has formed on the daily chart. A drop below 144.00–143.80 could invalidate the bullish scenario.
Key events that could influence the USD/JPY rate:
- Today at 15:30 (GMT+3): US GDP Growth Rate
- Today at 15:30 (GMT+3): US Initial Jobless Claims
- Tomorrow at 02:30 (GMT+3): Tokyo Core Consumer Price Index (CPI)
 EUR/USD
The EUR/USD pair is holding around the 1.1250 level, consolidating near local highs. The euro is showing resilience, but further movement will depend on the release of key macroeconomic data from both the US and the Eurozone.
Technical analysis of EUR/USD suggests a possible retest of the critical support zone at 1.1200–1.1140, as a "bearish engulfing" pattern has appeared on the daily chart. A sustained move above 1.1420 could signal a potential resumption of the uptrend.
Key news that could determine the direction of EUR/USD:
- Today at 11:00 (GMT+3): Consumer Confidence Index in Italy
- Tomorrow at 12:00 (GMT+3): Eurozone M3 Money Supply
- Tomorrow at 15:00 (GMT+3): German Consumer Price Index (CPI)
Trade over 50 forex markets 24 hours a day with FXOpen. Take advantage of low commissions, deep liquidity, and spreads from 0.0 pips. Open your FXOpen account now or learn more about trading forex with FXOpen.
This article represents the opinion of the Companies operating under the FXOpen brand only. It is not to be construed as an offer, solicitation, or recommendation with respect to products and services provided by the Companies operating under the FXOpen brand, nor is it to be considered financial advice.