Sample Category Title
Elliott Wave Analysis: Dollar Index (DXY) Completes Correction, Resumes Downtrend
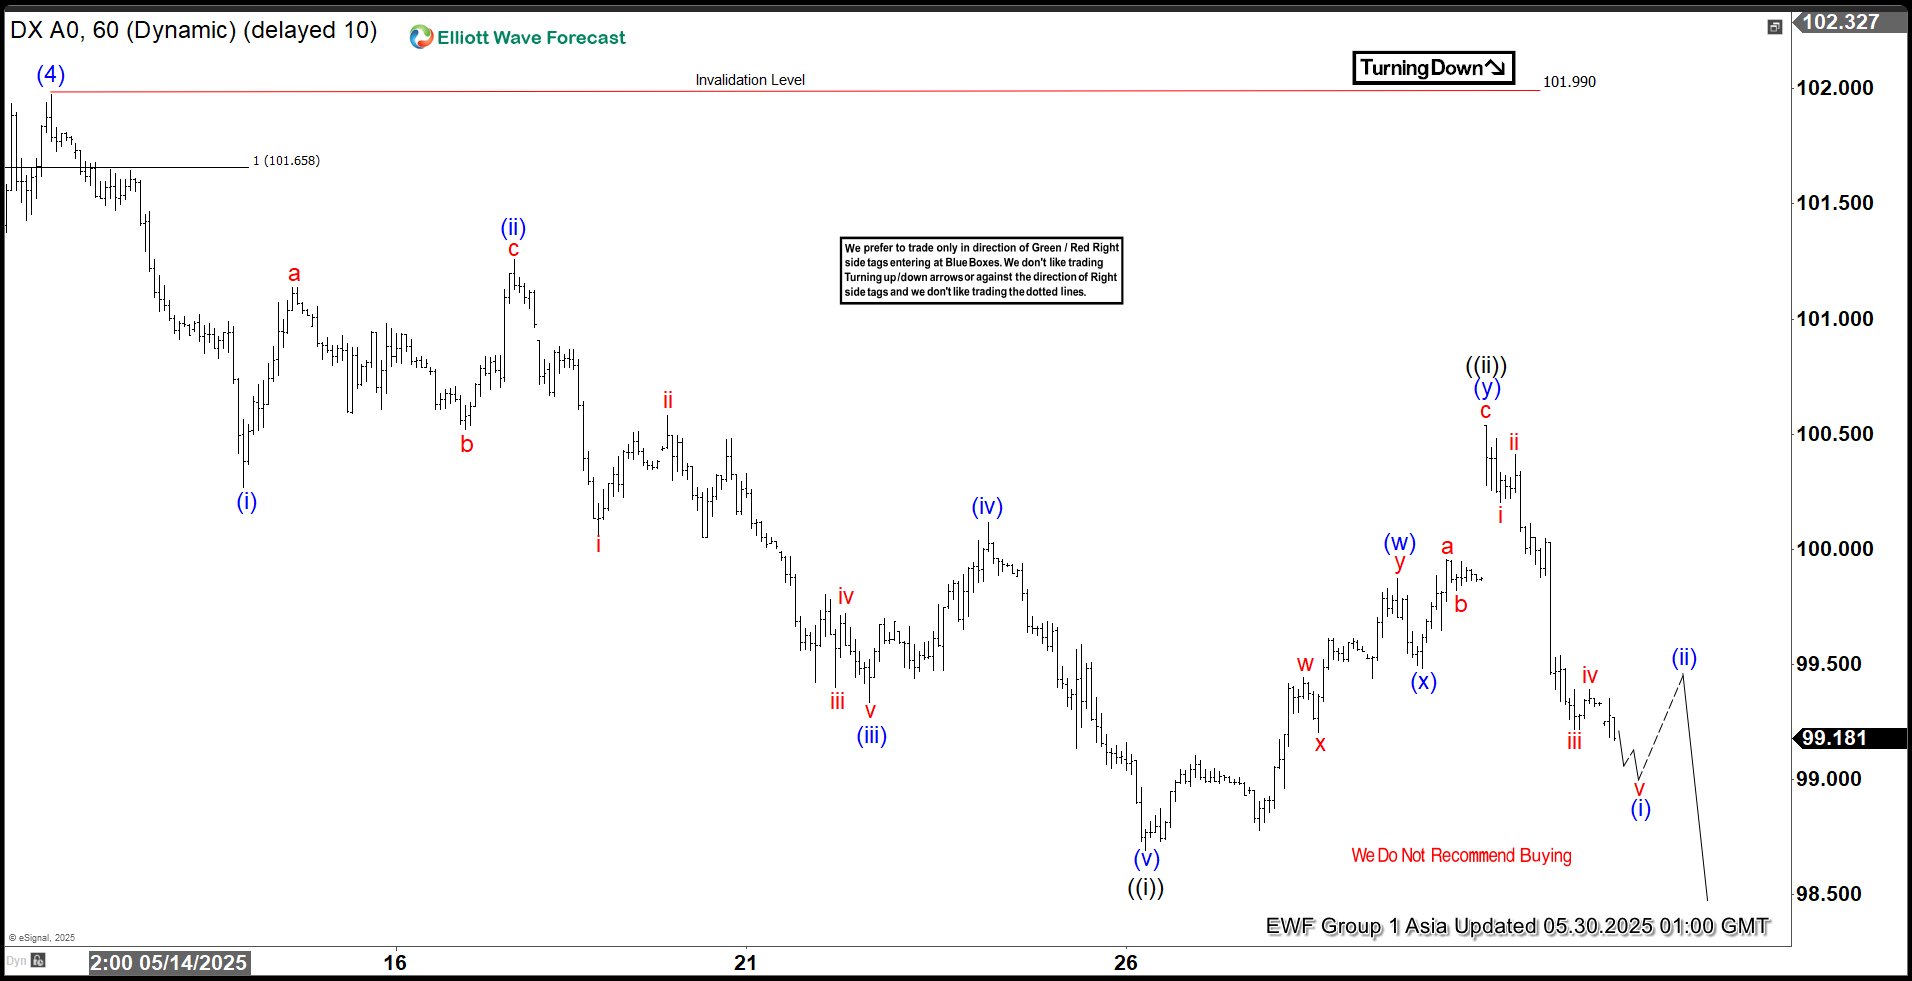
The short-term Elliott Wave analysis for the Dollar Index (DXY) indicates that the cycle from the January 13, 2025 high is unfolding as an impulse pattern, characterized by a five-wave structure moving in the direction of the larger trend. The decline from the January 13, 2025 high began with wave (1), which concluded at 106.96. This was followed by a corrective rally in wave (2), peaking at 109.88. The Index then resumed its downward trajectory in wave (3), reaching 97.92, before a corrective wave (4) rally ended at 101.99, as illustrated in the 1-hour chart below.
Currently, wave (5) is in progress, unfolding as another impulse in a lesser degree. From the wave (4) high, wave (i) concluded at 100.27, followed by a corrective wave (ii) rally ending at 101.259. The Index continued lower in wave (iii) to 99.33, with a subsequent wave (iv) rally peaking at 100.118. The final leg, wave (v), completed at 98.69, finalizing wave ((i)). The corrective wave ((ii)) unfolded as a double three Elliott Wave structure, with wave (w) reaching 99.87. Index then pullback in wave (x) to 99.48, before concluding wave (y) at 100.54. The Index has now turned lower in wave ((iii)). In the near term, as long as the pivot at 101.99 remains intact, the Dollar Index should extend its decline, potentially reaching new lows as the impulse wave continues.
Dollar Index (DXY) 60-Minute Elliott Wave Technical Chart
DXY Elliott Wave Technical Video
https://www.youtube.com/watch?v=A3dlHNEuO4A
Nasdaq Nears Record Highs: Technical Analysis as Index Sits Just 3% Below Peak
US Indices continued their recovery throughout May with another decent start to the trading week. The Nasdaq 100 is up 2.15% since Friday’s close. They are up through broadly unchanged on the day.
Sentiment for this trading week has been broadly positive throughout the globe. Even as US cash markets were closed on Monday for Memorial Day, Equity Futures posted a rise without much retracement.
A swift move up was made in the index after Nvidia beat high expectations on its earnings after the session close with an EPS coming at $0.96 vs $0.93 expected. Revenues came in at $44.1B vs $43.3B expected.
More news came in with the "Taco Trump" headlines, as President Trump's infamous trade tariff policies got denied by the US Federal Court, having deemed that he "overstepped his authority" on his import taxes plan. Markets rallied further before retracing back to yesterday's close.
Let's dive into a multi-timeframe technical analysis review of the NQ.
Nasdaq 100 Technical Analysis
Daily Timeframe
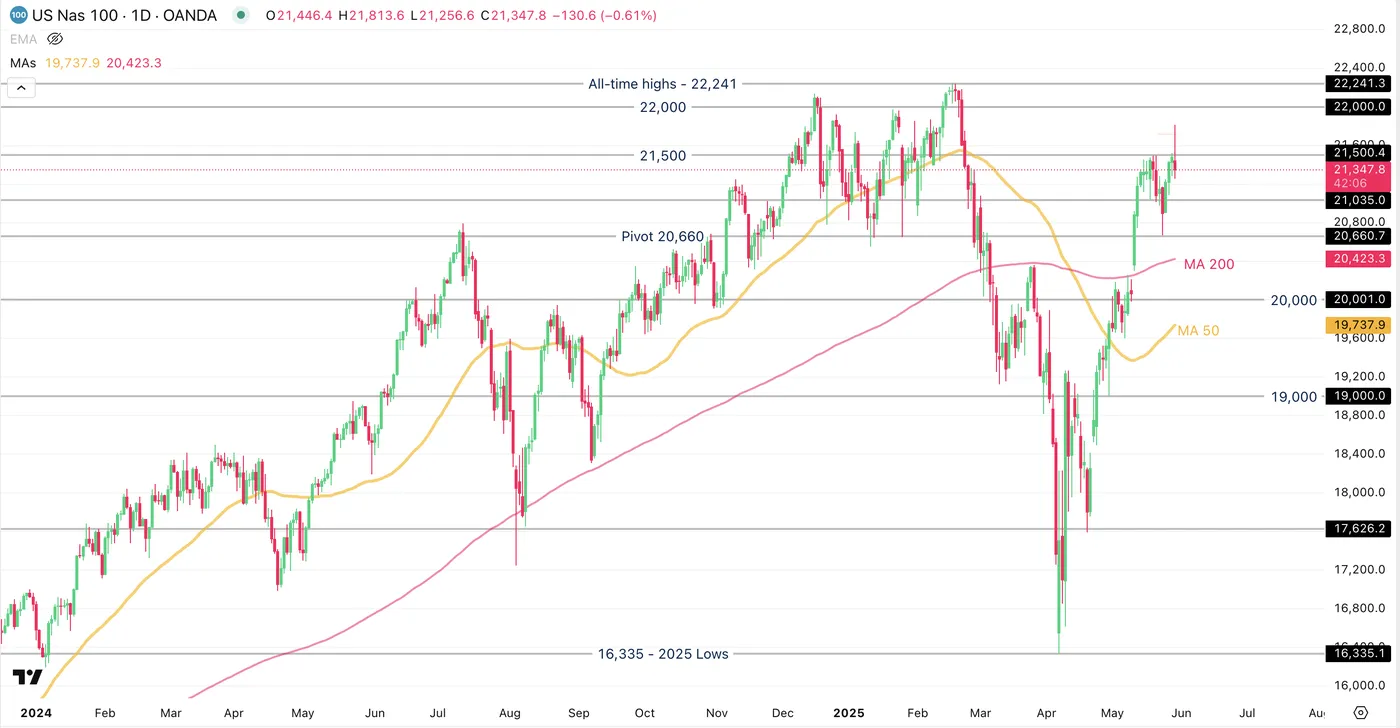
Nasdaq 100 Daily Chart, 2024 to May 28 2025. Source: TradingView
2025 has been volatile for all US Indices to say the least - as a matter of fact, it has been the same around the globe.
The Nasdaq has led on the way up, with Trump’s erratic policy fears abated throughout the past two months. The recovery has been stellar, as we are now largely above the MA 200 and a bit shy of 3% from the all-time highs.
The NQ is up more than 30% from its 4th of April Lows, marked at 16,335.
4H Timeframe
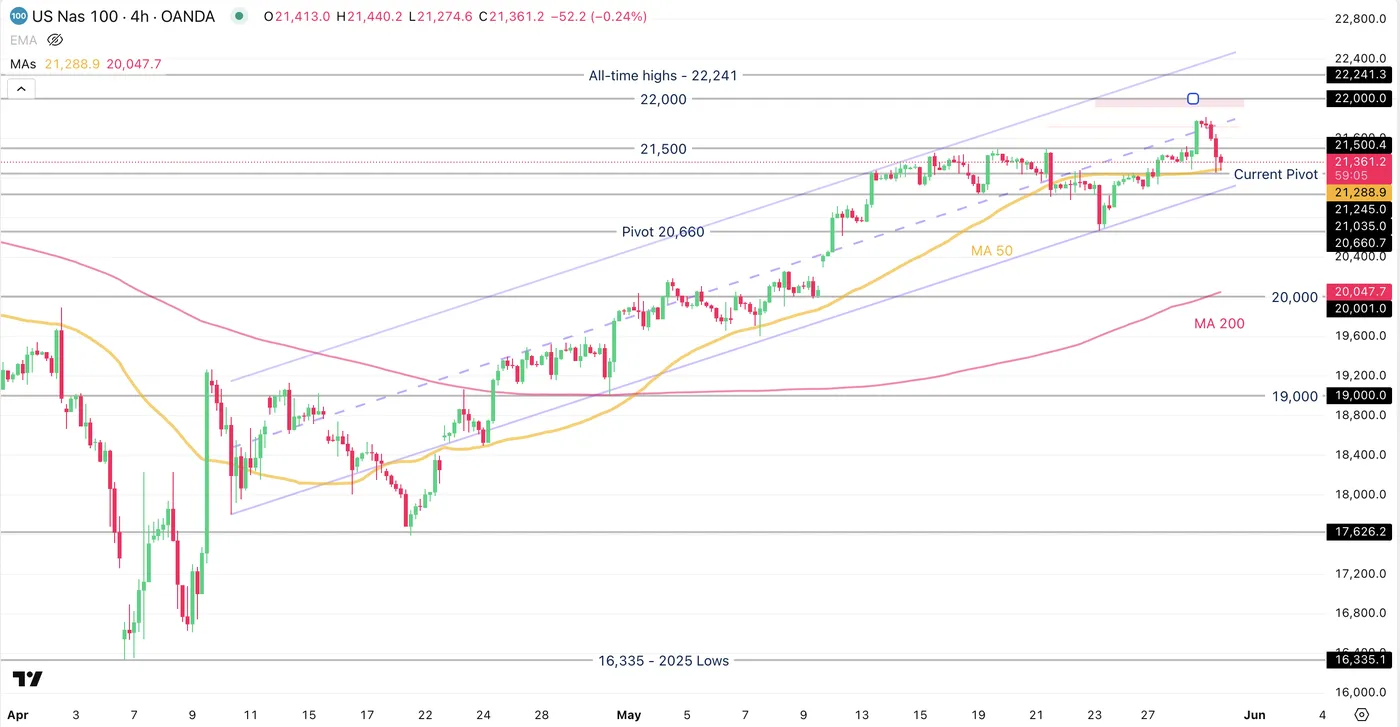
Nasdaq 100 4H Chart, May 28 2025. Source: TradingView
NQ has been in an upwards channel since April 20.
Momentum has been decent, with the MA 50 underpinning the consistent rise.
However, after Moody's downgrade on the US Credit Rating on May 16th, US Indices went through a 3.70% correction, which calmed the rally.
The Nasdaq has to break above 21,800 to pursue it's rise towards the all-time highs.
The MA 50 is showing immediate support, currently at 21,243.
Further support at the lows of the channel coincide with the 21,000 psychological level.
1H Timeframe
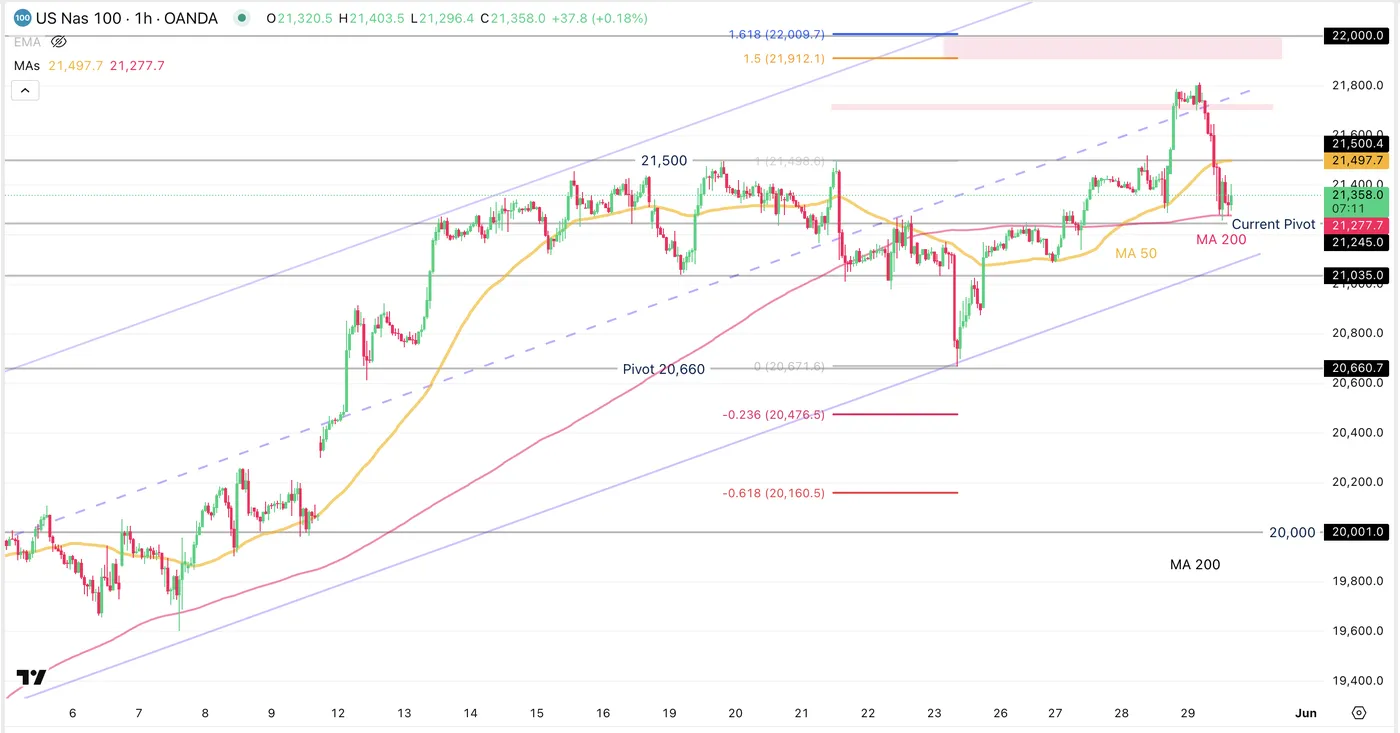
Nasdaq 100 1H Chart, May 28 2025. Source: TradingView
NQ has formed a range after last Friday's lows. Prices have since retraced back up, made an extensive move then gave it back in today's afternoon session. Momentum has since flattened.
The MA 200 is coinciding with the first support level, though being flat, confirms a flattening of momentum on the shorter timeframes.
Resistance Levels:
- 21,500 (immediate resistance)
- 21,700 to 21,730 - Fibonacci Extension 1.382
- 22,000 - Psychological Level + 1.618 Fib Extension Confluence
Support Levels:
- 21,245 (MA 200 + Support confluence)
- 21,035
- 20,660 (Friday 23 Pivot)
Safe Trades!
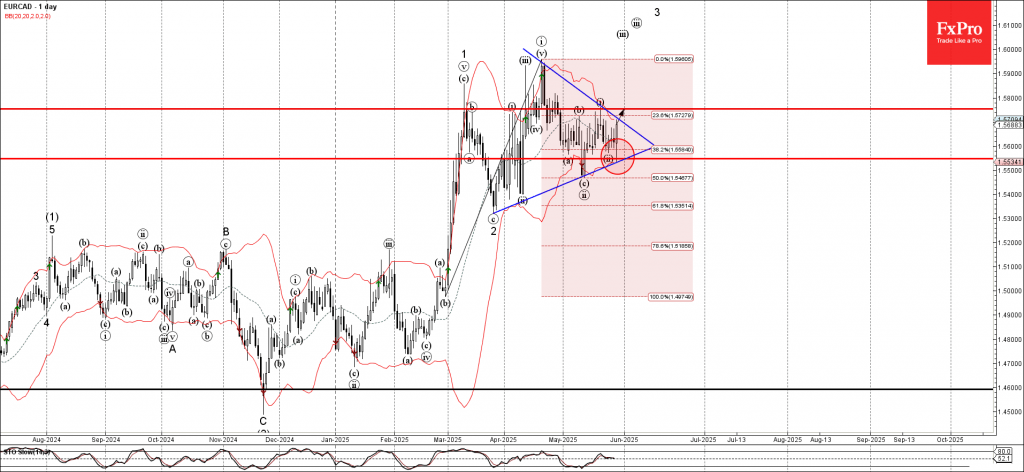
EURCAD Wave Analysis
EURCAD: ⬆️ Buy
- EURCAD reversed from the support zone
- Likely to rise to resistance level 1.5755
EURCAD currency pair recently reversed up from the support zone between the support level 1.5550 and the support trendline of the daily Triangle from March.
The support level 1.5550 was further strengthened by the lower daily Bollinger Band and by the 38.2% Fibonacci correction of the upward impulse from February.
EURCAD currency pair can be expected to rise to the next resistance level 1.5755 (top of the previous impulse wave i).
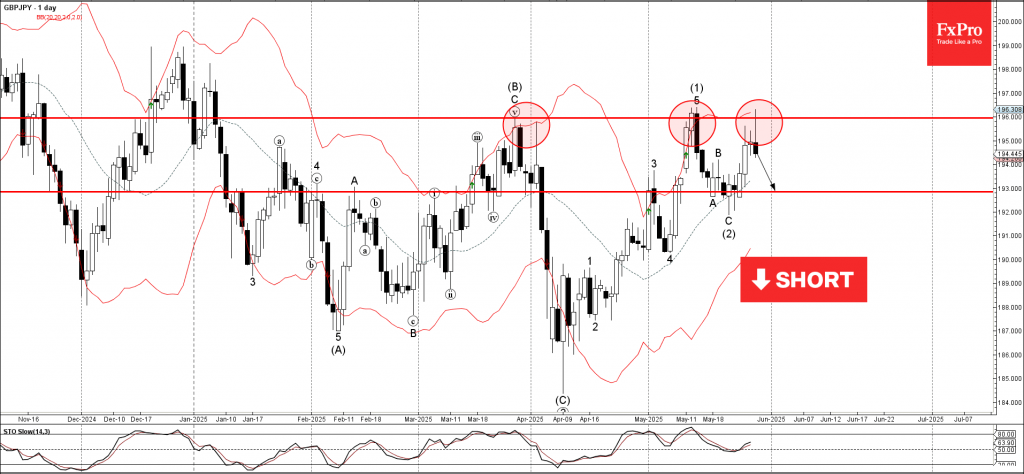
GBPJPY Wave Analysis
GBPJPY: ⬇️ Sell
- GBPJPY reversed from the key resistance level 196.00
- Likely to fall to support level 193.00
GBPJPY currency pair recently reversed down from the key resistance level 196.00(which has been reversing the price from March) intersecting with the upper daily Bollinger Band.
The downward reversal from this resistance level 196.00 created the daily Japanese candlesticks reversal pattern Shooting Star.
Given the strength of the resistance level 196.00 and the bearish divergence on the daily Stochastic, GBPJPY currency pair can be expected to fall to the next support level 193.00.
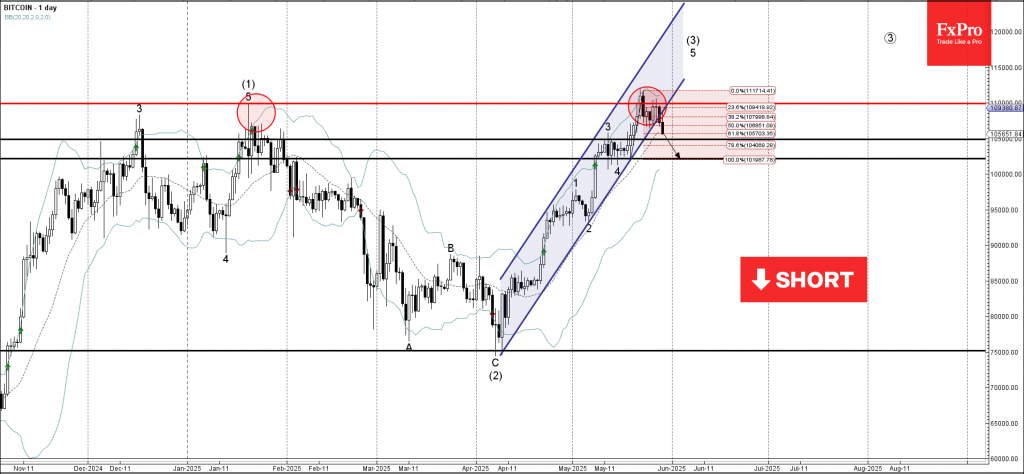
Bitcoin Wave Analysis
Bitcoin: ⬇️ Sell
- Bitcoin broke daily up channel
- Likely to fall to support level 105,000.00
Bitcoin cryptocurrency recently broke the support trendline of the sharp daily up channel from the start of April intersecting with the 50% Fibonacci correction of the upward impulse from the middle of May.
The breakout of this up channel stopped the previous impulse wave 5 of the extended upward impulse wave (3) from April.
Bitcoin cryptocurrency can be expected to fall to the next support level 105,000.00, the breakout of which can lead to further losses toward 102150,00 (low of the previous minor correction 4).
US Dollar Seesaws After Federal Court Blocks Trump’s Tariffs
There has been some violent moves around markets since yesterday's North-American session close.
Between the misstep in Nvidia’s earnings release and renewed political tensions in the U.S, markets had plenty of fuel for volatility across the board.
The USD gapped up on the news that the US Federal Court blocked the Trump's sweeping tariff policy - though volatility induces more volatility and the dollar is now the weakest currency on the day.
Trying to make sense of these moves - USD Chart
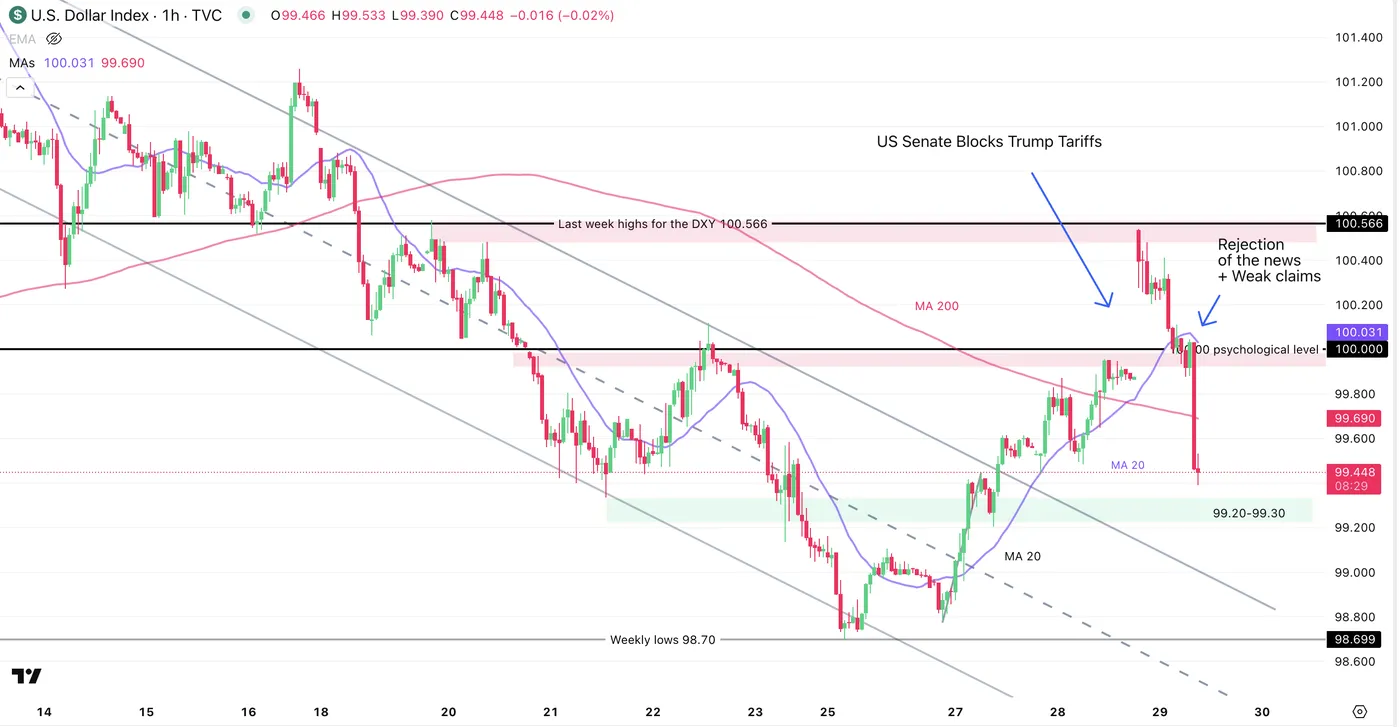
DXY 1H Chart, May 29, 2025. Source: TradingView
The Dollar has had some wild swings to pursue the year’s theme. The US Federal Court decision greatly appreciated the USD, supplemented with a beat in Nvidia Earnings.
US Index Futures rallied massively, and other major currencies initially took a beating. A broader theme of lack of confidence in the US led to some profit (or loss) booking of positions and the market selling this news.
As observed on the charts, the markets rejected last week's highs situated around the 100.50 level and quickly retested the 100.00 key level.
A market that has been downtrending may retest prices as a trend reverses, and this would have been a healthy gap close if the market did not reverse much further.
The DXY opened up 0.66% and is now down -0.44%.
The rejection got exacerbated by US Weekly Jobless Claims that came in weaker than expected (240K actual vs 230K exp) and other currencies are now enjoying from a break off USD Strength, with the Euro leading the charge.
Next support is at 99.20 to 99.30, about 100 pips away.
A return towards the MA 200 would eye at 99.70 and further reversal of the move down would hint at another retest of the 100.00 level.
DXY is trading around 99.45 right now and markets showed a indecision doji at the last hour.
Safe Trades!
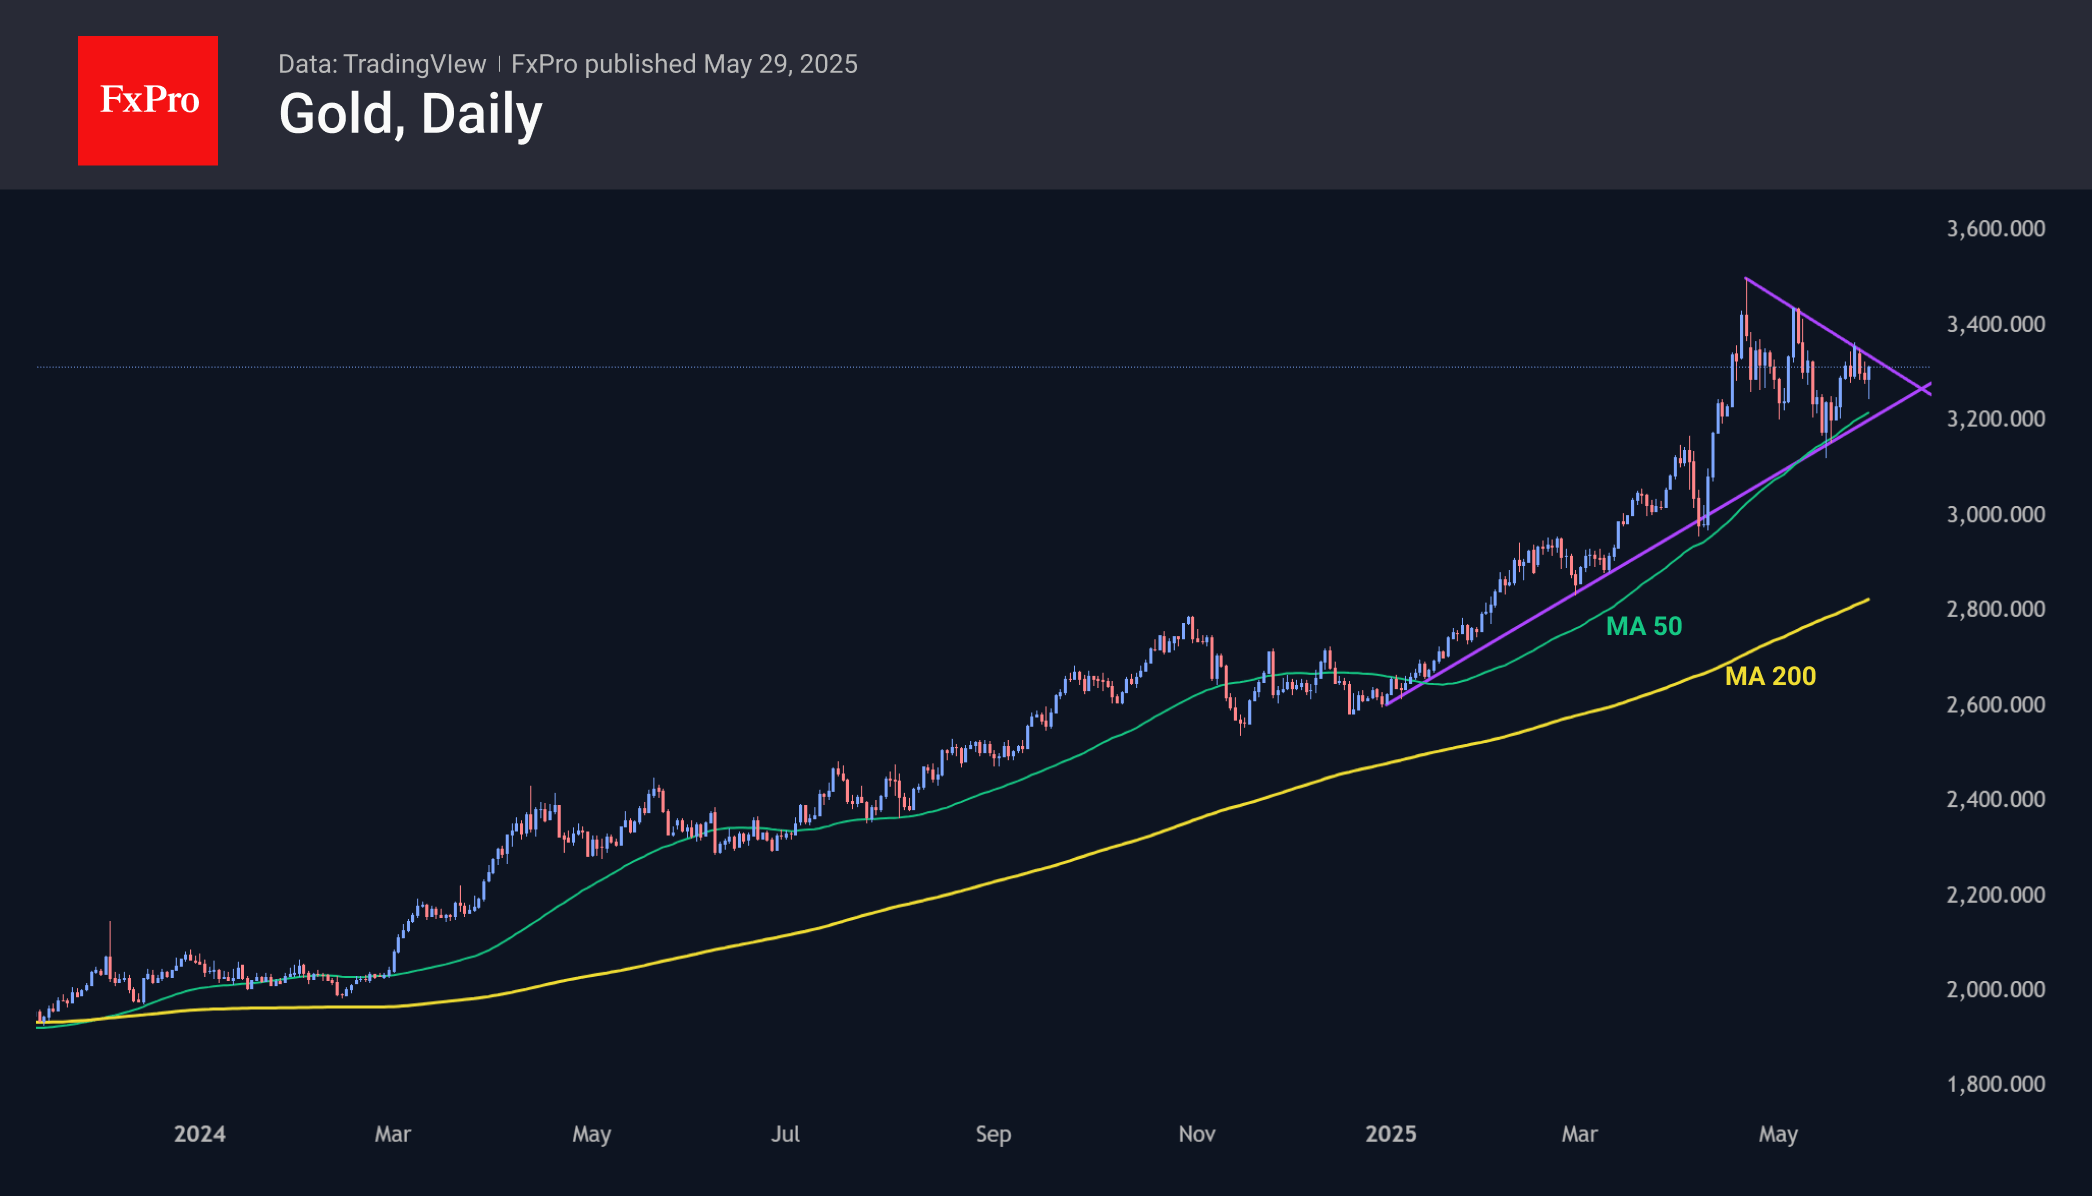
Gold Got Another Strong Bid on a Dip
Gold has been on a downward trend since the end of last week, with the sell-off peaking in the first few minutes after reports that a trade court ruled that most of Trump’s tariffs were illegal. Having fuelled risk appetite, this news triggered a sell-off in the ‘defensive asset’. The positive traction ended rather quickly as the US President’s administration appealed.
Gold managed to stay within this year’s pattern and was actively bought on an intraday dip below $3250, once again pushing the price away from the 50-day moving average. The dynamics are impressive as the price is adding about 2% to the intraday lows, reaching $3310 per ounce. In April and earlier in May, the price had already bounced off this curve, forming a sequence of higher local lows.
On the other hand, gold also has three successive lower peaks from the all-time highs in April, forming a line of downward resistance. This line is already being tested, and confirmation of its break will be a consolidation above the previous highs at $3365. It promises to be a prelude to a rise above the established historical highs at $3500.
US: A Surge in Imports Leaves a Big Mark on Q1 GDP
The second release of first quarter real GDP growth was left broadly unchanged, showing a very modest contraction of 0.2% quarter-over-quarter annualized (previously -0.3%) – a tenth below the consensus forecast. Recall, this is a notable deceleration from the 2.9% annualized rate of expansion averaged over the prior two quarters and is the first quarterly contraction in three-years.
- The slight upward revision to GDP reflected stronger investment which was partially offset by a downgrade to consumer spending.
Consumer spending rose 1.2% (previously 1.8%), or roughly a third of the rate of expansion in the prior quarter. The downgrade was largely due to softer services spending (2.2% from 2.7%).
Non-residential fixed investment rose 10.4% (previously 9.8%), with a surge in equipment spending (24.7%) accounting for the bulk of the gain – reflecting companies ramping up purchases ahead of the tariffs. Investment in intellectual property products (+4.6%) was also healthy, rising at the fastest annualized pace in a year.
Residential investment was revised to a small contraction of 0.6% (previously +1.3%).
The bulk of the pullback in GDP came from net exports. Imports surged by 42.6%, largely owing to a strong gain in goods imports (53.3%). Meanwhile, exports rose by a more modest 2.4%, resulting in net trade subtracting 4.9 percentage points (pp) from headline growth. Roughly half of the uptick in imports showed up in inventory investment, which added 2.6pp to Q1 GDP.
Government spending contracted by 0.7%, as outlays from both federal defense (-7.1%) and non-defense (-1.2%) declined.
Final sales to private domestic purchasers – the best gauge of underlying domestic activity – expanded by a healthy 2.5%.
Real Gross Domestic Income (GDI) also contracted by 0.2% in the first quarter. Corporate profits fell 11.3% annualized or $118 billion after accounting for inventory valuation and capital consumption adjustments. However, this was partially offset by another solid gain in employee compensation (5.4%), which accounts for roughly two-thirds of total national income.
Key Implications
The second estimate of first quarter real GDP did not change the underlying narrative. Economic growth was heavily weighed down by a surge in import activity, as businesses scrambled to pull forward purchases ahead of the tariffs. Looking through the import shock, underlying domestic demand remained reasonably healthy, but this too likely captures behavior shifts related to tariffs in investment and consumer purchases, such as autos.
As of May 28th, the U.S. Court of International Trade struck down all of President Trump's tariffs related to the International Emergency Economic Powers Act, including the Canada/Mexico/China fentanyl tariffs, the universal 10% tariffs currently in effect and the delayed reciprocal tariffs that were slated to come back into effect as of July 9th. The court ruling has no impact on sectoral tariffs, including the steel & aluminum and auto related tariffs. While the administration has already said that they plan to appeal the ruling, timelines remain unclear. At the very least, yesterday's announcement weakens the U.S. position in trade talks that were underway with more than a dozen nations, most notably the EU and China.
Of the Q2 data released, there's only moderate evidence that domestic spending has slowed in response to heightened trade uncertainty. But the pullback in Q1 corporate profits – the largest quarterly decline since Q4'2020 – is a warning sign that firms were coming under pressure, and this was before the bulk of the tariffs had even come into effect. Tomorrow's release of the April personal income and spending will provide a more fulsome snapshot of how the consumer fared last month, and whether there's any evidence of a softening in discretionary spending trends.
EUR/USD Mid-Day Outlook
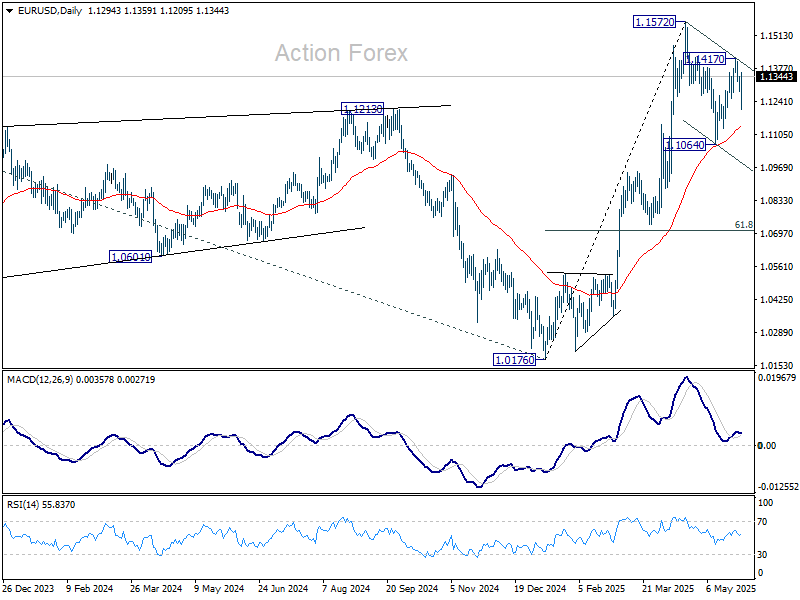
Daily Pivots: (S1) 1.1268; (P) 1.1307; (R1) 1.1329; More...
Intraday bias in EUR/USD is turned neutral again with current recovery. On the upside, break of 1.1417 resistance will revive the case that correction from 1.1572 has completed at 1.1064. Retest of 1.1572 should then be seen next. Nevertheless, break of 1.1209 will extend the corrective pattern and target 1.1064 support and possibly below.
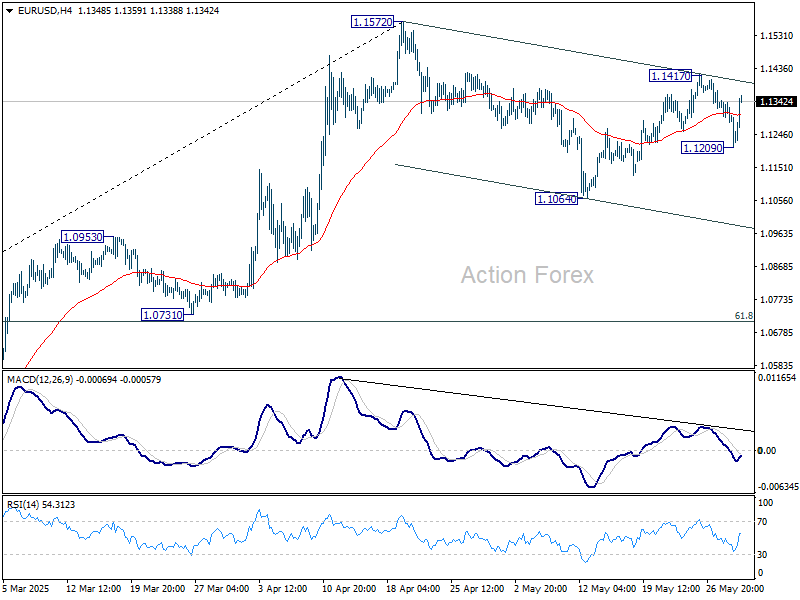
In the bigger picture, rise from 0.9534 long term bottom could be correcting the multi-decade downtrend or the start of a long term up trend. In either case, further rise should be seen to 100% projection of 0.9534 to 1.1274 from 1.0176 at 1.1916. This will remain the favored case as long as 55 W EMA (now at 1.0858) holds.