Sample Category Title
EURUSD Elliott Wave : Forecasting the Rally From the Equal Legs Area
Hello fellow traders. In this technical article we’re going to look at the Elliott Wave charts of EURUSD forex pair published in members area of the website. As our members know, we are long in the pair, as explained in our previous technical article . The pair has recently given us pull back against the 1.10625 low and found the buyers precisely at the equal legs area as we expected. In the following text, we’ll explain the Elliott Wave analysis and present target areas.
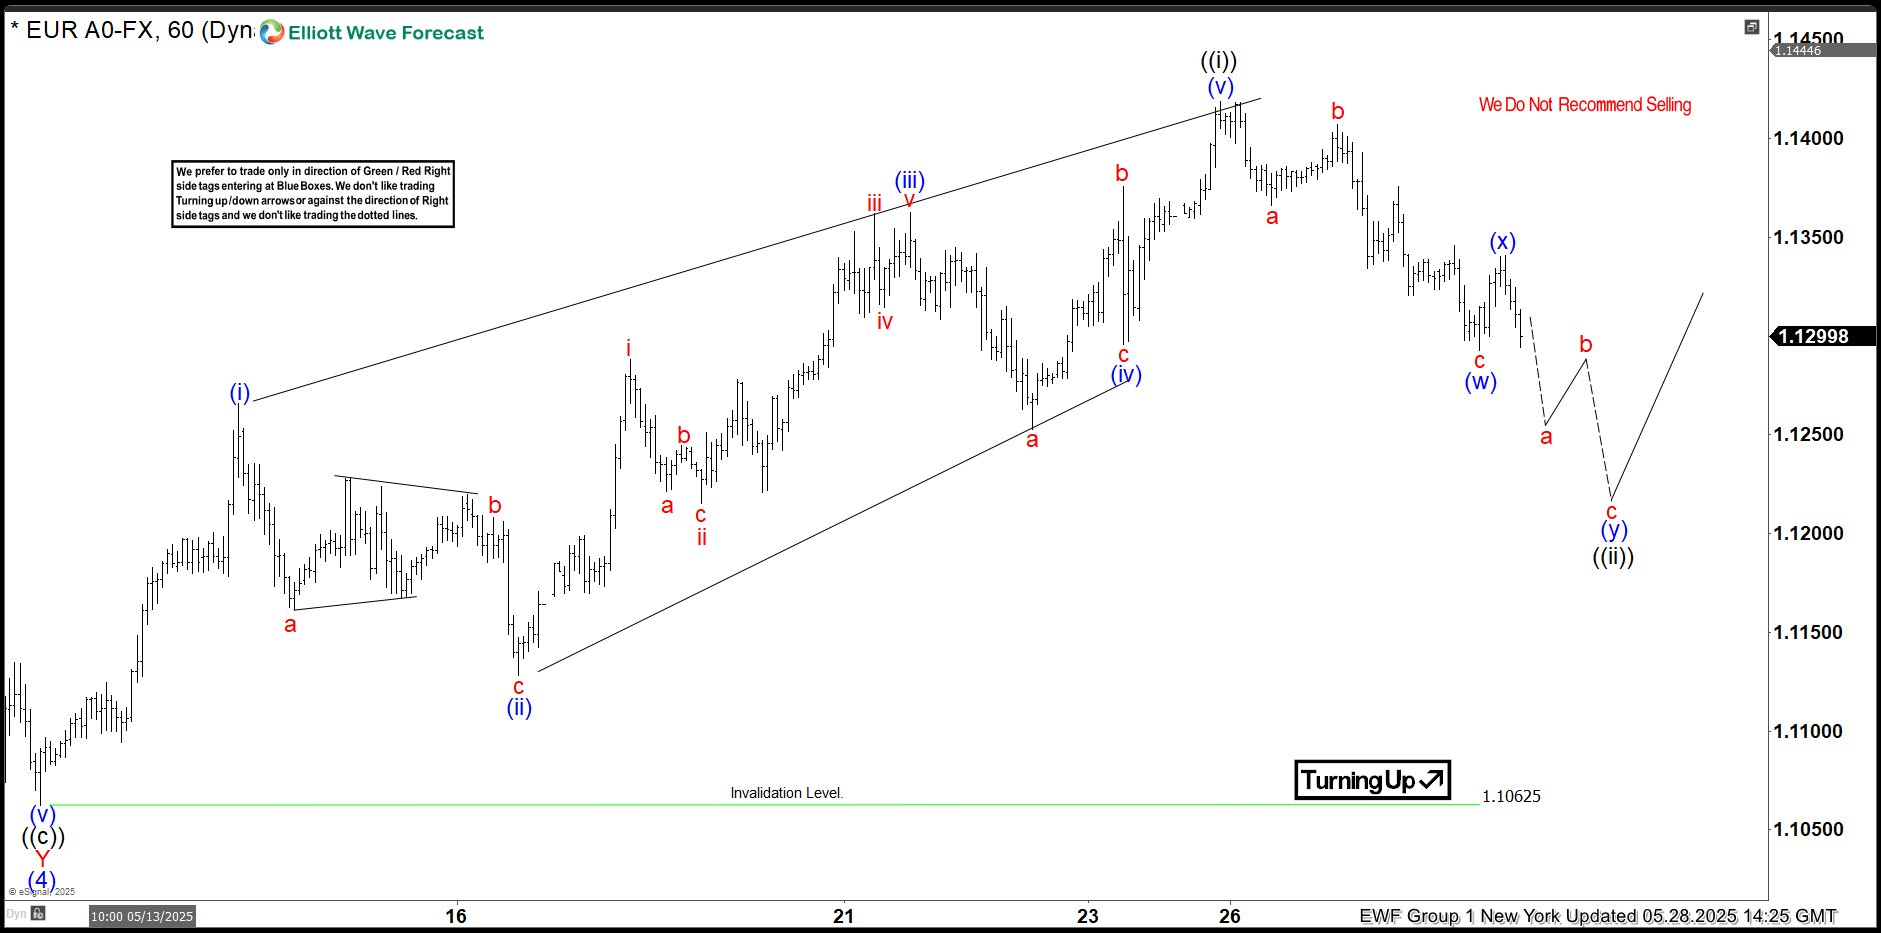
EURUSD Elliott Wave 1 Hour Chart 05.28.2025
EURUSD is currently forming a three-wave pullback against the 1.10625 low. The correction appears incomplete and is unfolding as a double three pattern — (w)-(x)-(y). Our members are aware that we can pinpoint the potential reversal area by measuring the Equal Legs zone, where wave (y) is related to wave (w). This zone aligns with the 1.1215 area. We expect buyers to emerge within this region and anticipate a continuation of the rally.
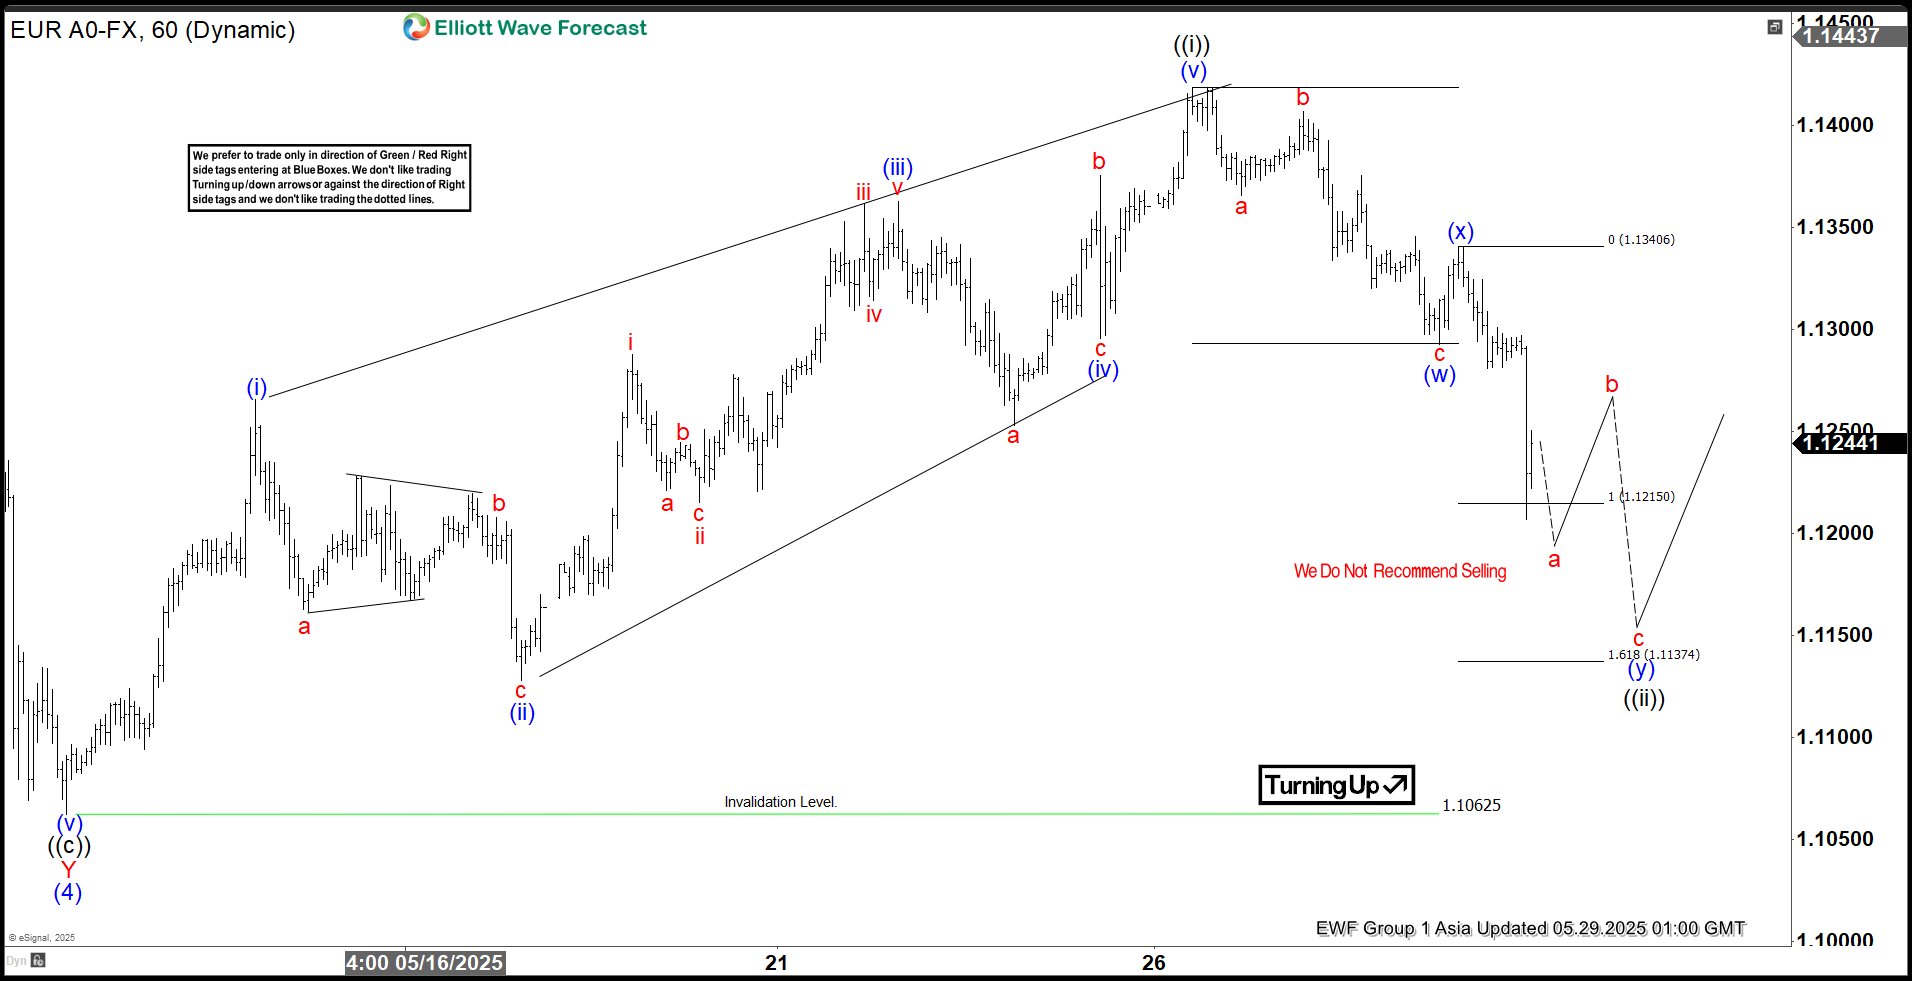
EURUSD Elliott Wave 1 Hour Chart 05.29.2025
The pair has reached our target area. While there is still a possibility of another short-term low within this zone, we do not recommend selling. The minimum requirements for a completed structure are already in place, and a reversal to the upside could occur at any moment.
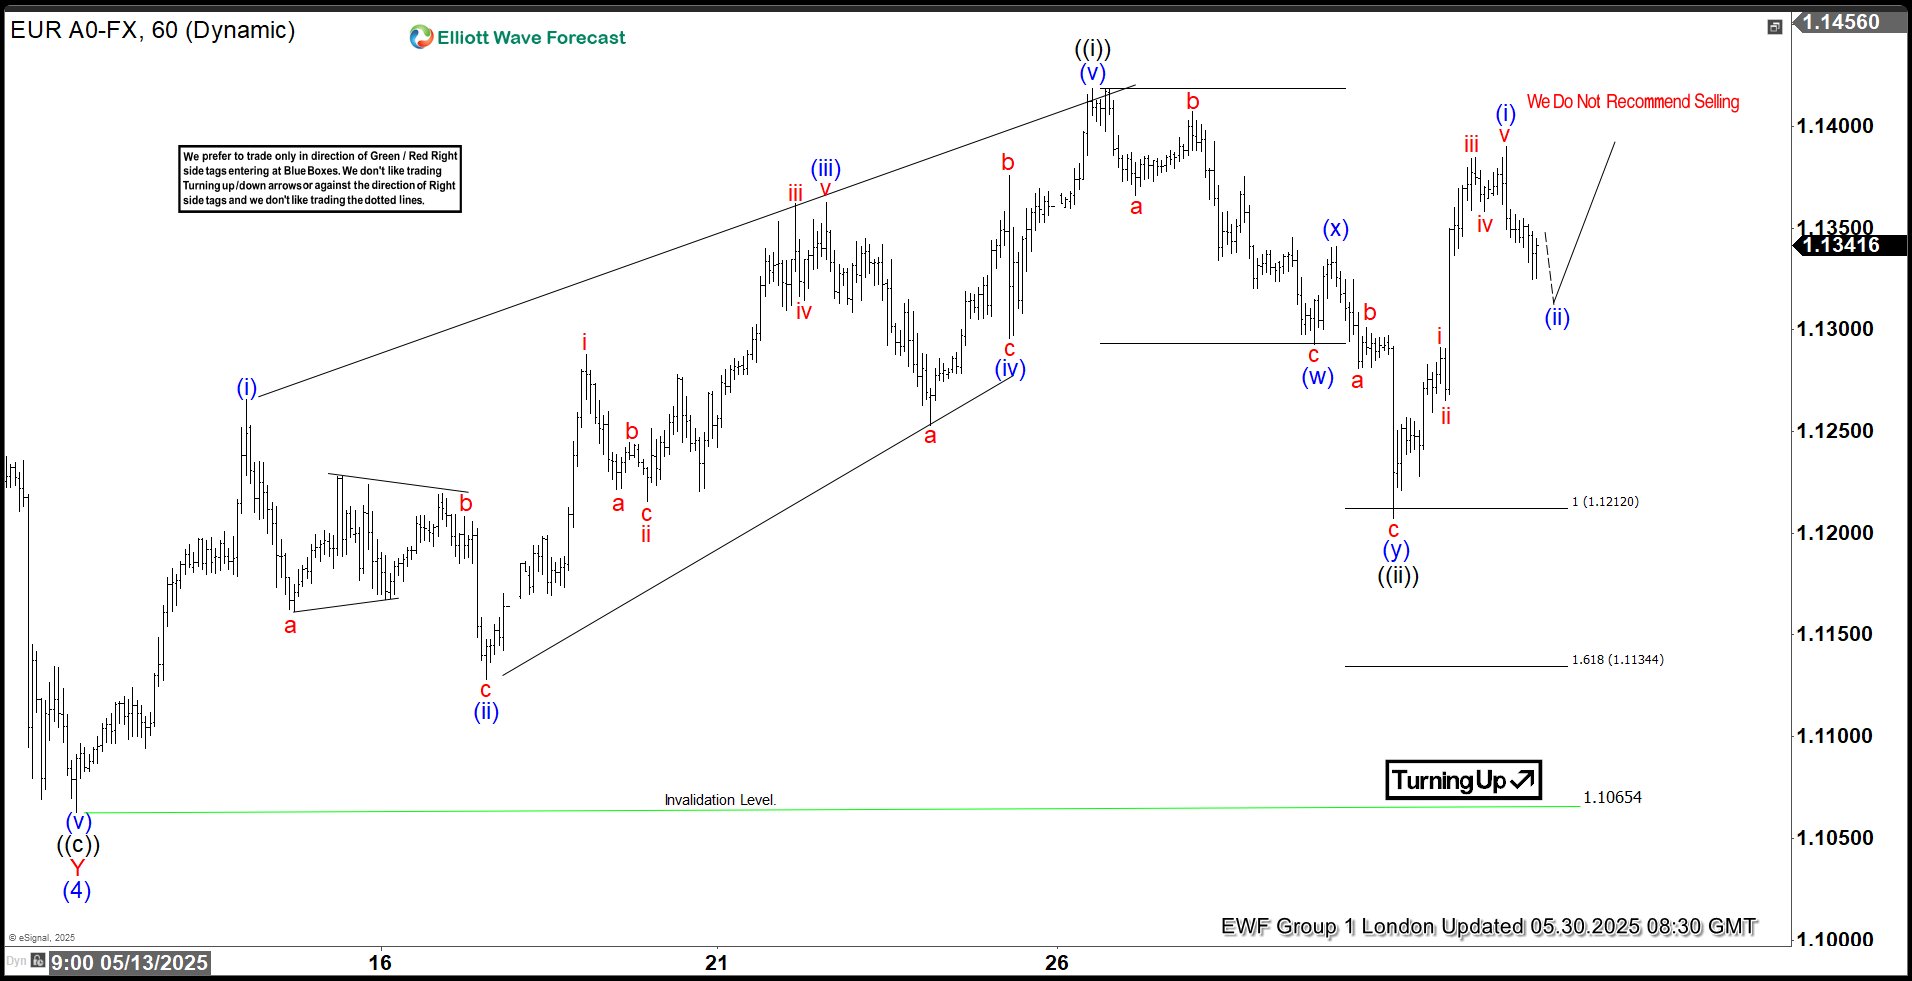
EURUSD Elliott Wave 1 Hour Chart 05.30.2025
The pair found buyers as expected in the Equal Legs area and has delivered a decent rally so far. We now look for a break above the May 26th peak to confirm a further extension to the upside toward the 1.1558 area.
Dollar Completes Rebound, Returning to Long-Term Decline
The US dollar reinforced the importance of support, bouncing early in the week from levels near 98.7. The dollar has been bought out of this area for the past seven weeks, preventing the dollar from rewriting three-year lows. The dollar was oversold, and we regarded the rise as a technical bounce.
The 50-day moving average acted as a stop to the rebound, emphasising its technical nature. Fundamentally, the de-escalation of the US trade conflict with the European Union stopped the ‘sell America’ trade. The Court’s ruling on the illegality of reciprocal tariffs lifted USD to the highs of the previous ten days. Lower tariffs reduce the risks of the US economy stagflation, as fiscal stimulus will boost GDP, and inflation will remain under Fed control. This scenario could still materialise, restoring interest in the depreciating US dollar and lagging equities.
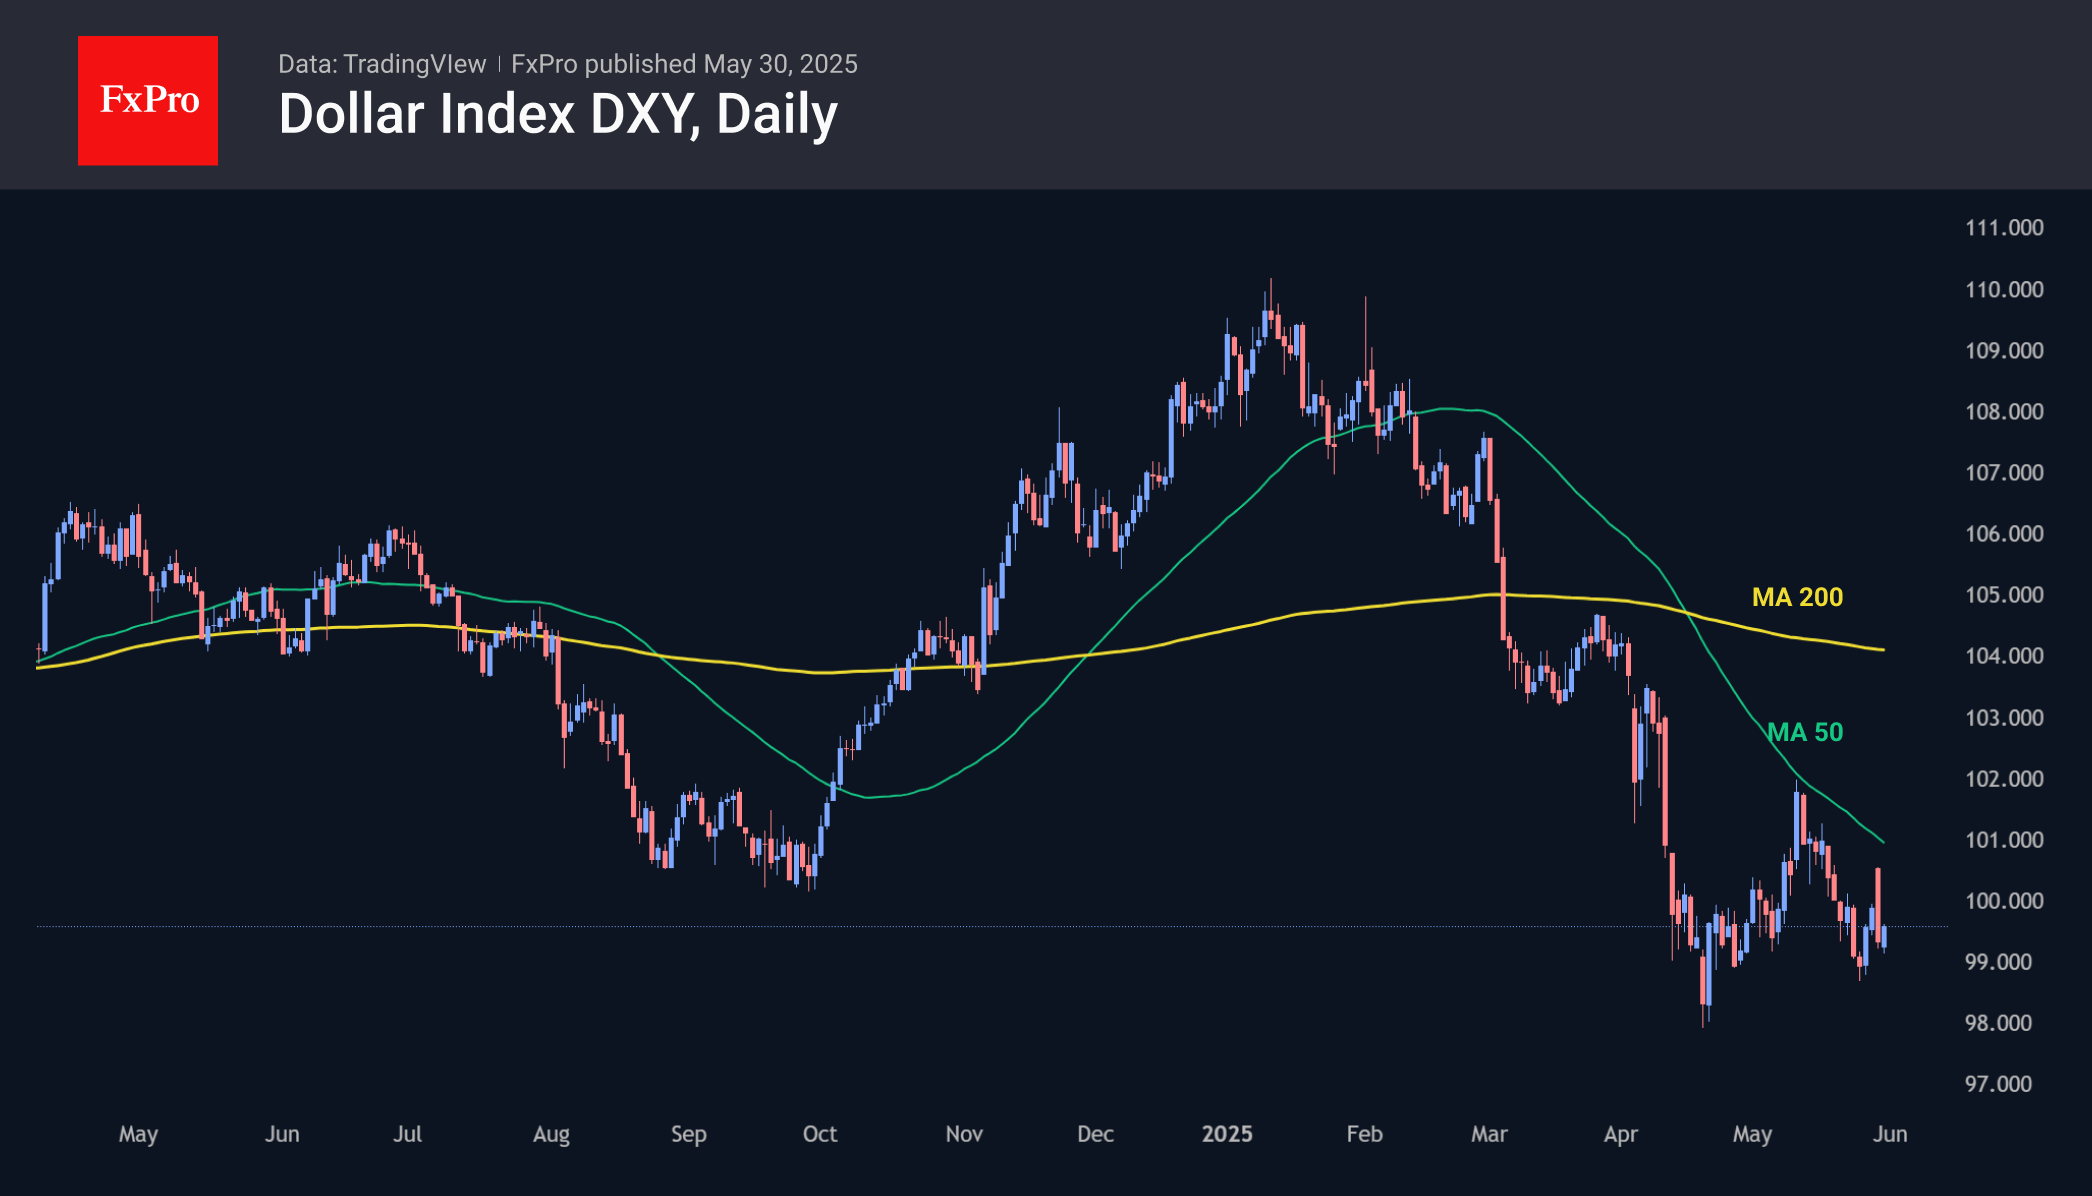
But so far, the market has not gone above the 50-day moving average, bumping up against an appeals court decision to put tariffs back in place for the duration of the litigation. History suggests that a further renewal of the lows usually follows a rebound after a strong dollar decline. Therefore, one should be prepared for further drawdown of the dollar index to 95 (consolidation of early 2022) or even 89-90 (pivot area of 2018 and 2021).
More decline may follow after the recent technical rebound
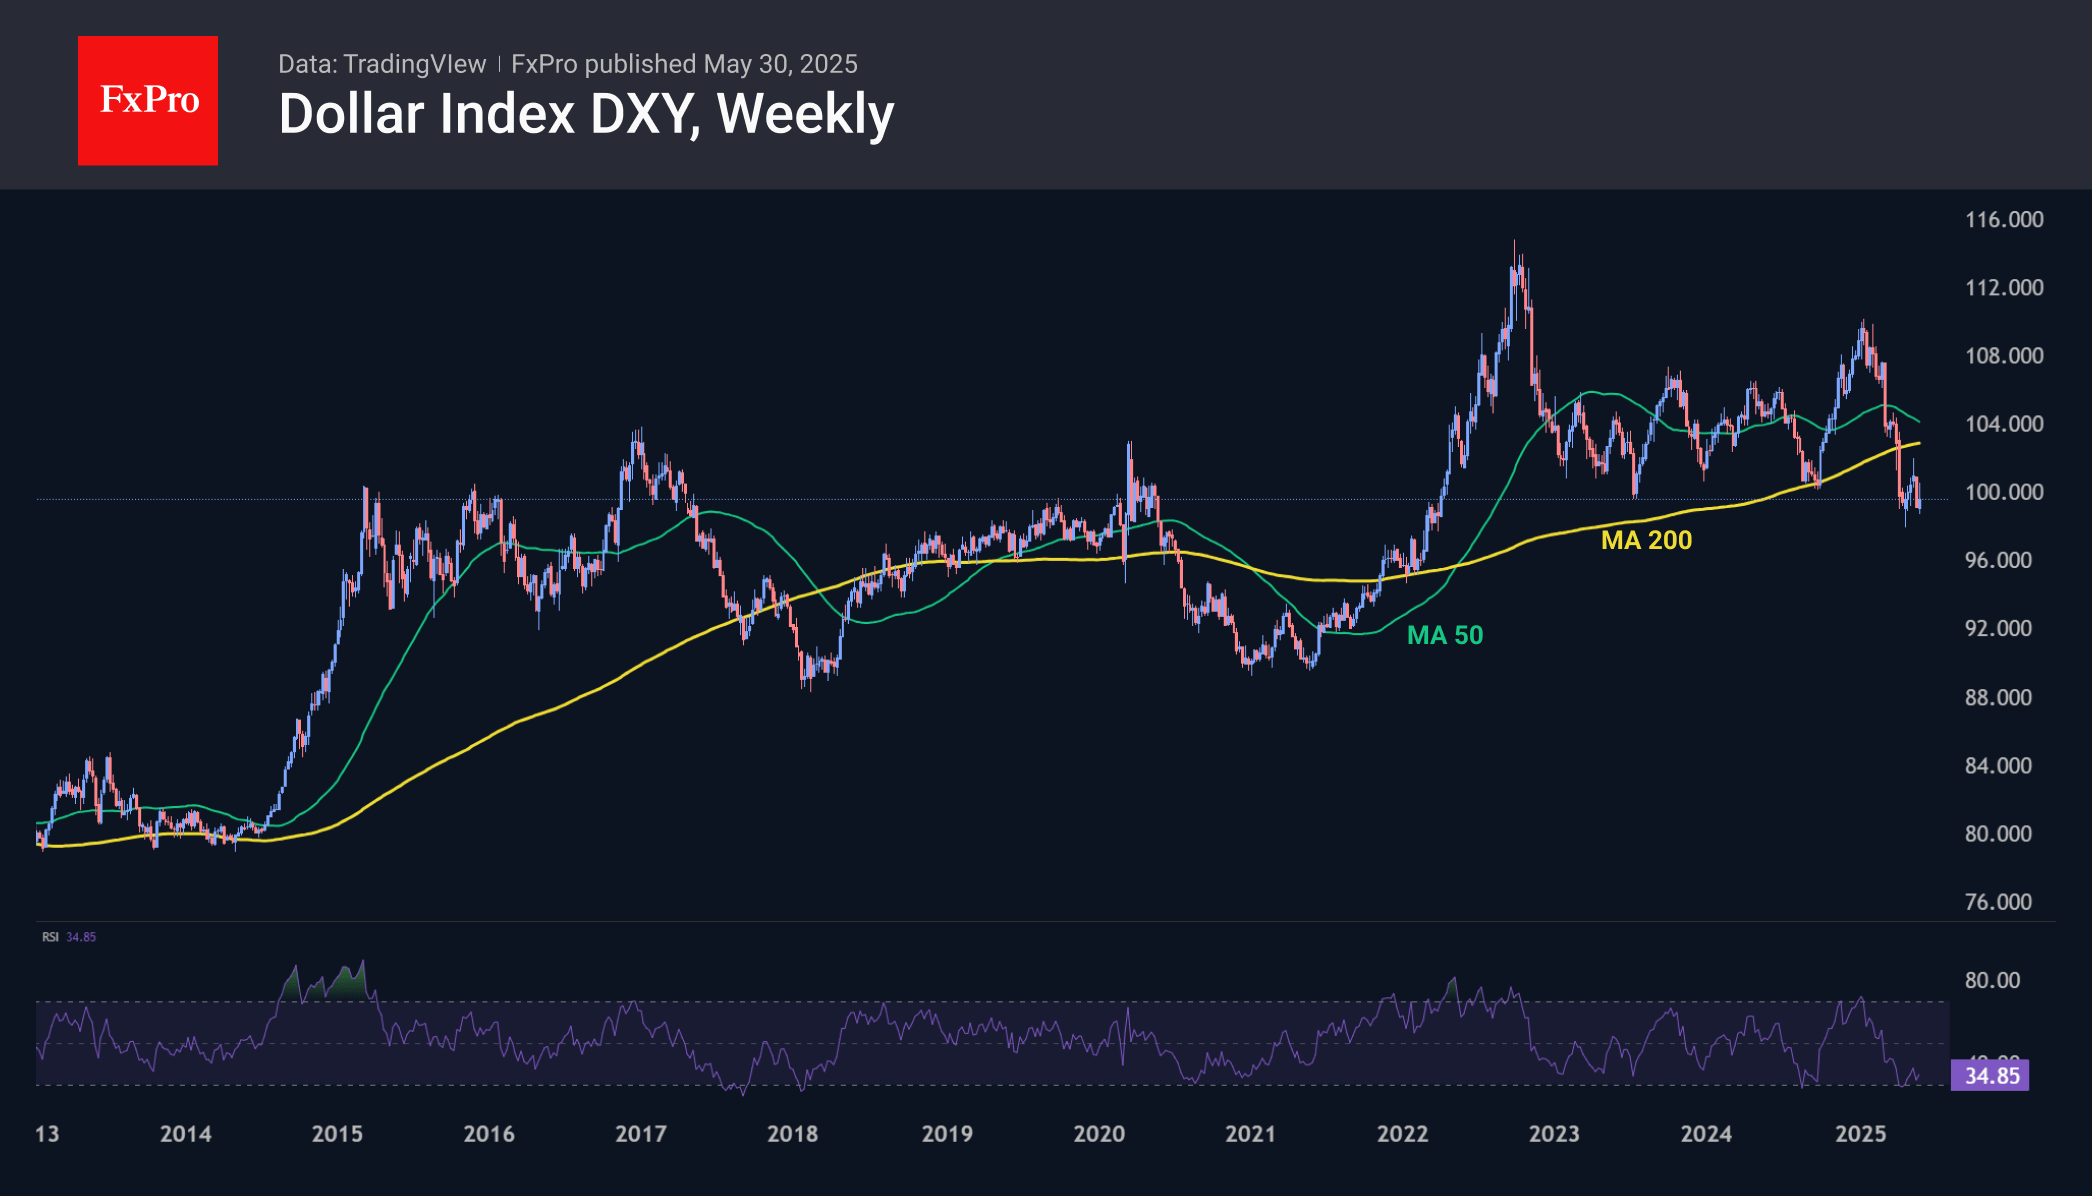
We can only consider a failure to 80, which was last seen in 2014, if serious problems in the US economy force the Fed to ease rates combined with optimism in other parts of the world, which would be a repeat of the situation of the early 2000s.
That said, we remain fearful of the unlikely scenario of selling pressure on US bonds due to distrust in Washington’s fiscal policy. We are much more optimistic about the chances of a managed USD weakening due to a looser Fed policy than its peers, simultaneously depreciating nominal debt and boosting economic growth due to less traction in savings.
ECB’s Panetta signals diminished room for further rate cuts
Italian ECB Governing Council member Fabio Panetta said today that while the central bank has made meaningful progress in easing monetary policy, bringing the deposit rate down from 4% to 2.25%, "the room for further rate cuts has naturally diminished".
"However, the economic outlook remains weak, and trade tensions could lead to a deterioration," he added. "It will be essential to maintain a pragmatic and flexible approach, considering liquidity conditions and the signals coming from financial and credit markets."
Panetta also highlighted the high-stakes nature of ongoing trade talks between the EU and the US, warning that even tensions are likely to have a “significant impact” on the region’s economy.
Bitcoin Pushes Back, Altcoins Lose More
Market Picture
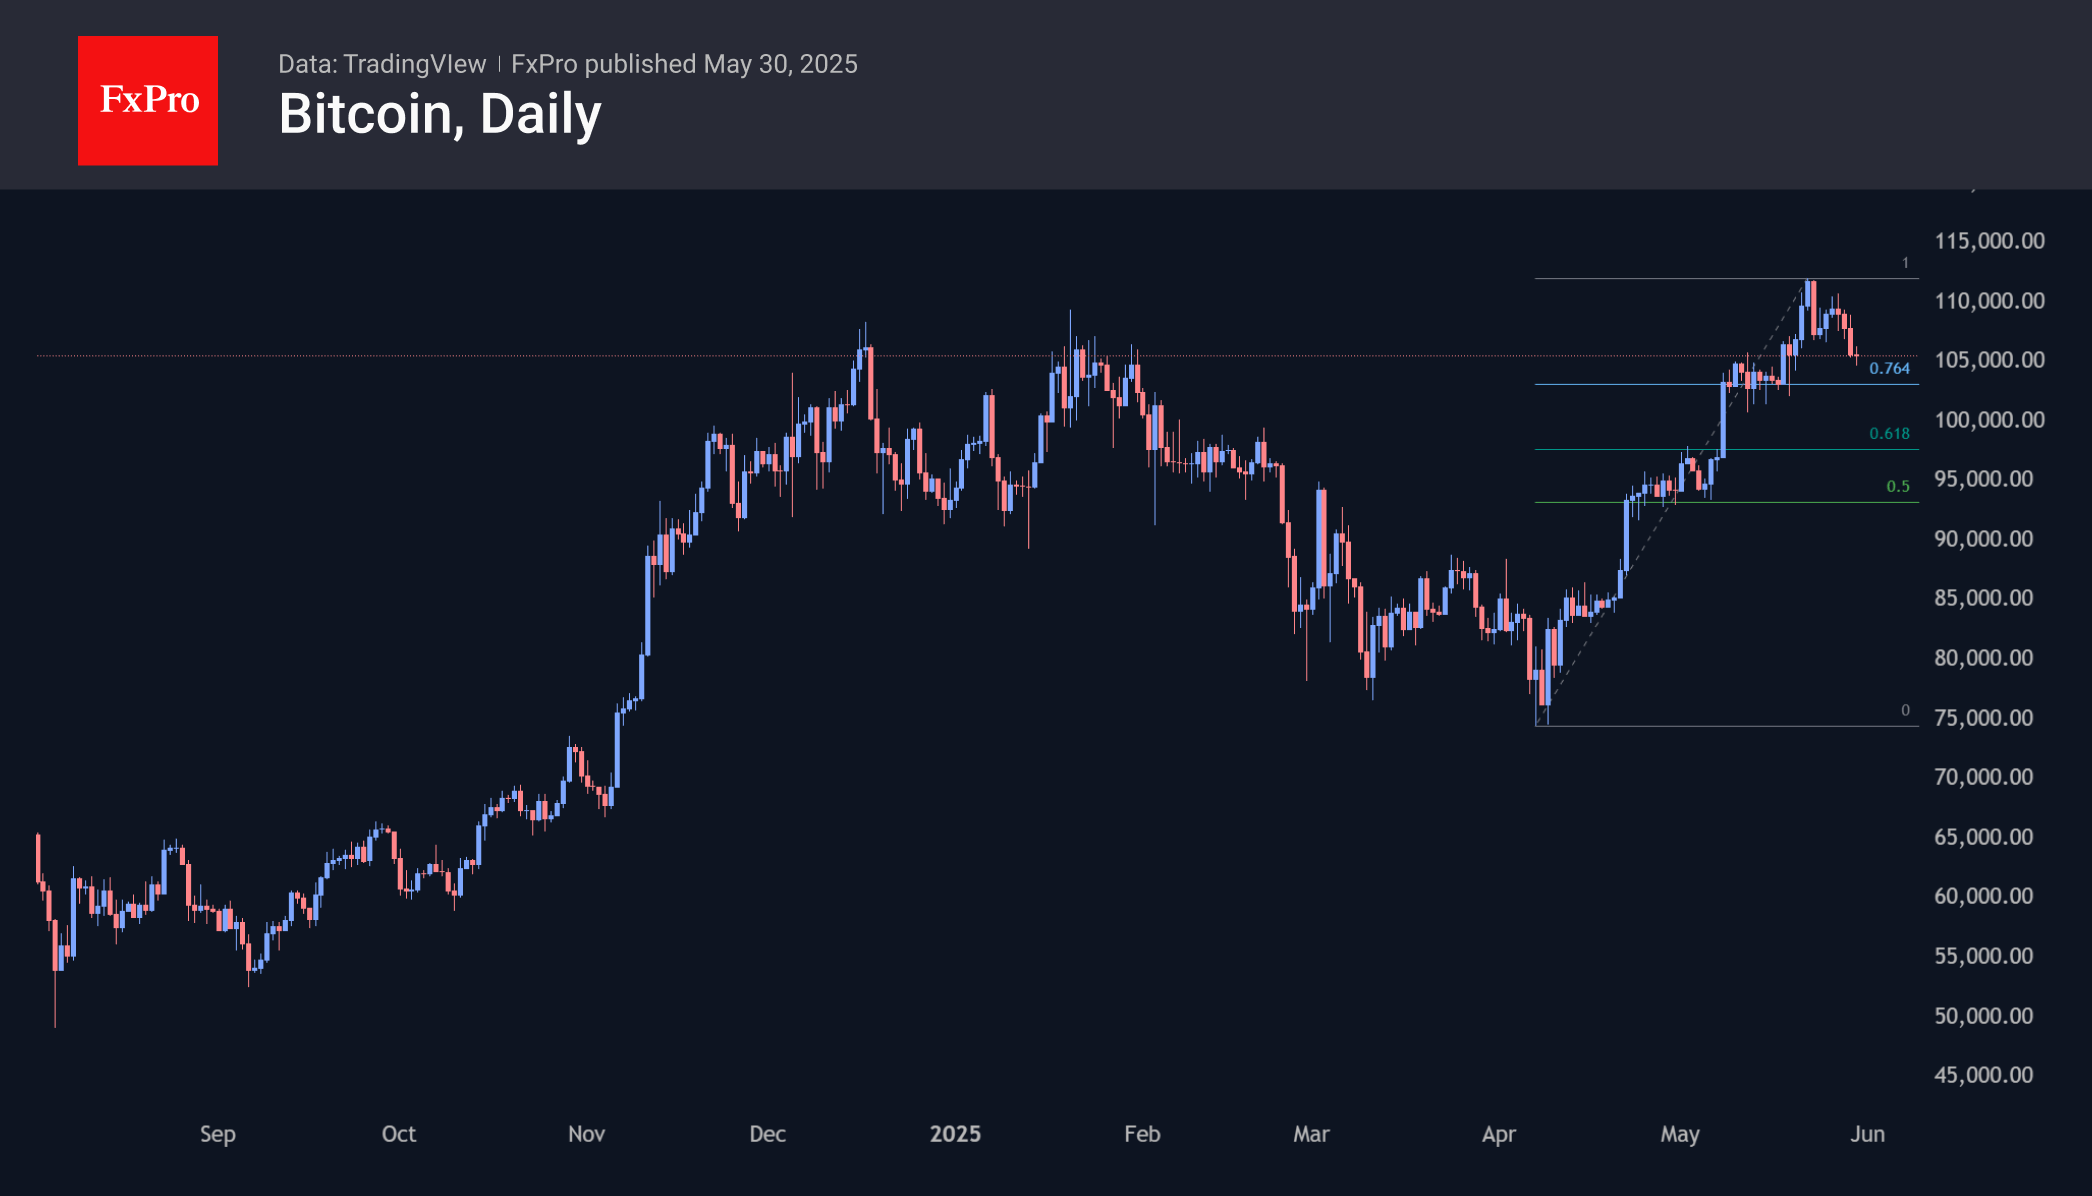
Market capitalisation is down 2.2% today and more than 4.6% in seven days to $3.34 trillion. Bitcoin’s fluctuations are creating briefly higher volatility in older altcoins: BTC’s 1.7% decline contrasts with ETH’s 3.5% drop, XRP’s 4% weakening, SOL’s 4.6% decline and Doge’s 8.5% pullback.
Bitcoin was down to $104.7K on Friday morning, stabilising at $106.0K by the start of active European trading, showing a fourth day of declines. Technically, a pullback down to $103K would fit into a technical correction. Even a failure to $99K would formally satisfy the Fibonacci retracement pattern. However, even 103 looks like a strong enough local support for the coming days.
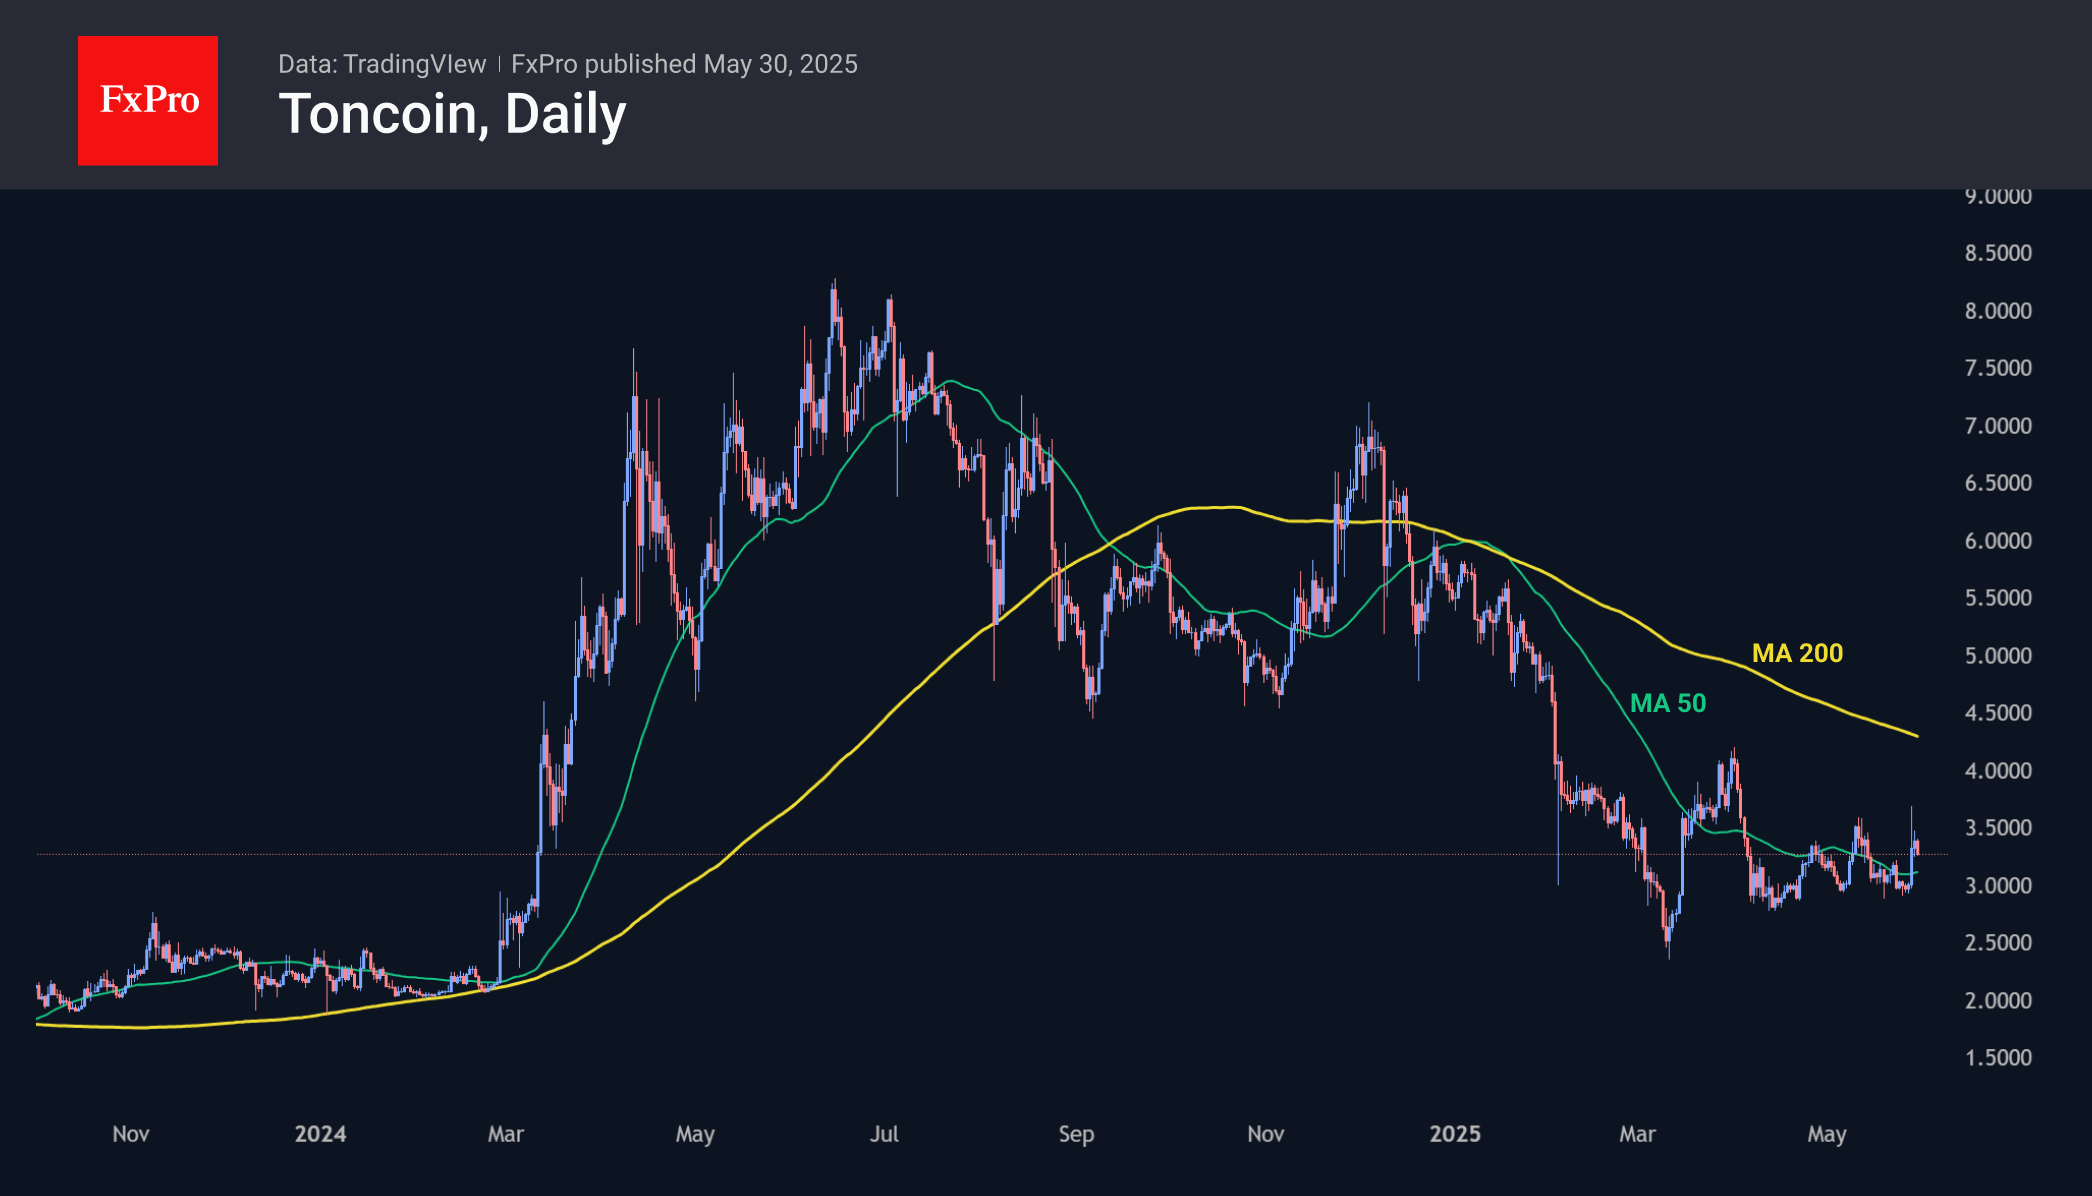
The successful Telegram bond offering allowed TON to swim against the market, adding 0.5% in one day and 5% in seven days to $3.11. The rebound from multi-month highs has no significant obstacles until $4.20, where the early April peak and the 200-day moving average combine.
News Background
Volmex warns of a possible increase in Bitcoin’s price on 30 May, when $10.1 bn worth of BTC options will expire on the Deribit platform.
Coindesk noted that wallet owners with balances exceeding 10,000 BTC have shifted from buying to selling, while investors with smaller positions continue to accumulate BTC. In recent days, whales have started depositing Bitcoins back into exchange accounts, which is usually associated with preparing for sales.
BTC is benefiting from a capital flight from the gold market. Over the past five weeks, precious metal-focused specialised exchange-traded funds have lost around $2.8bn. In contrast, bitcoin-ETFs have raised $9bn over the same period.
The derivatives market is showing increasing leverage among investors. Since April, the volume of open interest in Bitcoin futures has increased by 51%, while options have increased by 126%.
Two companies, StablR and Oobit, backed by Tether, introduced stablecoins in Europe that are compliant with the EU’s Cryptocurrency Regulation Act (MiCA). The launch follows the withdrawal of the issuer of the ‘stablecoin’ USDT from the European market due to non-compliance with the MiCA law.
Gold Ends the Week Lower as Risk Appetite Returns
The price of gold fell below 3,300 USD per troy ounce on Friday, closing the week with a loss of approximately 1%.
Key drivers behind gold’s movement
Investors remain cautious ahead of today’s US PCE inflation report, which could offer fresh clues on potential Federal Reserve rate adjustments.
On Thursday, gold prices gained nearly 1% after an appeals court temporarily upheld tariffs imposed during Donald Trump’s presidency. This followed a ruling by a US trade court a day earlier, which had blocked the tariffs, deeming their implementation unlawful.
San Francisco Fed President Mary Daly reiterated that the Fed could still deliver two rate cuts this year, as projected in March. However, she emphasised that rates must hold steady for now to achieve the 2% inflation target.
Gold faced volatility in May as global risk sentiment improved, reducing demand for safe-haven assets. Hopes of a resolution in US trade disputes spurred investors back into equity markets.
Technical analysis: XAU/USD
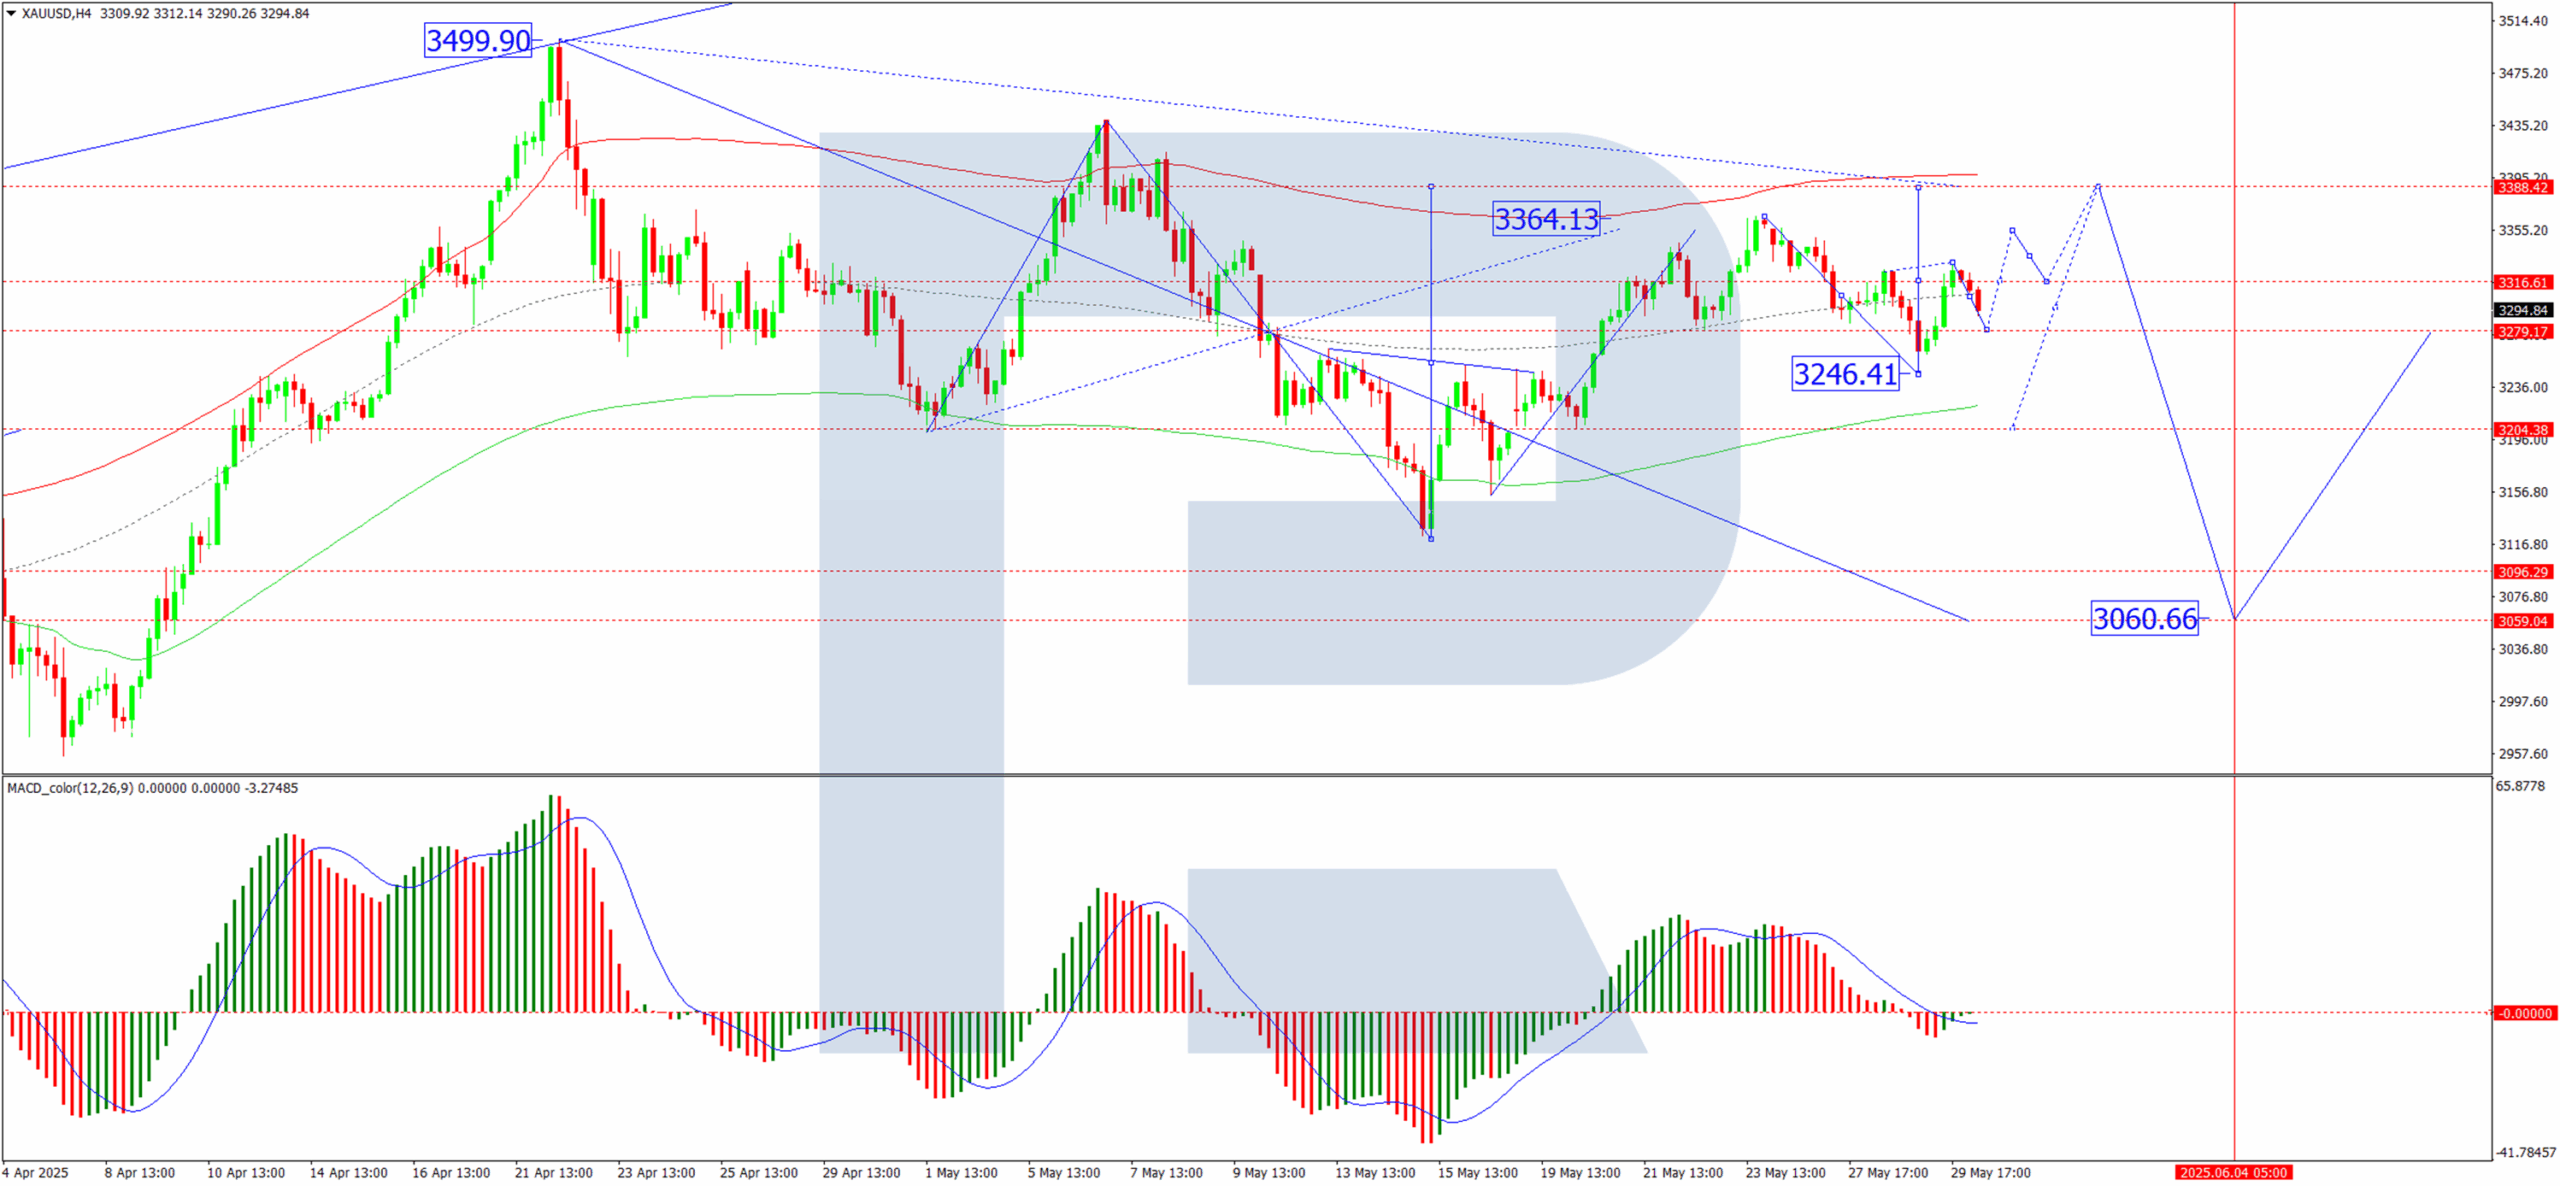
H4 Chart:
- The market completed a correction wave to 3,246, followed by an upward impulse to 3,331
- Currently, a downward pullback towards 3,280 is forming, with consolidation around 3,320
- A downside breakout could extend losses to 3,200, while an upside breakout may fuel a rally towards 3,388, exhausting the bullish wave
- A subsequent downtrend towards 3,060 is anticipated
- MACD confirmation: The signal line has exited the histogram zone, indicating a firm upward trend
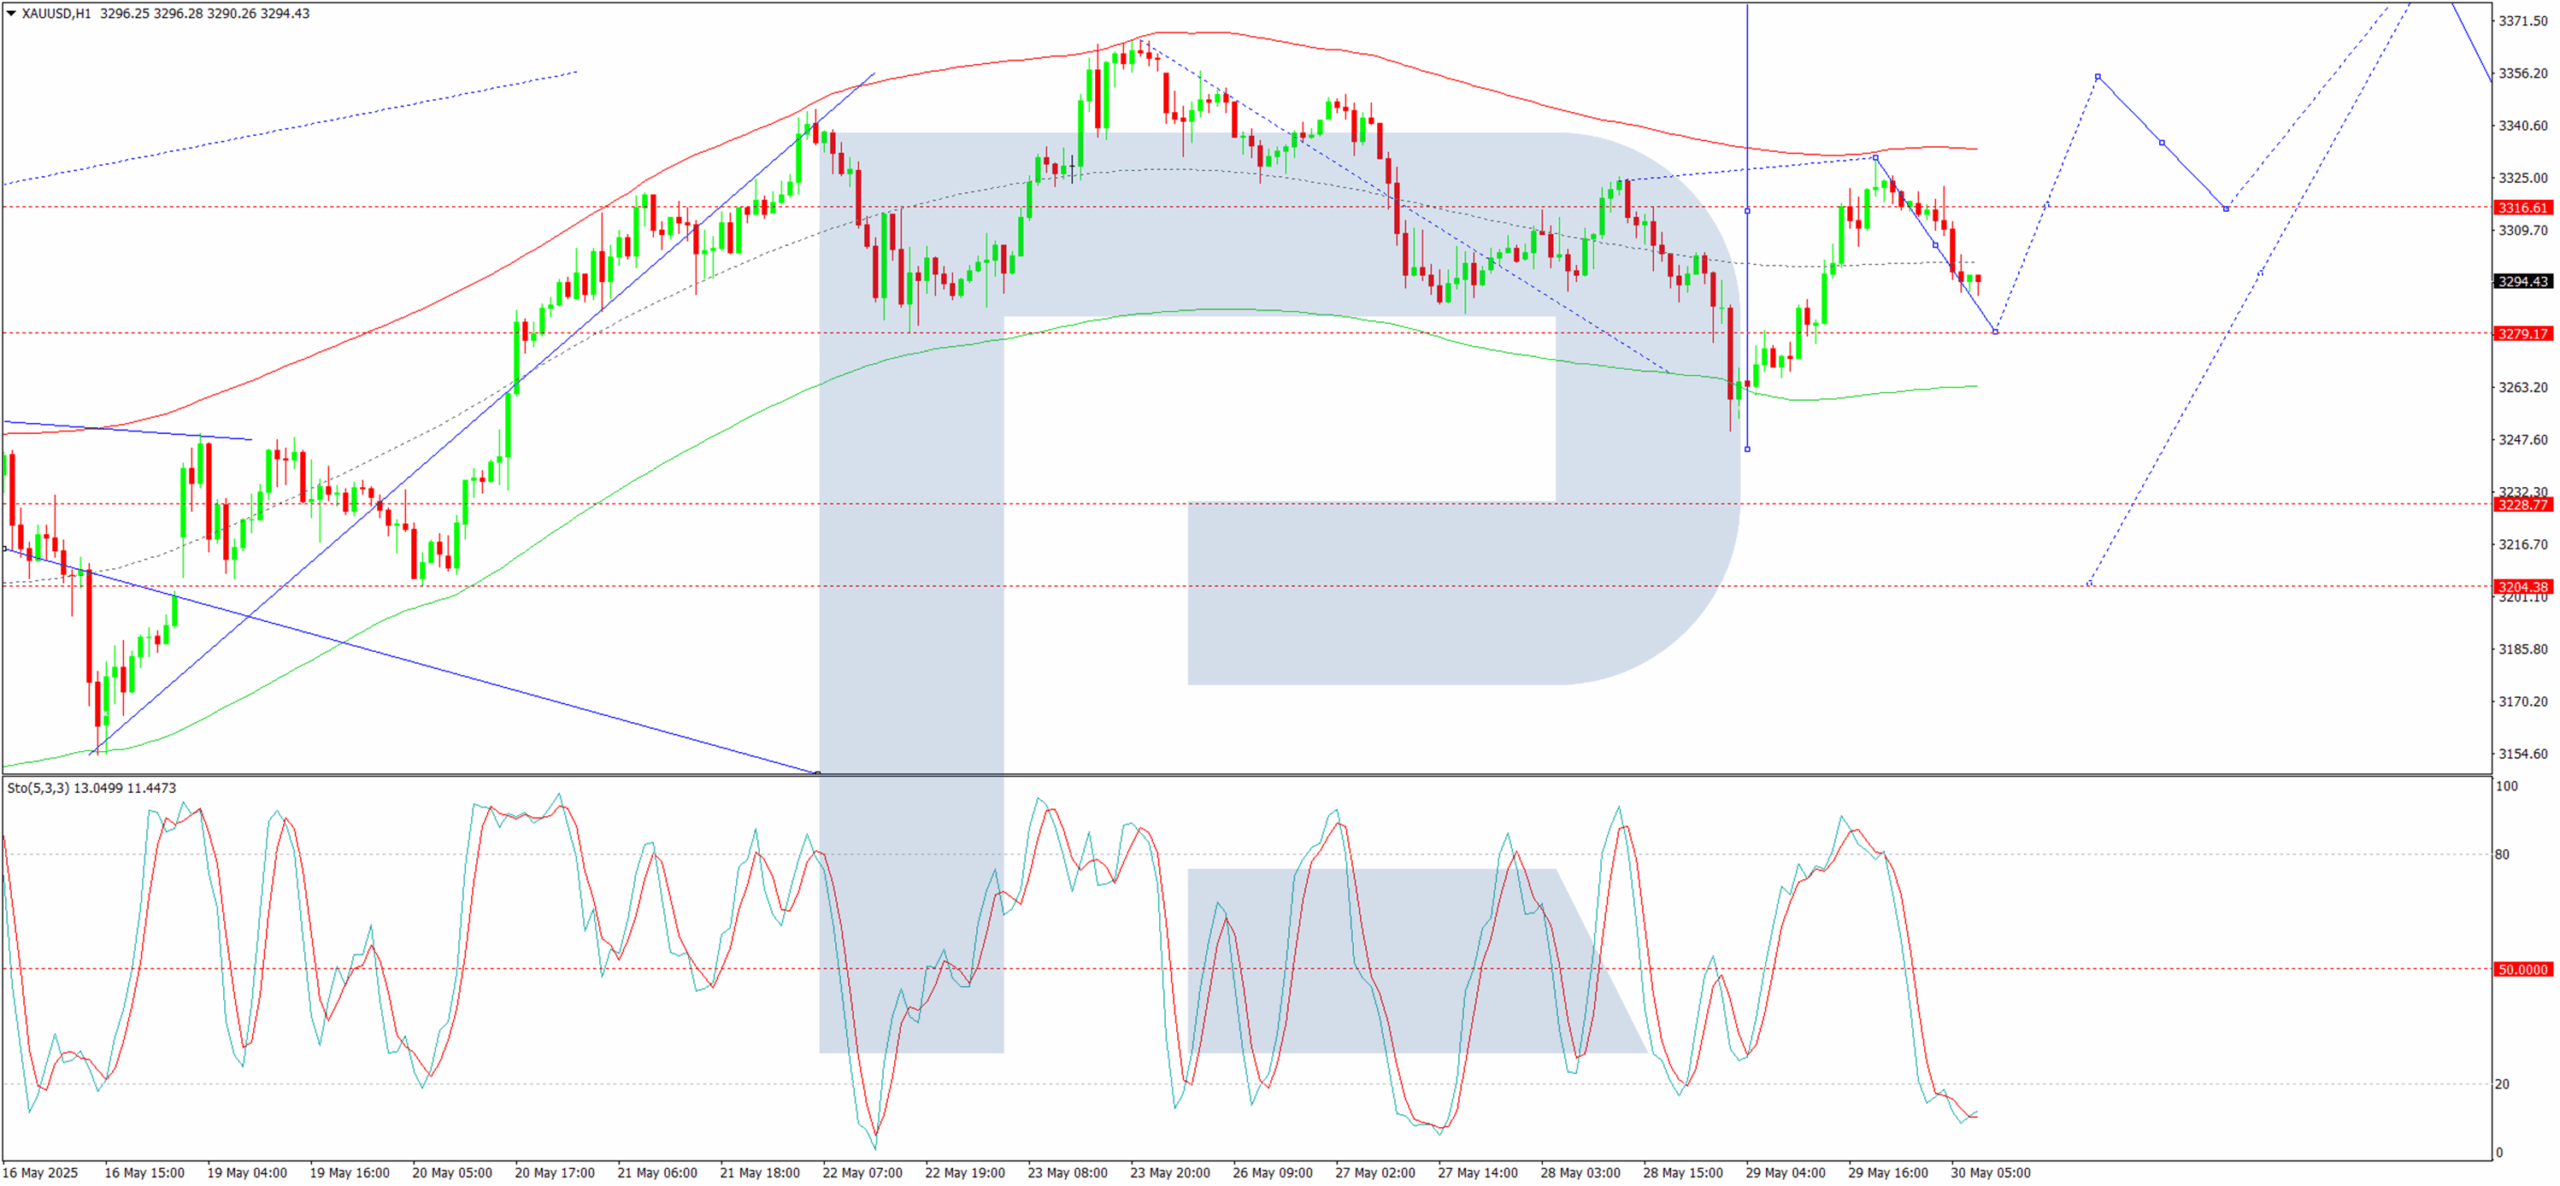
H1 Chart:
- The upward wave to 3,331 has concluded, with a correction to at least 3,255 expected today
- Thereafter, another upswing towards 3,355 (potentially extending to 3,388) may follow, although this is viewed as a corrective pullback within the broader downtrend
- Once complete, a new decline towards 3,222 (possibly 3,060) is likely
- The stochastic indicator supports this view: The signal line is below 20, rising sharply towards 80
Conclusion
Gold’s near-term direction hinges on breakouts from the current range, with technical indicators suggesting further volatility ahead.
BoE’s Taylor: Global headwinds justify lower monetary policy path
BoE MPC member Alan Taylor reinforced his dovish position in an interview with the Financial Times, highlighting growing downside risks to the UK economy from global developments.
Taylor, who alongside Swati Dhingra voted for a larger 50bps rate cut in May, argued that monetary policy should be on a “lower policy path” given the accumulating headwinds.
He specifically pointed to impact of Trump’s tariffs on imports would “be building up over the rest of this year in terms of trade diversion and drag on growth”.
While UK inflation unexpectedly jumped to 3.5% in April, Taylor downplayed the significance of the rise, attributing it to "one-time tax and administered price changes."
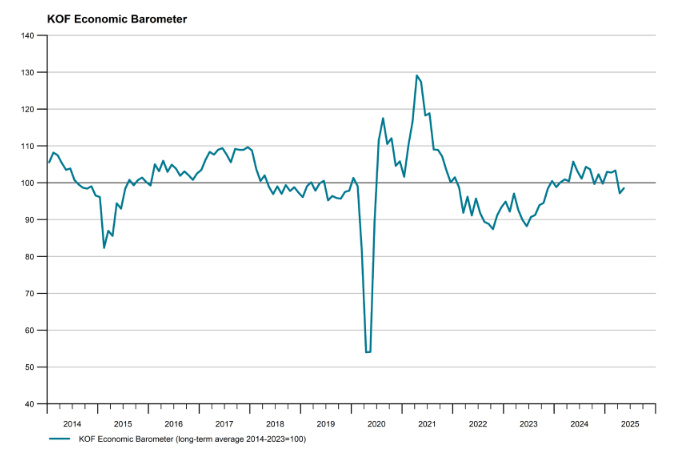
Swiss KOF rises to 98.5, but growth outlook remains subdued
Switzerland’s KOF Economic Barometer edged up to 98.5 in May from 97.1, marking a modest improvement in economic sentiment. While the uptick is a positive signal, the barometer remains below its long-term average, suggesting that the broader outlook for the Swiss economy "remains subdued".
According to the KOF, the manufacturing sector showed notable strength, contributing to the overall improvement. However, indicators tied to foreign demand and private consumption remain under pressure, highlighting the ongoing drag from weak external conditions and cautious domestic spending.
XAU/USD Chart Analysis: Gold Price Stabilises Around $3,300
Throughout May, a turbulent news backdrop — involving both international trade tariffs and armed conflicts — led to the formation of a peak around $3,430 and a low near $3,130 on the XAU/USD chart. As of today, the price per ounce stands around $3,300 — roughly the same level as at the beginning of the month.
This suggests that supply and demand forces are largely balanced, keeping the price contained between these extremes. The XAU/USD chart provides further confirmation, emphasising the significance of the $3,300 level.
Technical Analysis of the XAU/USD Chart
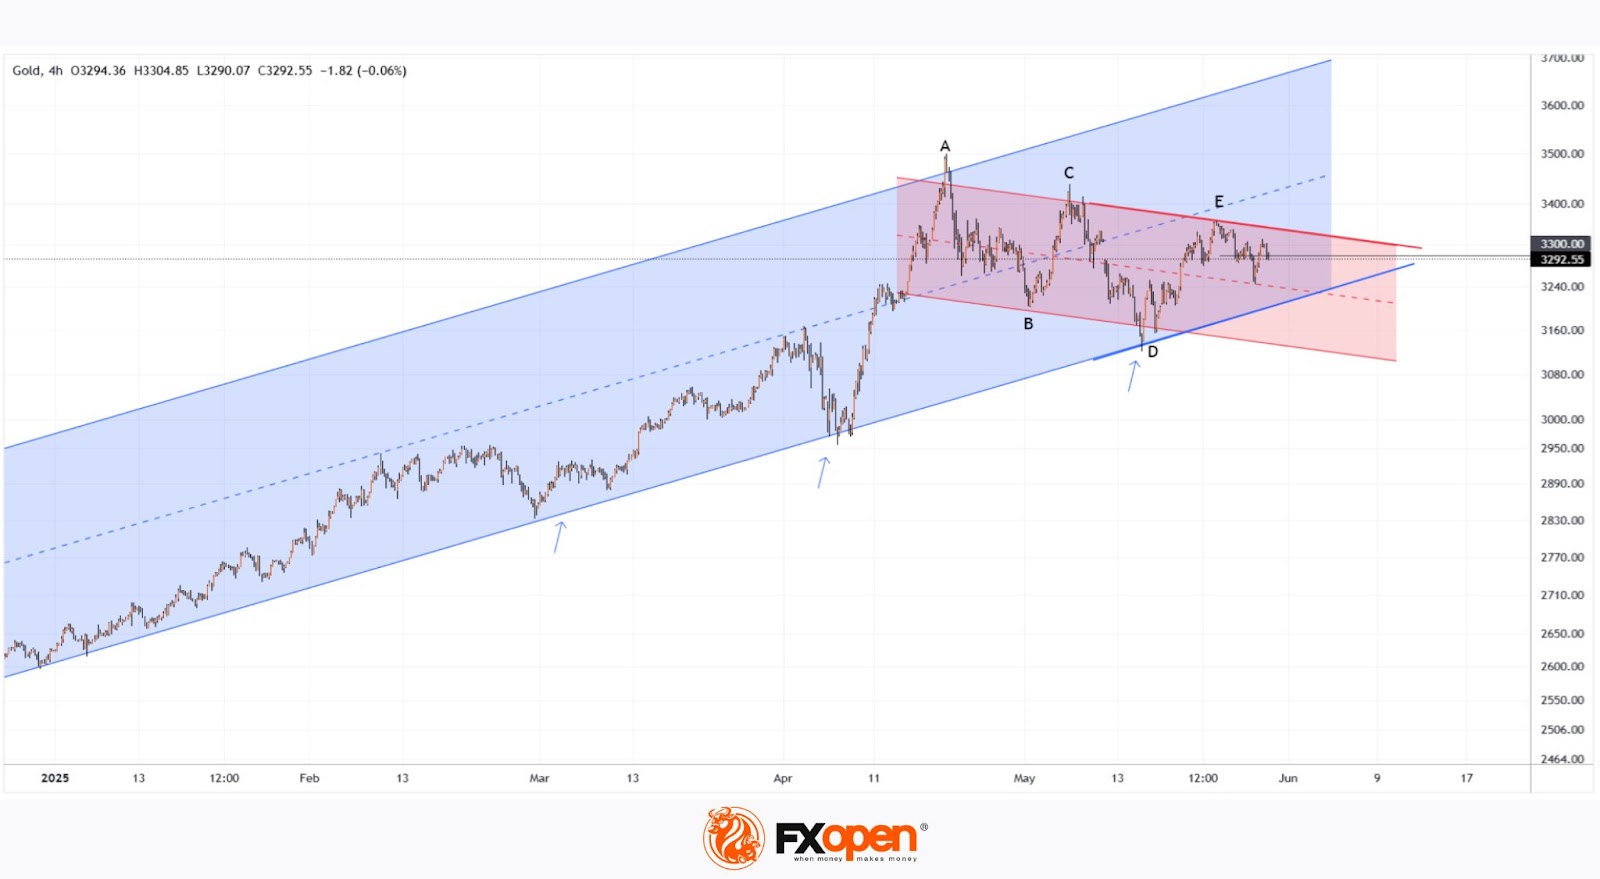
From a bearish perspective: The A→B→C→D→E sequence forms lower highs and lower lows — a clear sign of a downtrend. This trajectory is marked in red, with the upper line acting as resistance.
From a bullish perspective: Since the beginning of 2025, the gold price has been moving in an uptrend,indicated by a blue channel, with its lower boundary serving as key support (highlighted with arrows).
Notably, these support and resistance lines are converging, forming a narrowing triangle — an indication that supply and demand are balancing, finding consensus around the $3,300 level, where the axis of the triangle lies.
Given this, it is reasonable to assume that in June, the gold price on the XAU/USD chart may continue to fluctuate within this triangle — unless an extraordinary event causes a significant shift in the current balance.
Start trading commodity CFDs with tight spreads. Open your trading account now or learn more about trading commodity CFDs with FXOpen.
This article represents the opinion of the Companies operating under the FXOpen brand only. It is not to be construed as an offer, solicitation, or recommendation with respect to products and services provided by the Companies operating under the FXOpen brand, nor is it to be considered financial advice.
EUR/USD Daily Outlook
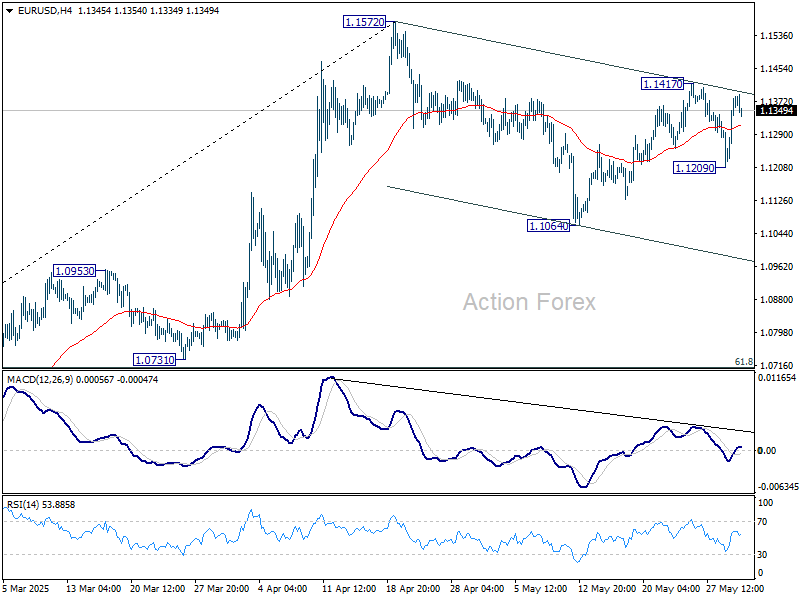
Daily Pivots: (S1) 1.1258; (P) 1.1322; (R1) 1.1432; More...
Intraday bias in EUR/USD stays neutral for the moment. On the upside, break of 1.1417 resistance will revive the case that correction from 1.1572 has completed at 1.1064. Retest of 1.1572 should then be seen next. Nevertheless, break of 1.1209 will extend the corrective pattern and target 1.1064 support and possibly below.
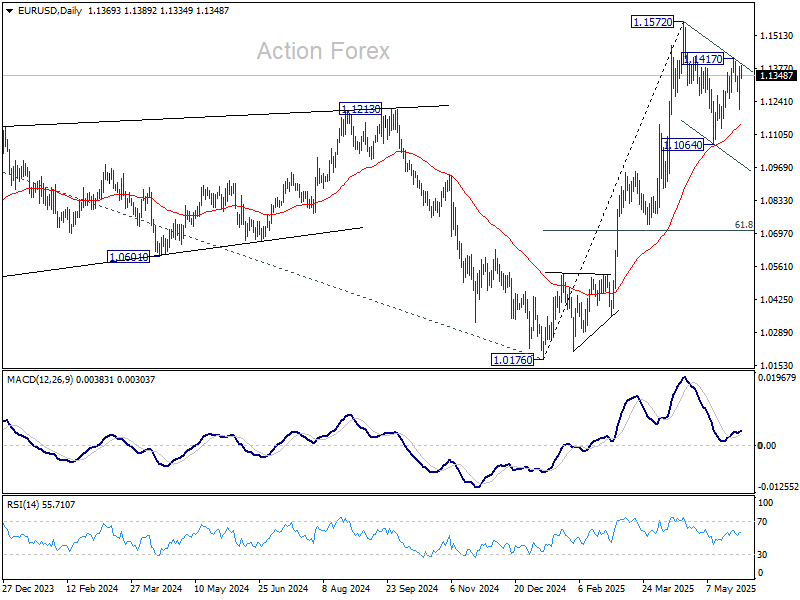
In the bigger picture, rise from 0.9534 long term bottom could be correcting the multi-decade downtrend or the start of a long term up trend. In either case, further rise should be seen to 100% projection of 0.9534 to 1.1274 from 1.0176 at 1.1916. This will remain the favored case as long as 55 W EMA (now at 1.0858) holds.
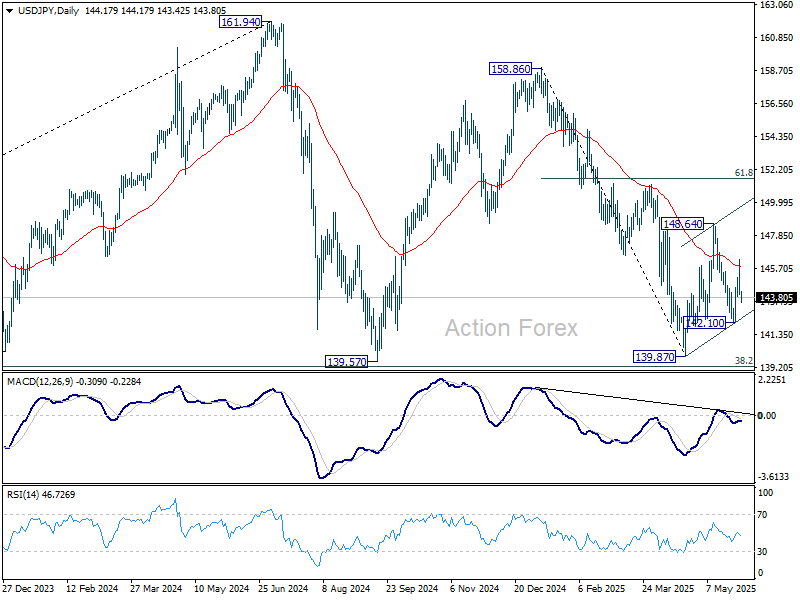
USD/JPY Daily Outlook
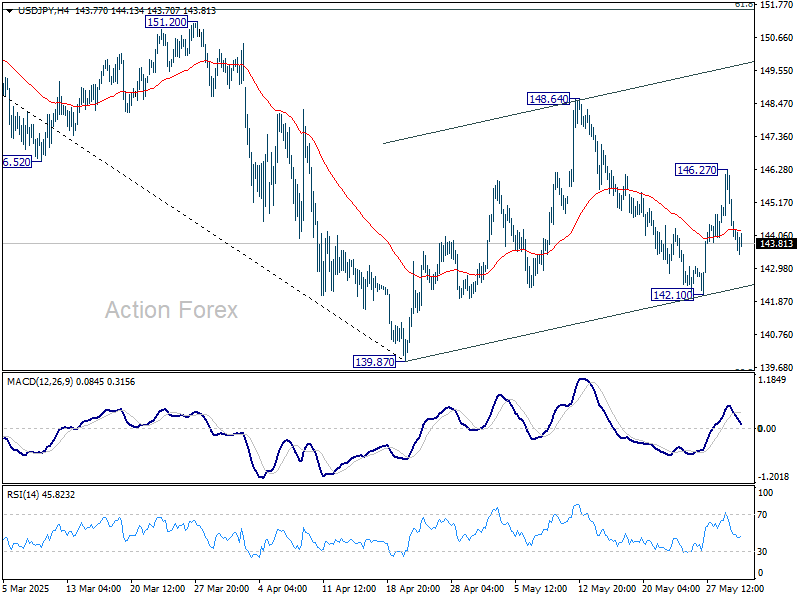
Daily Pivots: (S1) 143.34; (P) 144.81; (R1) 145.66; More...
Intraday bias in USD/JPY remains neutral for the moment. On the upside, above 146.27 will target 148.64 resistance first. Firm break there will resume the rebound from 139.87. Nevertheless, break of 142.10 will bring deeper fall back to 139.87 low.
In the bigger picture, price actions from 161.94 are seen as a corrective pattern to rise from 102.58 (2021 low), with fall from 158.86 as the third leg. Strong support should be seen from 38.2% retracement of 102.58 to 161.94 at 139.26 to bring rebound. However, sustained break of 139.26 would open up deeper medium term decline to 61.8% retracement at 125.25.