Sample Category Title
USD/CHF Daily Outlook
Daily Pivots: (S1) 0.8191; (P) 0.8212; (R1) 0.8231; More….
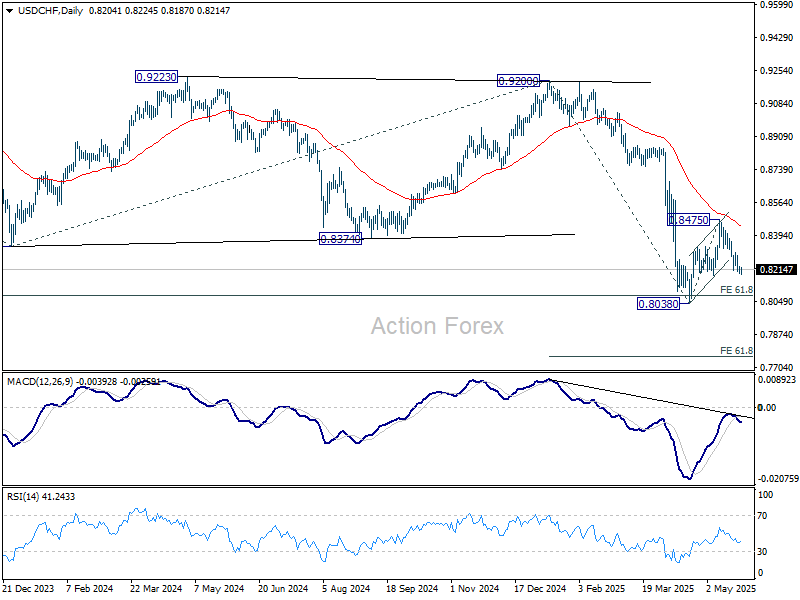
Intraday bias in USD/CHF stays mildly on the downside at this point. Fall from 0.8475 is in progress for retesting 0.8038 low. Firm break there will resume larger down trend to 61.8% projection of 0.9200 to 0.8038 from 0.8475 at 0.7757 next. On the upside, above 0.8305 minor resistance will turn intraday bias neutral again.
In the bigger picture, long term down trend from 1.0342 (2017 high) is still in progress and met 61.8% projection of 1.0146 (2022 high) to 0.8332 from 0.9200 at 0.8079 already. In any case, outlook will stay bearish as long as 55 W EMA (now at 0.8713) holds. Sustained break of 0.8079 will target 100% projection at 0.7382.
GBP/USD Daily Outlook
Daily Pivots: (S1) 1.3525; (P) 1.3559; (R1) 1.3597; More...
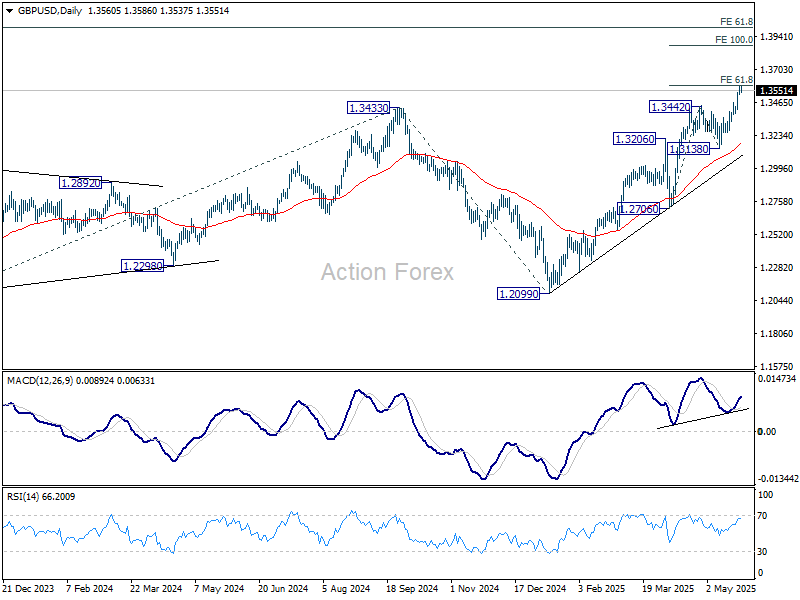
Intraday bias in GBP/USD is turned neutral first with current retreat, and some consolidations could be seen below 1.3592 temporary top. Downside should be contained well above 1.3138 support to bring another rally. On the upside, firm break of 1.3592 will turn bias back to the upside for 100% projection of 1.2706 to 1.3442 from 1.3138 at 1.3874.
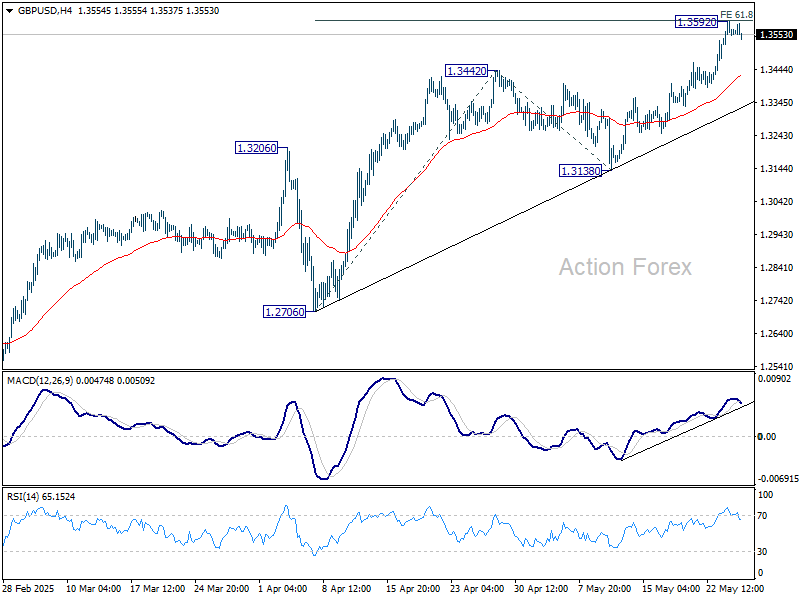
In the bigger picture, up trend from 1.3051 (2022 low) is in progress. Next medium term target is 61.8% projection of 1.0351 to 1.3433 from 1.2099 at 1.4004. Outlook will now stay bullish as long as 55 W EMA (now at 1.2870) holds, even in case of deep pullback.
EUR/USD Daily Outlook
Daily Pivots: (S1) 1.1360; (P) 1.1389; (R1) 1.1417; More...
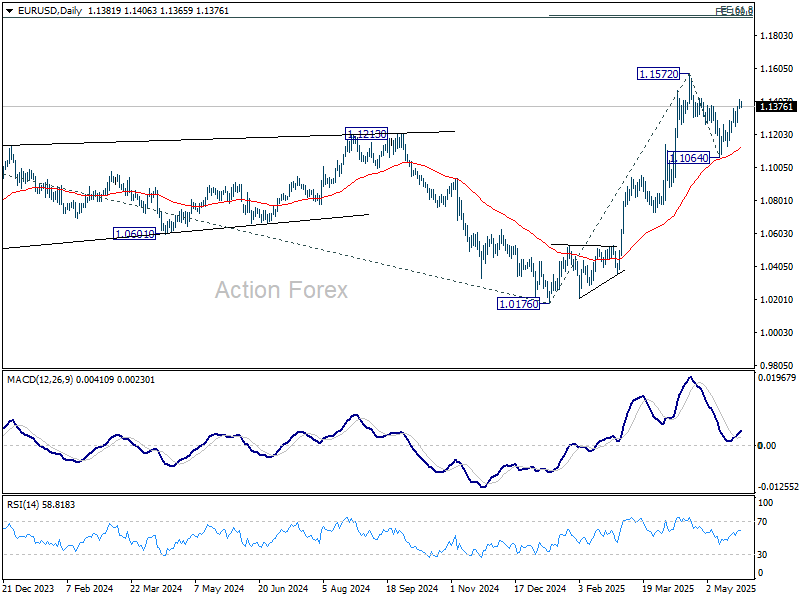
For now, further rise is expected in EUR/USD with 1.1255 support intact. Correction from 1.1572 should have completed at 1.1064. Rebound from there should target 1.1572 first. Decisive break there will resume larger up trend to 61.8% projection of 1.0176 to 1.1572 from 1.1064 at 1.1927. On the downside, however, break of 1.1255 will turn bias back to the downside to extend the corrective pattern with another falling leg.
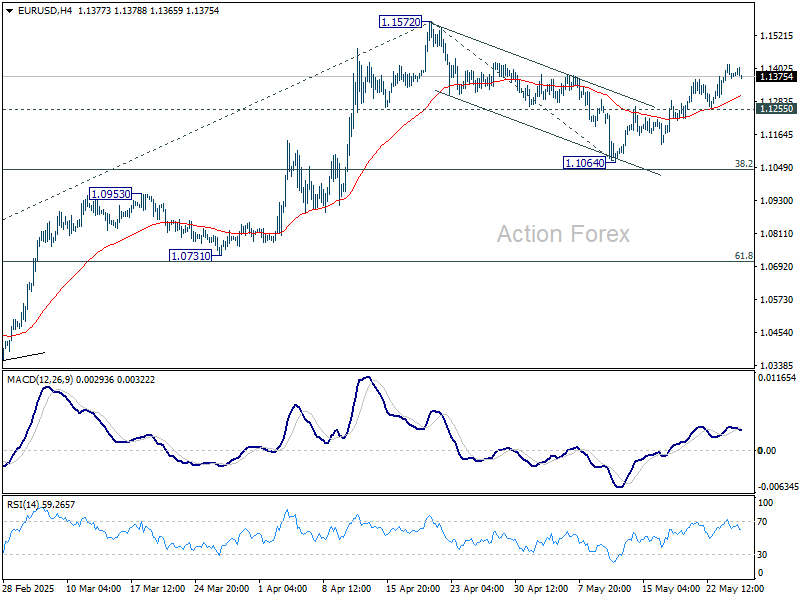
In the bigger picture, rise from 0.9534 long term bottom could be correcting the multi-decade downtrend or the start of a long term up trend. In either case, further rise should be seen to 100% projection of 0.9534 to 1.1274 from 1.0176 at 1.1916. This will now remain the favored case as long as 55 W EMA (now at 1.0858) holds.
Markets Stay Guarded Despite China Profit Gains
Markets were subdued in the Asian session today, showing little enthusiasm in response to China's better-than-expected industrial profit figures. Profits rose 3.0% yoy in April, following a 2.6% gain in March, pushing year-to-date growth to 1.4%. The data was notably resilient given ongoing trade tensions. Still, the NBS struck a cautious tone, warning of persistent headwinds such as weak domestic demand, price pressures, and heightened global uncertainty stemming from ongoing trade war.
Risk sentiment remains fragile despite US President Trump’s decision to postpone the threatened 50% tariff on EU goods until July 9. This move offers a temporary reprieve, but the lack of a clear path to resolution continues to weigh on investor confidence. US futures are holding up for now, but the news should have already been priced in. The broader concern is that even with paused escalations, the threat of further trade disruptions remain a structural drag on growth and trade.
This cautious backdrop is reflected in persistent Dollar weakness and the steady resilience in Gold. As for today so far, commodity currencies are under mild pressure along with the greenback. Yen and Swiss Franc are the strongest performers, followed by Euro, while Sterling trades mixed.
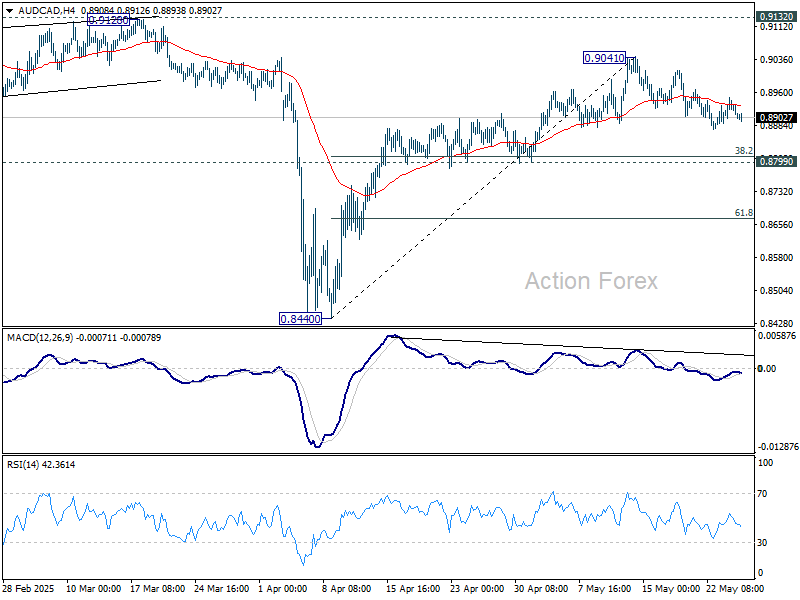
AUD/CAD is a pair to monitor this week, with Australian monthly CPI due Wednesday and Canadian GDP on Friday. Technically, rebound from 0.8440 stalled after hitting 0.9041. Price actions from there is currently seen as a corrective pattern only. Downside should be contained by 0.8799 support (38.2% retracement of 0.8440 to 0.9041 at 0.8811). Break of 0.9041 will resume the rally through 0.9132 resistance.
In Asia, at the time of writing, Nikkei is down -0.23%. Hong Kong HSI is down -0.21%. China Shanghai SSE is down -0.33%. Singapore Strait Times is up 0.13%. Japan 10-year JGB yield is down -0.019 at 1.478.
Looking ahead, Swiss trade balance and German Gfk consumer sentiment will be released in European session. Later in the day, US will publish durable goods orders, house price index and consumer confidence.
BoJ's Ueda highlights persistent food inflation and trade uncertainty
In his remarks at the BoJ-IMES Conference, BoJ Governor Kazuo Ueda highlighted a fresh wave of price pressures, particularly from food, has emerged in Japan recently. Rice prices nearly doubling year-on-year and broader non-fresh food categories climbing 7%.
While BoJ expects the latest food-driven inflation spike to be transitory, Ueda acknowledged that underlying inflation now hovers closer to the 2% mark than in previous years, warranting heightened vigilance.
BoJ retains its baseline scenario that underlying inflation will gradually return to the 2% target over time. However, given the evolving backdrop of supply-driven shocks and heightened global uncertainty, Ueda reiterated that any adjustment in the degree of monetary easing will hinge on incoming data.
"Considering the extremely high uncertainties, it is important for us to judge whether the outlook will be realized, without any preconceptions," Ueda emphasized.
Japan’s external assets hit record, but top creditor status lost to Germany
Japan’s gross external assets soared to a record JPY 533.05T in 2024, marking a 12.9% increase from the previous year. This seventh consecutive annual rise was driven by a combination of Yen depreciation and continued outbound investment activity, especially in mergers and acquisitions.
The Japanese government, businesses, and individuals collectively benefited from currency effects, as Dollar and Euro appreciated by 11.7% and 5% respectively against Yen, inflating the yen-denominated value of overseas holdings.
Nevertheless, for the first time in 34 years, Germany overtook Japan with external assets totaling JPY 569.65T. China followed closely behind Japan with JPY 516.28T.
While Yen’s depreciation offered valuation support, Japan's position was undercut by Germany’s structurally stronger current account surplus.
EUR/USD Daily Outlook
Daily Pivots: (S1) 1.1360; (P) 1.1389; (R1) 1.1417; More...
For now, further rise is expected in EUR/USD with 1.1255 support intact. Correction from 1.1572 should have completed at 1.1064. Rebound from there should target 1.1572 first. Decisive break there will resume larger up trend to 61.8% projection of 1.0176 to 1.1572 from 1.1064 at 1.1927. On the downside, however, break of 1.1255 will turn bias back to the downside to extend the corrective pattern with another falling leg.
In the bigger picture, rise from 0.9534 long term bottom could be correcting the multi-decade downtrend or the start of a long term up trend. In either case, further rise should be seen to 100% projection of 0.9534 to 1.1274 from 1.0176 at 1.1916. This will now remain the favored case as long as 55 W EMA (now at 1.0858) holds.
BoJ’s Ueda highlights persistent food inflation and trade uncertainty
In his remarks at the BoJ-IMES Conference, BoJ Governor Kazuo Ueda highlighted a fresh wave of price pressures, particularly from food, has emerged in Japan recently. Rice prices nearly doubling year-on-year and broader non-fresh food categories climbing 7%.
While BoJ expects the latest food-driven inflation spike to be transitory, Ueda acknowledged that underlying inflation now hovers closer to the 2% mark than in previous years, warranting heightened vigilance.
BoJ retains its baseline scenario that underlying inflation will gradually return to the 2% target over time. However, given the evolving backdrop of supply-driven shocks and heightened global uncertainty, Ueda reiterated that any adjustment in the degree of monetary easing will hinge on incoming data.
"Considering the extremely high uncertainties, it is important for us to judge whether the outlook will be realized, without any preconceptions," Ueda emphasized.
Japan’s external assets hit record, but top creditor status lost to Germany
Japan’s gross external assets soared to a record JPY 533.05T in 2024, marking a 12.9% increase from the previous year. This seventh consecutive annual rise was driven by a combination of Yen depreciation and continued outbound investment activity, especially in mergers and acquisitions.
The Japanese government, businesses, and individuals collectively benefited from currency effects, as Dollar and Euro appreciated by 11.7% and 5% respectively against Yen, inflating the yen-denominated value of overseas holdings.
Nevertheless, for the first time in 34 years, Germany overtook Japan with external assets totaling JPY 569.65T. China followed closely behind Japan with JPY 516.28T.
While Yen’s depreciation offered valuation support, Japan's position was undercut by Germany’s structurally stronger current account surplus.
USD/CHF Might Take a Hit as Market Sentiment Shifts
Key Highlights
- USD/CHF started a fresh decline below the 0.8300 support.
- A major bearish trend line is forming with resistance at 0.8250 on the 4-hour chart.
- EUR/USD gained pace for a move above the 1.1380 level.
- GBP/USD rallied and cleared the 1.3550 resistance zone.
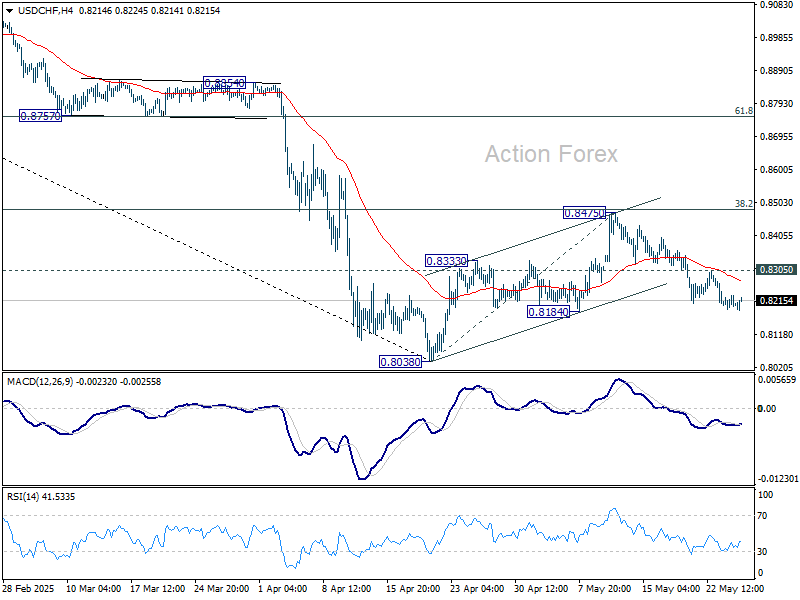
USD/CHF Technical Analysis
The US Dollar failed to surpass 0.8480 against the Swiss France. USD/CHF formed a local top and started a fresh decline below 0.8350.
Looking at the 4-hour chart, the pair settled below the 0.8300 level, the 100 simple moving average (red, 4-hour), and the 200 simple moving average (green, 4-hour). The pair even declined below the 0.8260 level and tested the 0.8200 zone.
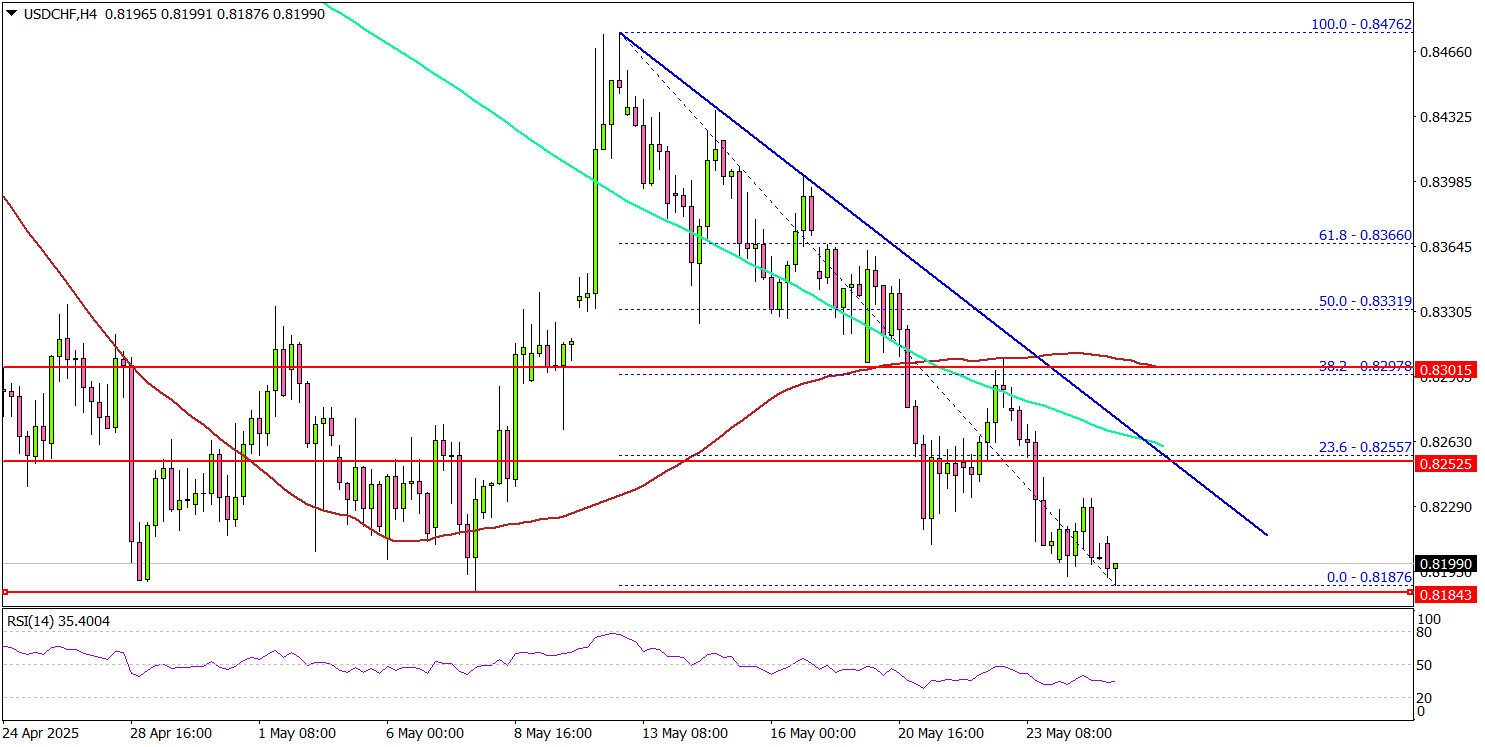
The pair is now consolidating losses and struggling to stay above the 0.8200 zone. On the upside, the pair could face resistance near the 0.8220 level.
The next key resistance sits near the 0.8250 level. There is also a major bearish trend line forming with resistance at 0.8250 on the same chart. The first major resistance sits at 0.8265. A close above the 0.8265 level could set the pace for another increase.
In the stated case, the pair could even clear the 0.8300 resistance. The next major stop for the bulls could be near the 0.8350 resistance.
On the downside, immediate support sits near the 0.8180 level. The next key support sits near 0.8160. Any more losses could send the pair toward the 0.8120 pivot level in the near term. The main support could be near 0.8000.
Looking at GBP/USD, the pair started a major increase above the 1.3550 resistance zone and might continue to move up.
Upcoming Economic Events:
- US Durable Goods Orders for April 2025 – Forecast -8.0% versus +9.2% previous.
- US Housing Price Index for March 2025 (MoM) - Forecast +0.2%, versus +0.1% previous.
Key Takeaways from ECB’s Lagarde and Fed Chair Powell’s Latest Speeches
Both the FED and ECB head representatives made speeches on Sunday, 27, and this morning, respectively. As Traders, it is always an advantage to know what tone Central Bank speakers are using and what they are considering for future key decisions.
It's only fair to remind that a Dovish Policy aims at stimulating the economy, and easing financial conditions. It is usually associated to weakness in a specific currency, with speeches around when and how much to cut.
On the other hand, a Hawkish Policy aims at cooling down inflation and tightening financial conditions. It is usually associated with strength in a specific currency, as the themes are focused on when and how much to hike.
FED’s Powell spoke on Sunday afternoon at Princeton University, and ECB’s Lagarde spoke this morning at the Hertie Graduate School in Germany.
FED's Powell Defends the Federal Reserve in Princeton
Jerome Powell made remarks for a Baccalaureate Ceremony at the Princeton University, from where he graduated 50 years ago.
He did not comment about Monetary and Financial Policy for the FED though gave a show of strength from the Central Bank amid persistent criticism from President Trump, with the President calling the head of the Federal Reserve "Too Late Powell".
FED's Powell focused his speech on defending the stimulus from COVID years and how the Federal Reserve had to react to economic uncertainty with no precedent.
Donald Trump is trying to push for Cuts. However, the Federal Reserve has indicated throughout past speeches that they are waiting for further news to observe the impact on inflation and the unforeseen US tariff policy.
Here are the May 7th FOMC Meeting's most pertinent remarks in those aspects:
“In considering the extent and timing of additional adjustments to the target range for the federal funds rate, the Committee will carefully assess incoming data, the evolving outlook, and the balance of risks.”
You can access yesterday's speech here and the entire May 7, 2025 Meeting Statement here.
ECB's Lagarde and the Euro's role in the Global Economy
Christine Lagarde spoke earlier this morning at the Hertie School in Berlin, Germany.
While the ECB President avoided commenting on the broader economic outlook or monetary policy, she emphasized the euro’s expanding role in global trade, particularly as the U.S. gradually steps back from its traditional leadership position.
Lagarde highlighted that “shifts in the global currency landscape are not unprecedented in monetary history”—a statement that touches on one of the defining macro themes of this decade and beyond. Economists and market participants alike are watching closely to see whether the U.S. Dollar can maintain its dominant reserve status.
The speech offers valuable insight, even for traders primarily focused on technical movements, making it a worthwhile read.
You can access the whole speech here.
More speeches incoming with BoJ's Ueda
It's not over for Central Bankers speeches today with the Bank of Japan's Governor Ueda giving a speech at the 2025 BOJ-IMES Conference in Tokyo, Japan. He is expected to speak at 8:00 P.M. E.T.
Safe Trades!
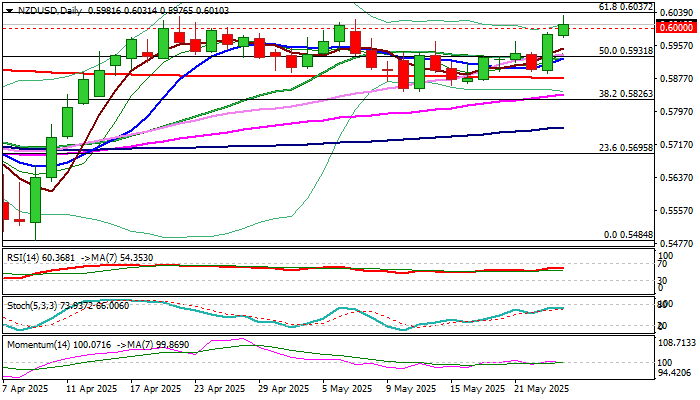
NZD/USD: Kiwi Dollar Probes Again Through 0.60 Pivot and Hits New 2025 High
NZDUSD jumped to new 2025 high on Monday, in extension of Friday’s 1.9% rally, after fresh threats of US tariffs on Apple and European Union and subsequent U-turn in policies with the EU, deflated US dollar and boosted risk appetite.
Kiwi dollar probed again through psychological 0.60 barrier (following several rejections here in late April / early May).
Near term action is underpinned by formation of daily Tenkan/Kijun-sen bull-cross and thick daily cloud, but loss of bullish momentum should be considered as initial warning as bulls again face headwinds above 0.60 barrier.
Threats of another failure to register a clear break above 0.60 (after a number of rejections) keep in play scenario of potential stall.
Look for today’s reaction at 0.60 level for fresh signal.
RBNZ policymakers will meet on Wednesday and are widely expected to cut interest rates by 25 basis points, however, more focus will be on signals about central bank’s next steps.
Res: 0.6037; 0.6087; 0.6100; 0.6167
Sup: 0.6000; 0.5946; 0.5931; 0.5900
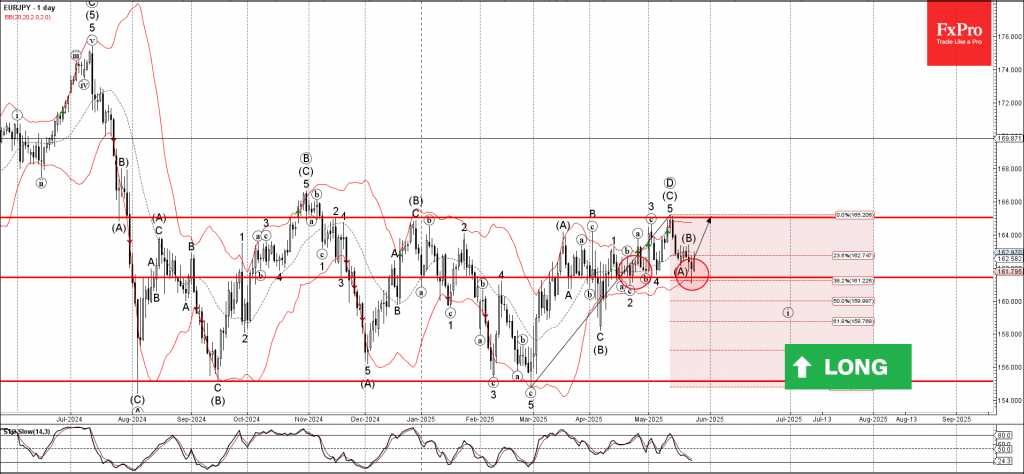
EURJPY Wave Analysis
EURJPY: ⬆️ Buy
- EURJPY reversed from key support level 161.40
- Likely to rise to resistance level 165.00
EURJPY currency pair recently reversed up from the key support level 161.40 (which has been reversing the price from the middle of April), coinciding with the lower daily Bollinger Band
The upward reversal from the support level 161.40 created the daily Japanese candlesticks reversal pattern Long Legged Doji.
EURJPY currency pair can be expected to rise to the next resistance level 165.00, which has been reversing the price from last November.