
Sample Category Title
GBP/USD Mid-Day Outlook
Daily Pivots: (S1) 1.3393; (P) 1.3417; (R1) 1.3443; More...
GBP/USD's rally resumed after brief consolidations and intraday bias is back on the upside. Current rally should now target 61.8% projection of 1.2706 to 1.3442 from 1.3138 at 1.3593, and then 100% projection at 1.3874. On the downside, below 1.3389 minor support will turn intraday bias neutral again first.
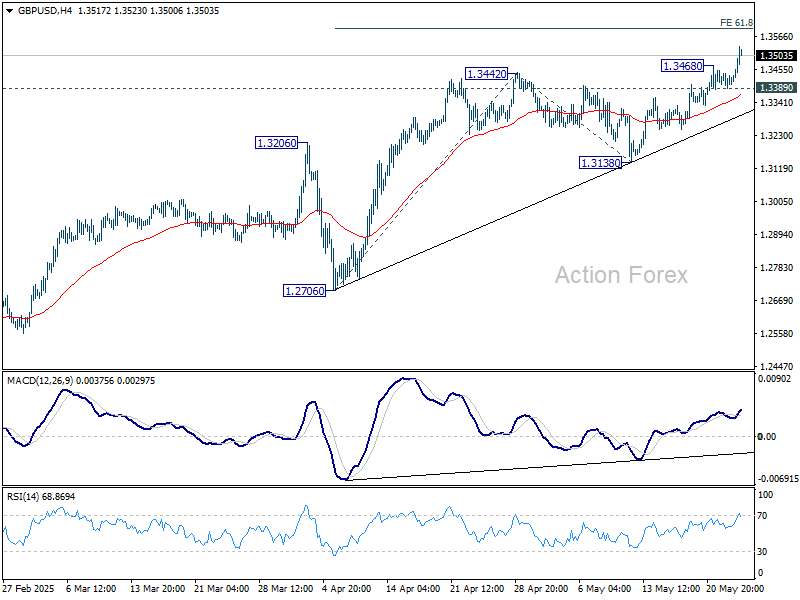
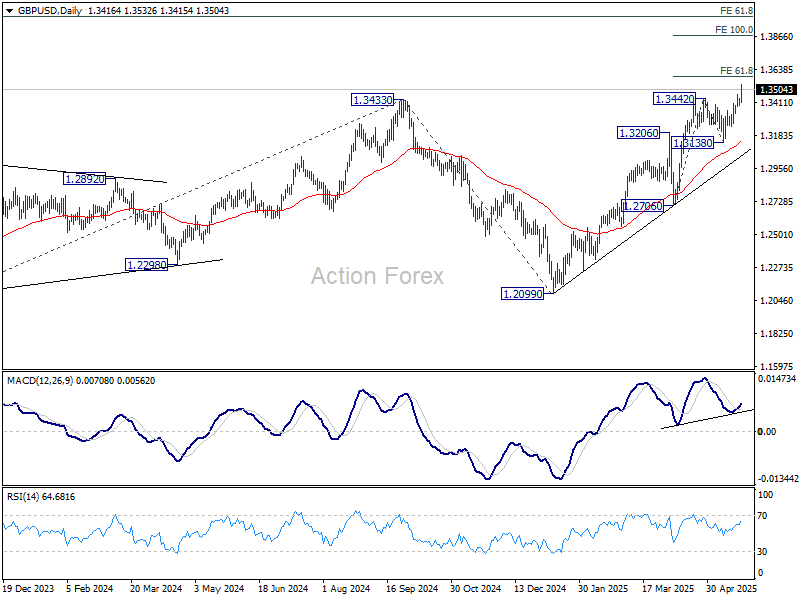
In the bigger picture, up trend from 1.3051 (2022 low) is now resuming. Next medium term target is 61.8% projection of 1.0351 to 1.3433 from 1.2099 at 1.4004. Outlook will now stay bullish as long as 55 W EMA (now at 1.2843) holds.
EUR/USD Mid-Day Outlook
Daily Pivots: (S1) 1.1242; (P) 1.1294; (R1) 1.1331; More...
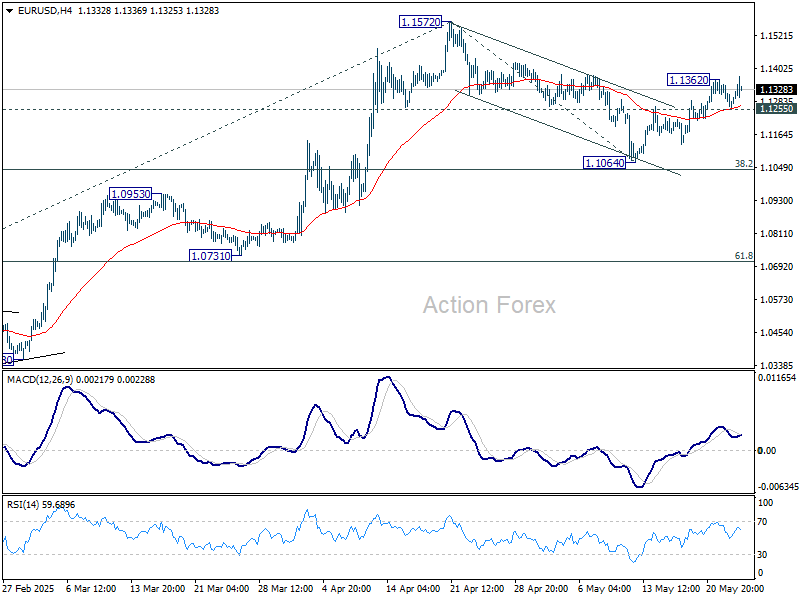
Intraday bias in EUR/USD is back on the upside with breach of 1.1362 temporary top. As noted before, correction from 1.1572 could have completed at 1.1064 already. Further rise should be seen to retest 1.1572 first. Firm break there will resume larger up trend. Next near term target will be 61.8% projection of 1.0176 to 1.1572 from 1.1064 at 1.1927. However, below 1.1255 minor support will dampen this view and turn intraday bias neutral again.
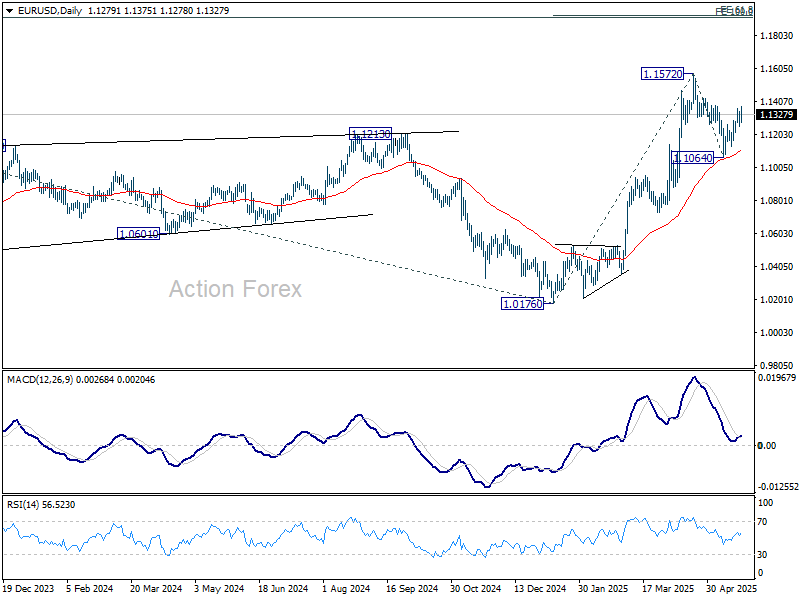
In the bigger picture, rise from 0.9534 long term bottom could be correcting the multi-decade downtrend or the start of a long term up trend. In either case, further rise should be seen to 100% projection of 0.9534 to 1.1274 from 1.0176 at 1.1916. This will now remain the favored case as long as 55 W EMA (now at 1.0818) holds.
Markets Rattled as Trump Threatens 50% Tariffs on EU, Dollar Tumbles
Global financial markets are thrown back into turmoil today after US President Donald Trump reignited trade tensions by announcing he would recommend a sweeping 50% tariff on EU imports starting June 1. In a pointed social media post, Trump accused the EU of stonewalling negotiations, declaring that discussions were “going nowhere.” The announcement came on the heels of another threat, this time directed at Apple, with Trump warning of at least a 25% tariff if the company doesn’t relocate iPhone production to the US.
The market reaction was swift and severe. DOW futures plunged over 500 points, and European equities were battered as traders rushed to reprice geopolitical risk. The shock move revives fears of a new phase in the trade war, one with potentially deeper and more systemic consequences than the US-China dispute, especially given Europe’s central role in global supply chains and transatlantic investment flows.
Currency markets mirrored the chaos. While Euro was understandably under pressure from the tariff news, Dollar was hit even harder, staying at the bottom of the performance board for the day. Traders appear to be weighing the long-term implications of such a dramatic trade escalation on US economy.
Safe haven demand surged, with Yen leading gains. Kiwi and Swiss Franc are following. Sterling held up relatively well thanks to robust retail sales data. Aussie remained relatively steady, though vulnerable to shifts in global risk sentiment.
In Europe, at the time of writing, FTSE is down -0.95%. DAX is down 2.11%. CAC is down -2.33%. UK 10-year yield is down -0.044 at 4.712. Germany 10-year yield is down -0.079 at 2.567. Earlier in Asia, Nikkei rose 0.47%. Hong Kong HSI rose 0.24%. China Shanghai SSE fell -0.94%. Singapore Strait Times rose 0.06%. Japan 10-year JGB yield fell -0.013 to 1.549.
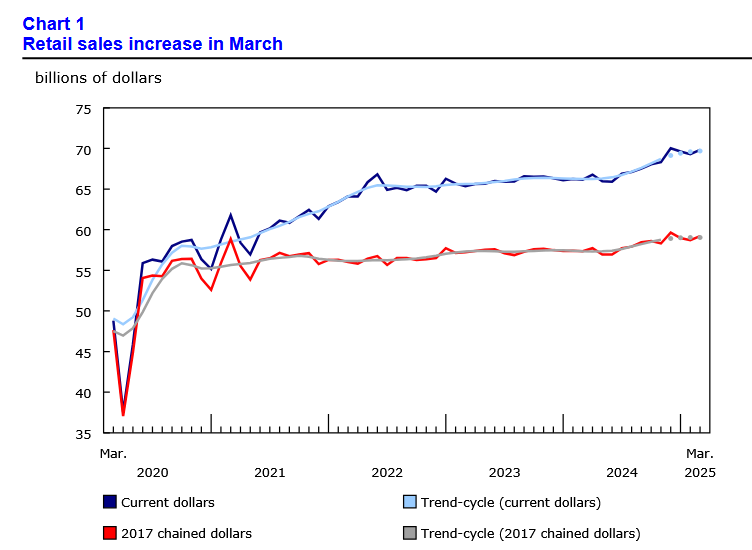
Canada retail sales rise 0.8% mom on autos, underlying momentum weakens
Canada’s retail sales rose by 0.8% mom in March, surpassing expectations of a 0.6% gain. Motor vehicle and parts dealers drove the advance with a strong 4.8% mom rebound. The first quarter posted a solid 1.2% gain in total retail activity, extending the streak of quarterly increases to four.
However, the underlying trend was less encouraging. Retail sales excluding autos plunged -0.7% mom, far worse than the expected -0.1% mom decline.
StatCan’s advance estimate points to a modest 0.5% rebound in April.
ECB’s Lane sees wages easing, cautions on persistent global shocks
ECB Chief Economist Philip Lane expressed confidence that services inflation will continue to moderate, citing subdued outcomes in recent wage agreements.
Speaking at a lecture, Lane noted that the current wage settlements for 2025 are already "quite low," with those for 2026 appearing even more restrained. That suggested easing cost pressures in the services sector, a key driver of core inflation.
However, Lane tempered optimism by pointing to the persistent volatility in the global economic environment. He highlighted large recent swings in exchange rates and energy prices, attributing them to structural shifts in the global trading system.
ECB’s Rehn and Stournaras back June rate cut
ECB Governing Council members Olli Rehn and Yannis Stournaras signaled support for a rate cut in June, provided that incoming data confirms the current trend of stabilizing inflation and moderate growth. Rehn stressed the importance of maintaining a data-dependent approach amid a backdrop of “pervasive uncertainty” stemming from geopolitical tensions and global trade conflicts.
Speaking in an interview with Kathimerini, Rehn noted that "if incoming data and macroeconomic analysis confirm the current outlook for stabilizing inflation and somewhat subdued growth, the appropriate response in June would be to continue monetary easing and lower interest rates."
However, he cautioned against making any assumptions beyond June. "let's stay on the path of data-driven decision-making at every meeting, especially as we find ourselves under the clouds of pervasive uncertainty due to geopolitics and trade wars," he emphasized.
Stournaras echoed the view of a June cut, but suggested the ECB may pause thereafter to reassess. "I believe we will reduce interest rates one more time in June and then I see a pause," he said.
UK retail sales beat expectations with 1.2% mom growth, strongest annual gain since 2022
UK retail sales volumes jumped by 1.2% mom in April, significantly above the expected 0.3% mom gain. This marks the fourth consecutive monthly increase, with volumes now at their highest level since July 2022. Food store sales led the rise with a sharp 3.9% rebound, attributed largely to favorable weather conditions, offsetting declines seen in February and March.
On a broader basis, sales volumes grew 1.8% over the three months to April compared to the prior three-month period, the strongest gain since July 2021. Year-on-year, volumes rose 2.6%, the largest increase since March 2022.
Sticky inflation persist as Japan’s core CPI climbs to 3.5%
Japan’s inflation pressures remained elevated in April, with the core CPI (excluding fresh food) rising from 3.2% yoy to 3.5% yoy, beating expectations of 3.4% yoy and marking the highest level since January 2023. This keeps core inflation above the BoJ’s 2% target for over three years.
Core-core CPI, which excludes both food and energy, also ticked up from 2.9% yoy to 3.0% yoy, suggesting broader underlying price momentum. Headline CPI held steady at 3.6% yoy.
There were notable upward drivers in inflation. Energy prices surged 9.3% yoy, up from March’s 6.6% yoy. Food prices (excluding fresh items) jumped 7.0% yoy, up from 6.2% yoy. In particular, rice prices soared by 98.4% yoy, a seventh consecutive record high, reflecting persistent supply shortages.
However, services inflation, closely watched by BoJ as a wage-sensitive component, edged slightly lower to 1.3% from 1.4%, tempering some of the hawkish signals.
NZ retail sales rise 0.8% qoq in Q1, but ex-auto growth modest
New Zealand retail sales volumes rose a stronger-than-expected 0.8% qoq in Q1 to NZD 25B, offering a positive surprise relative to market expectations of flat growth.
According to Stats NZ, 10 of the 15 major retail industries saw increased activity, led by a 3.1% jump in motor vehicle and parts retailing and a 3.7% rise in pharmaceutical and other store-based sales. Clothing and accessories also saw a healthy 3.2% gain.
Despite the upbeat headline, underlying momentum appears less robust when excluding the volatile auto sector. Core retail sales rose just 0.4% qoq, sharply missing expectations of a 1.5% qoq rise.
Economic indicators spokesperson Michelle Feyen noted that growth was "modest" and broad-based.
EUR/USD Mid-Day Outlook
Daily Pivots: (S1) 1.1242; (P) 1.1294; (R1) 1.1331; More...
Intraday bias in EUR/USD is back on the upside with breach of 1.1362 temporary top. As noted before, correction from 1.1572 could have completed at 1.1064 already. Further rise should be seen to retest 1.1572 first. Firm break there will resume larger up trend. Next near term target will be 61.8% projection of 1.0176 to 1.1572 from 1.1064 at 1.1927. However, below 1.1255 minor support will dampen this view and turn intraday bias neutral again.
In the bigger picture, rise from 0.9534 long term bottom could be correcting the multi-decade downtrend or the start of a long term up trend. In either case, further rise should be seen to 100% projection of 0.9534 to 1.1274 from 1.0176 at 1.1916. This will now remain the favored case as long as 55 W EMA (now at 1.0818) holds.
Canada retail sales rise 0.8% mom on autos, underlying momentum weakens
Canada’s retail sales rose by 0.8% mom in March, surpassing expectations of a 0.6% gain. Motor vehicle and parts dealers drove the advance with a strong 4.8% mom rebound. The first quarter posted a solid 1.2% gain in total retail activity, extending the streak of quarterly increases to four.
However, the underlying trend was less encouraging. Retail sales excluding autos plunged -0.7% mom, far worse than the expected -0.1% mom decline.
StatCan’s advance estimate points to a modest 0.5% rebound in April.
GBP/USD: Cracks 1.3500 Barrier and Hits a Multi-Month High on Upbeat UK Economic Data
Cable rose 0.5% on Friday morning and cracked psychological 1.3500, hitting the highest since February 2022.
Fresh acceleration higher was sparked by upbeat UK retail sales, which strongly beat forecasts in April and boosted risk sentiment.
Bullish continuation pattern is developing on weekly chart as cable broke through key resistances at 1.3434/44 (2024/2025 tops), with weekly close above these levels to validate the signal.
This week’s action was shaped in a large bullish candle which is on track to offset initial reversal signals from weekly Hammers and Doji candles in past four weeks.
Also, the pair is on track to complete the fourth consecutive month of strong gains that adds to bullish outlook, along with a kind of bear-trap that formed below 1.3200 psychological support on monthly chart.
Recent solid UK economic data, hotter than expected inflation and weakening dollar are likely to continue to underpin the pound.
Sustained break of 1.3434/44 pivots to signal continuation of larger uptrend and expose targets at 1.3643/1.3748 (Jan / Feb 2022 tops) and unmask psychological 1.40 barrier.
Meanwhile, overbought conditions may pause rally for consolidation / limited correction, which would mark positioning for further advance.
Former breakpoints (1.3434/44) reverted to initial but solid supports, with 4-hr chart higher base at 1.3390 zone to contain dips and keep bulls intact.
Res: 1.3500; 1.3557; 1.3600; 1.3643.
Sup: 1.3484; 1.3444; 1.3434; 1.3390.
British Pound Resumes Rally as Retail Sales Jump
The British pound has posted gains on Friday. In the European session, GBP/USD is trading at 1.3484, up 0.49% on the day. The pound has gained 1.5% this week and is trading at levels not seen since Feb. 2022.
UK retail sales surge 5% in April
The markets were expecting a banner reading from April retail sales but the actual numbers crushed the forecast. Annual retail sales surged 5%, up from a downwardly revised 1.9% and above the market estimate of 4.5%. This marked the fastest pace of growth since Feb. 2022.
Monthly, retail sales climbed 1.2%, up from a downwardly revised 0.3% in March and blowing past the market estimate of 0.2%. The surge was driven by sharp gains in food store sales and department stores, as favorable weather brought out consumers.
The UK economy has been struggling and strong consumer spending has been a bright spot. Monthly retail sales have now increased for four straight months, which last occurred in 2020.
The UK consumer spending more and is showing more optimism. The GfK consumer confidence index for May improved to -20 from -23 and beat the market estimate of -22. The improvement is likely a result of the de-escalation in global trade tensions as well as the Bank of England rate cut in early May.
The impressive retail sales report, together with higher-than-expected inflation in April will raise expectations for the BoE to hold rates at its next meeting on June 18.
There are no key US releases today but we'll hear from three FOMC members. There has been plenty of Fedspeak this week, with a message that the US tariffs will take a toll on the US economy, even with the temporary deal with China, and that the Fed favors a wait-and-see stance before further rate cuts.
GBP/USD Technical
- GBP/USD has broken above several resistance lines and is putting pressure in resistance at 1.3493.
- There is support at 1.3393 and 1.3367
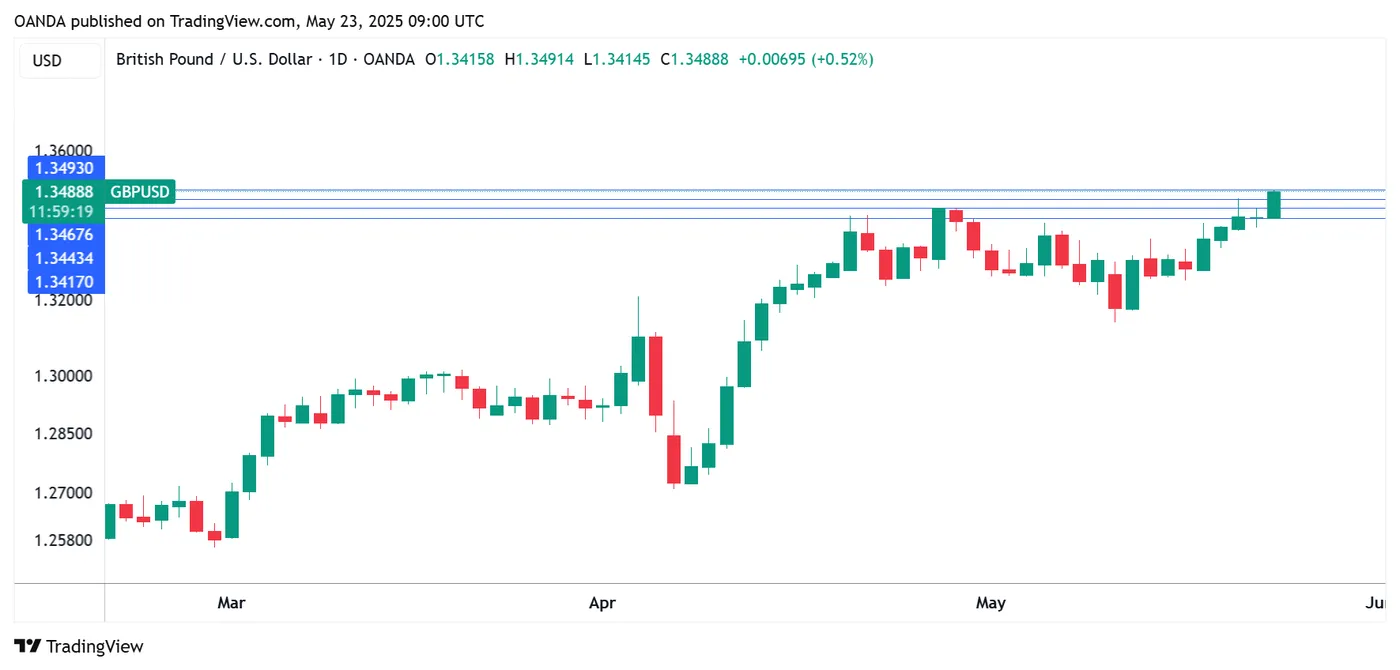
GBPUSD 1-Day Chart, May 25, 2025
ECB’s Lane sees wages easing, cautions on persistent global shocks
ECB Chief Economist Philip Lane expressed confidence that services inflation will continue to moderate, citing subdued outcomes in recent wage agreements.
Speaking at a lecture, Lane noted that the current wage settlements for 2025 are already "quite low," with those for 2026 appearing even more restrained. That suggested easing cost pressures in the services sector, a key driver of core inflation.
However, Lane tempered optimism by pointing to the persistent volatility in the global economic environment. He highlighted large recent swings in exchange rates and energy prices, attributing them to structural shifts in the global trading system.
ECB’s Rehn and Stournaras back June rate cut
ECB Governing Council members Olli Rehn and Yannis Stournaras signaled support for a rate cut in June, provided that incoming data confirms the current trend of stabilizing inflation and moderate growth. Rehn stressed the importance of maintaining a data-dependent approach amid a backdrop of “pervasive uncertainty” stemming from geopolitical tensions and global trade conflicts.
Speaking in an interview with Kathimerini, Rehn noted that "if incoming data and macroeconomic analysis confirm the current outlook for stabilizing inflation and somewhat subdued growth, the appropriate response in June would be to continue monetary easing and lower interest rates."
However, he cautioned against making any assumptions beyond June. "let's stay on the path of data-driven decision-making at every meeting, especially as we find ourselves under the clouds of pervasive uncertainty due to geopolitics and trade wars," he emphasized.
Stournaras echoed the view of a June cut, but suggested the ECB may pause thereafter to reassess. "I believe we will reduce interest rates one more time in June and then I see a pause," he said.
Crypto Climbs Back to January Highs
The cryptocurrency market added a mere 0.7% in 24 hours, but an important 5% in seven days to $3.5 trillion. This increase is important as it falls in the area of the market peaks reached in December and January.
The sentiment index jumped to 78, last seen in January, confirming a similar situation to what we saw earlier in the year.
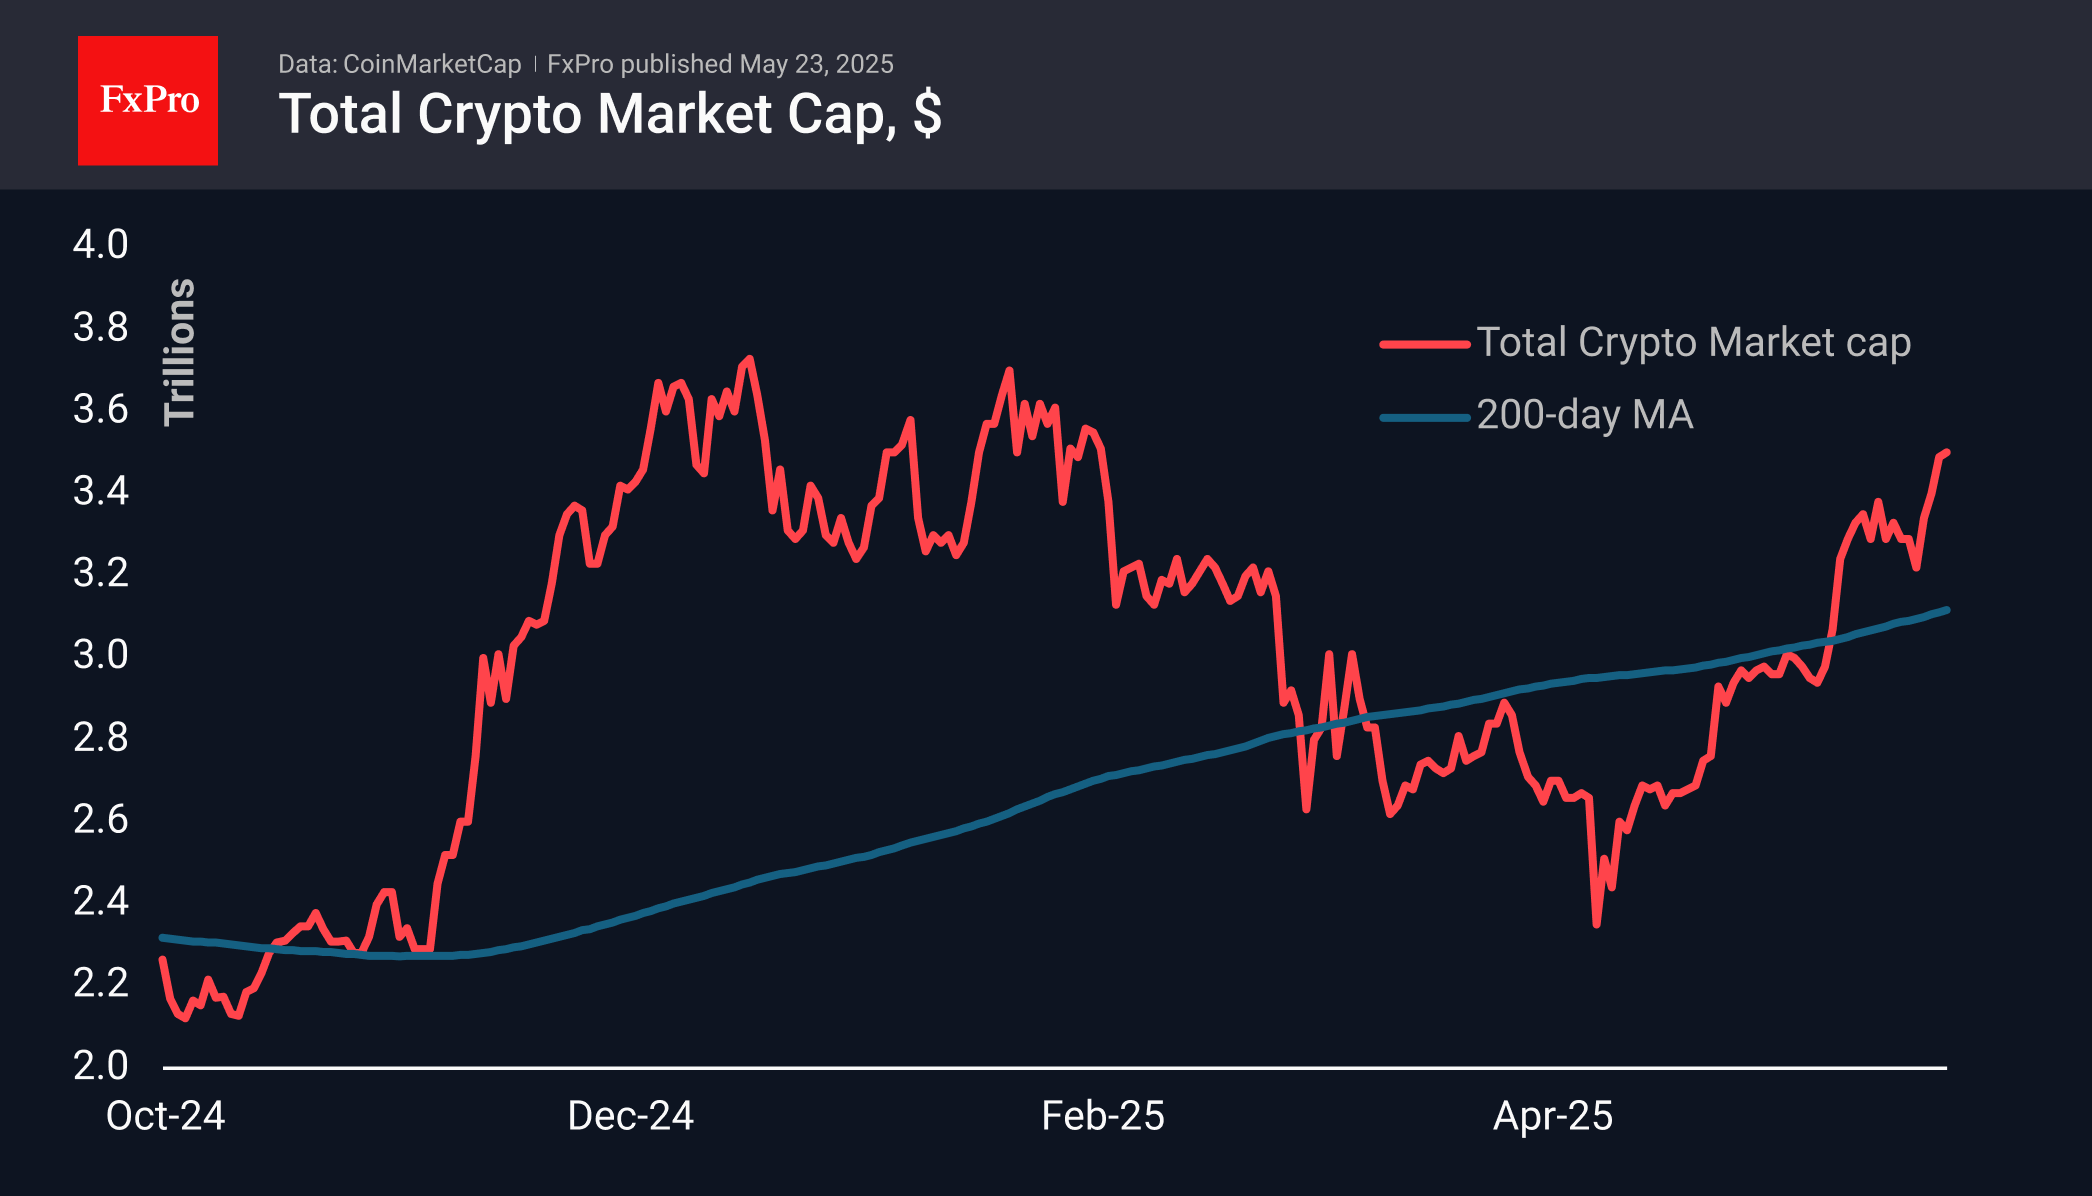
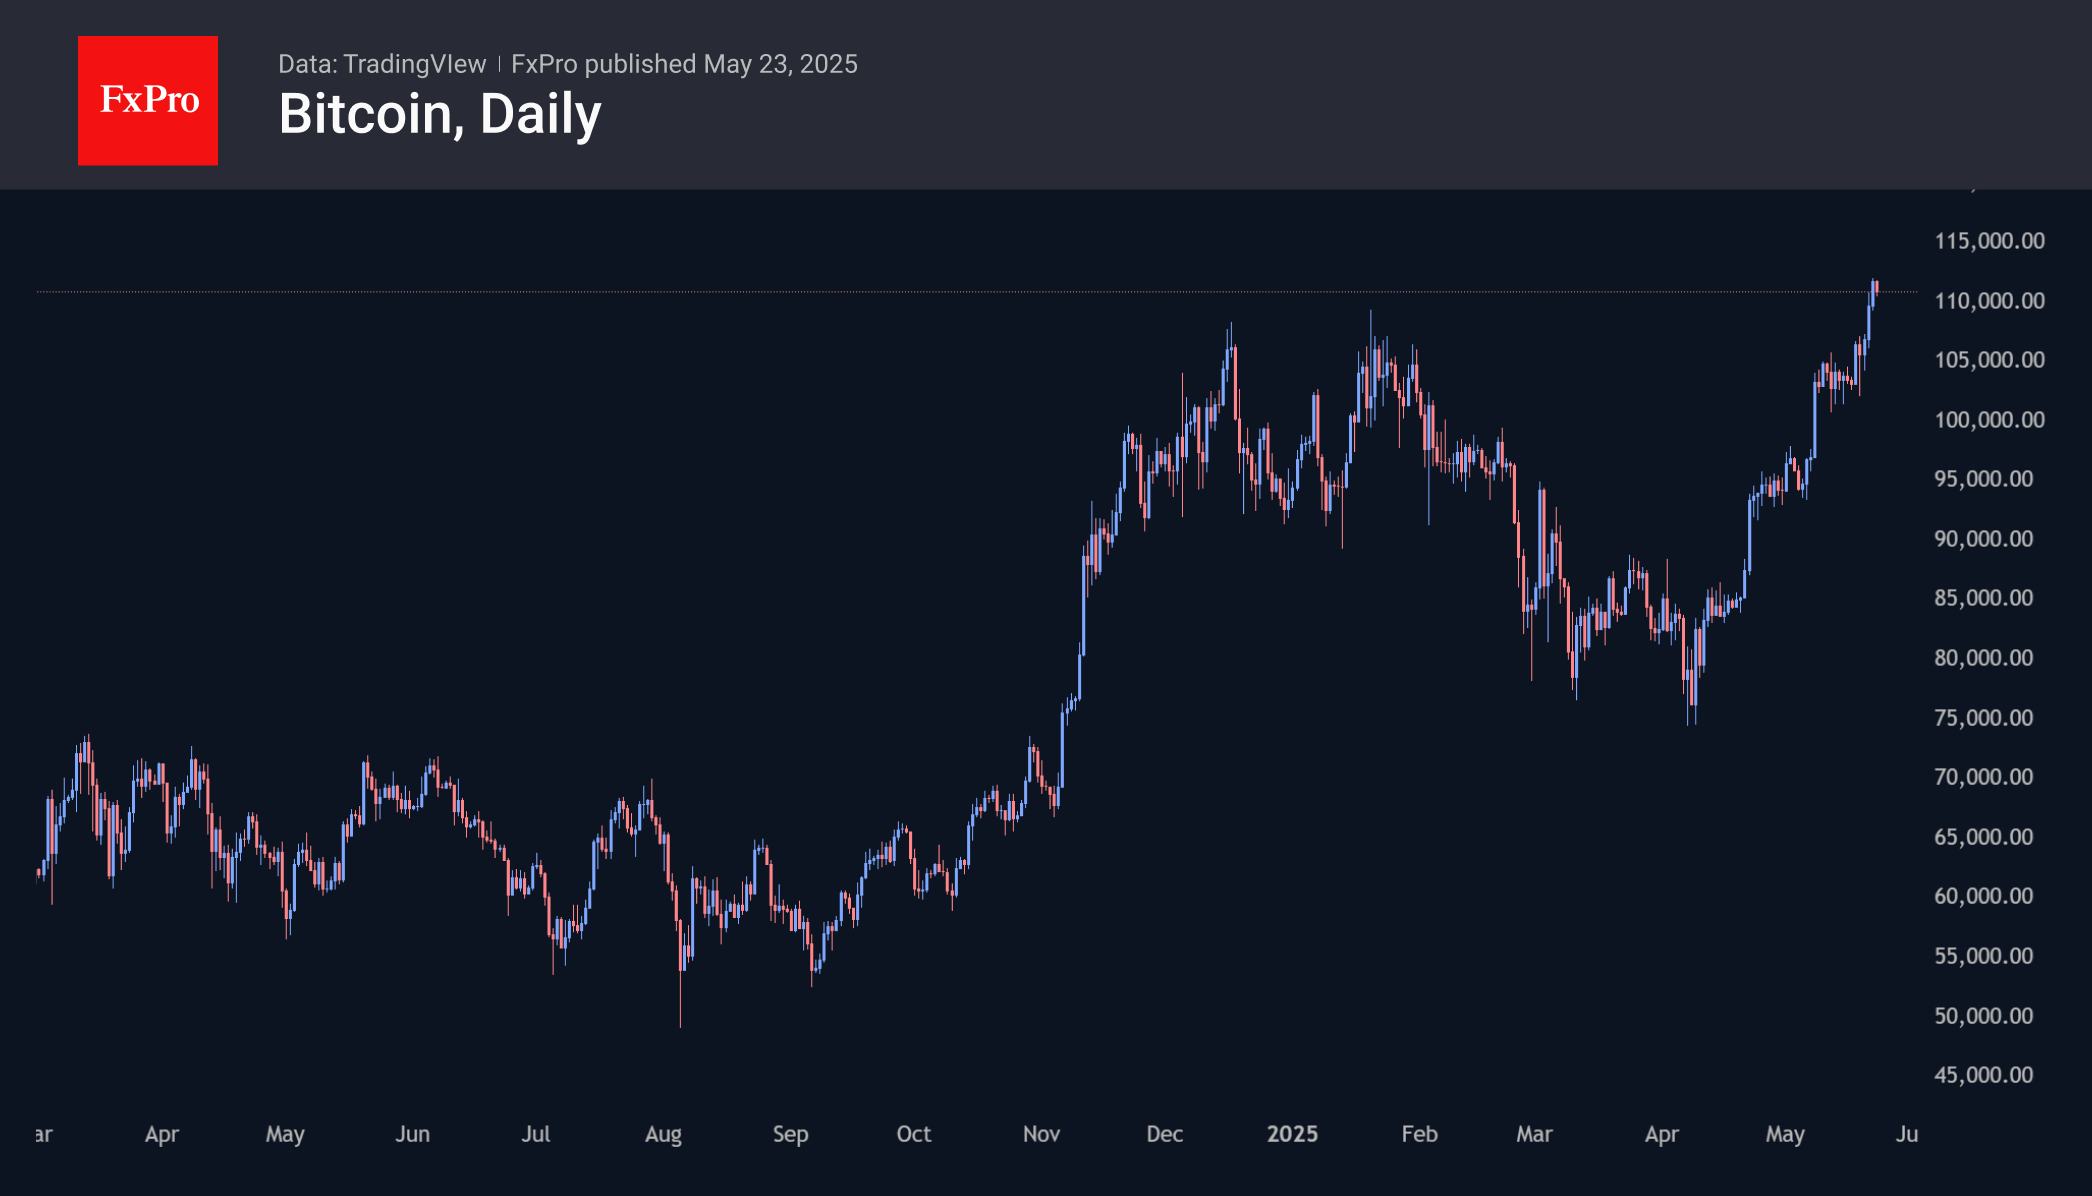
Bitcoin repeated highs on Thursday evening, rising to $111.8k and pulling back slightly to $110.5k by Friday morning. The rise was attributed to the advancement of stablecoin legislation, capital inflows into 12 U.S. ETFs of about $4.2 billion in May, purchases by Strategy, which has accumulated more than $50 billion worth of tokens, and U.S. fiscal concerns. Unlike previous BTCUSD rallies, the current upward movement is not solely driven by momentum, but by increased demand and White House loyalty.
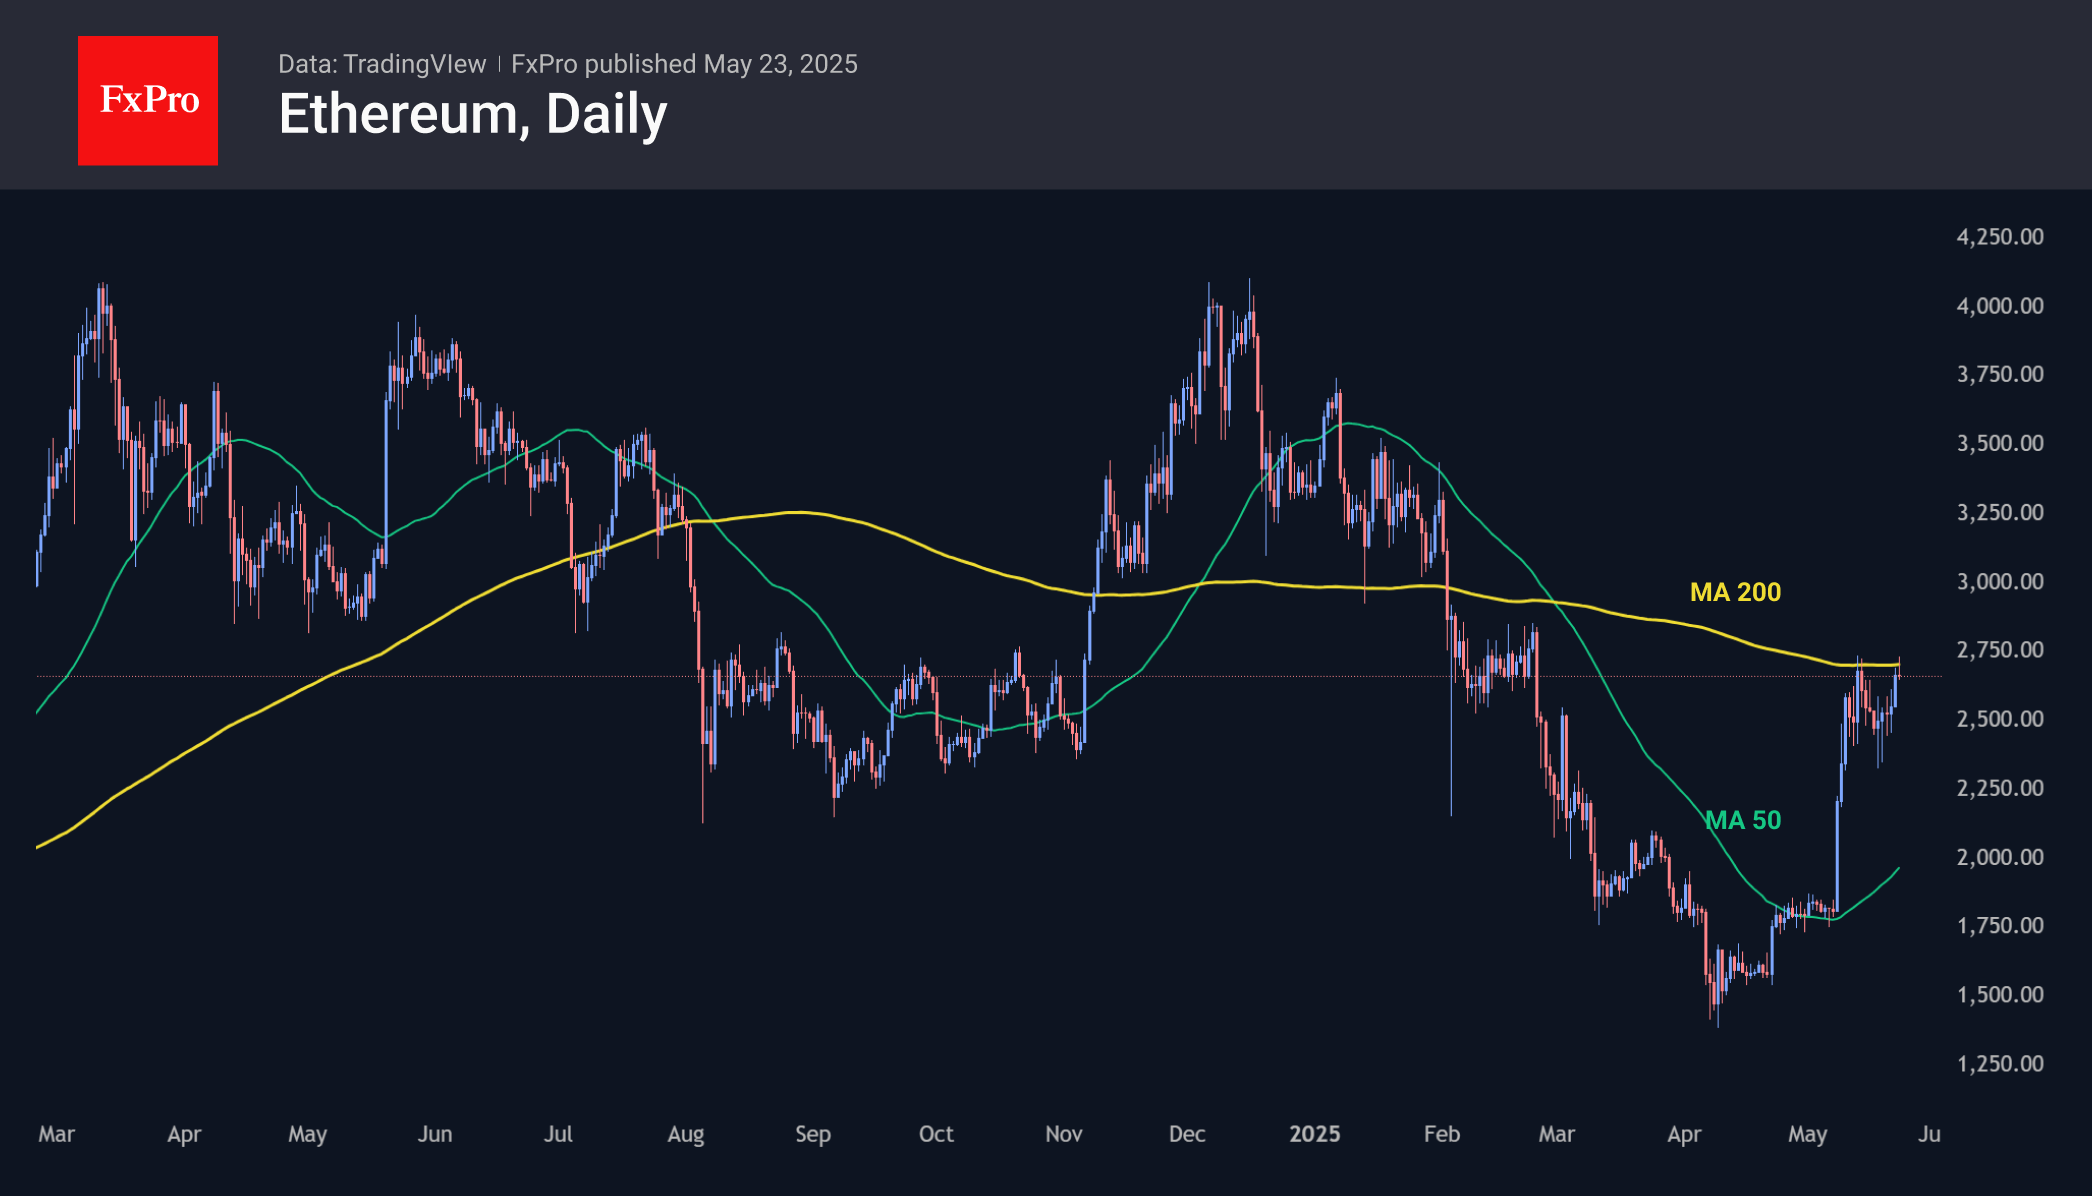
Ethereum continues to struggle for the 200-day moving average at $2650. This is also the area of February’s protracted consolidation and the important pivot level from August to October last year. A break of current resistance could kick-start a rally to $4000.
The Democrats have dropped their opposition, and the Senate will soon consider the Stablecoin legislation. It would place tighter restrictions on money laundering, improve consumer protections, and unify business rules for U.S. and foreign companies.
Fiscal concerns are weakening the dollar and pushing up Treasury bond yields. According to Galaxy Digital, it is becoming increasingly dangerous to invest in a country with such huge debts. Investors are looking for alternatives and are finding them in Bitcoin. No wonder the paths of BTCUSD and the S&P 500 have diverged.
EUR/USD Could Climb as Dollar Faces Mounting Risks
The euro has regained strength against the dollar, with EUR/USD holding steady at 1.1312 on Friday.
Key drivers behind EUR/USD’s movement
The US dollar remains vulnerable as investor concerns over the US fiscal outlook persist. President Donald Trump’s proposed budget bill – featuring tax cuts and heightened defence spending – has stoked fears of surging national debt.
According to the Congressional Budget Office, the bill could inflate the US national debt by nearly $4 trillion, raising alarms over long-term fiscal stability.
Further pressuring the dollar, Moody’s recently downgraded the US credit rating from Aaa to Aa1, citing widening budget deficits and rising debt-servicing costs.
Meanwhile, investor appetite for US assets has waned amid sluggish progress in trade negotiations.
Although this week saw limited high-impact US data releases, the market has welcomed the brief lull. Today, traders will focus on April’s new home sales report for fresh directional cues.
Technical analysis: EUR/USD
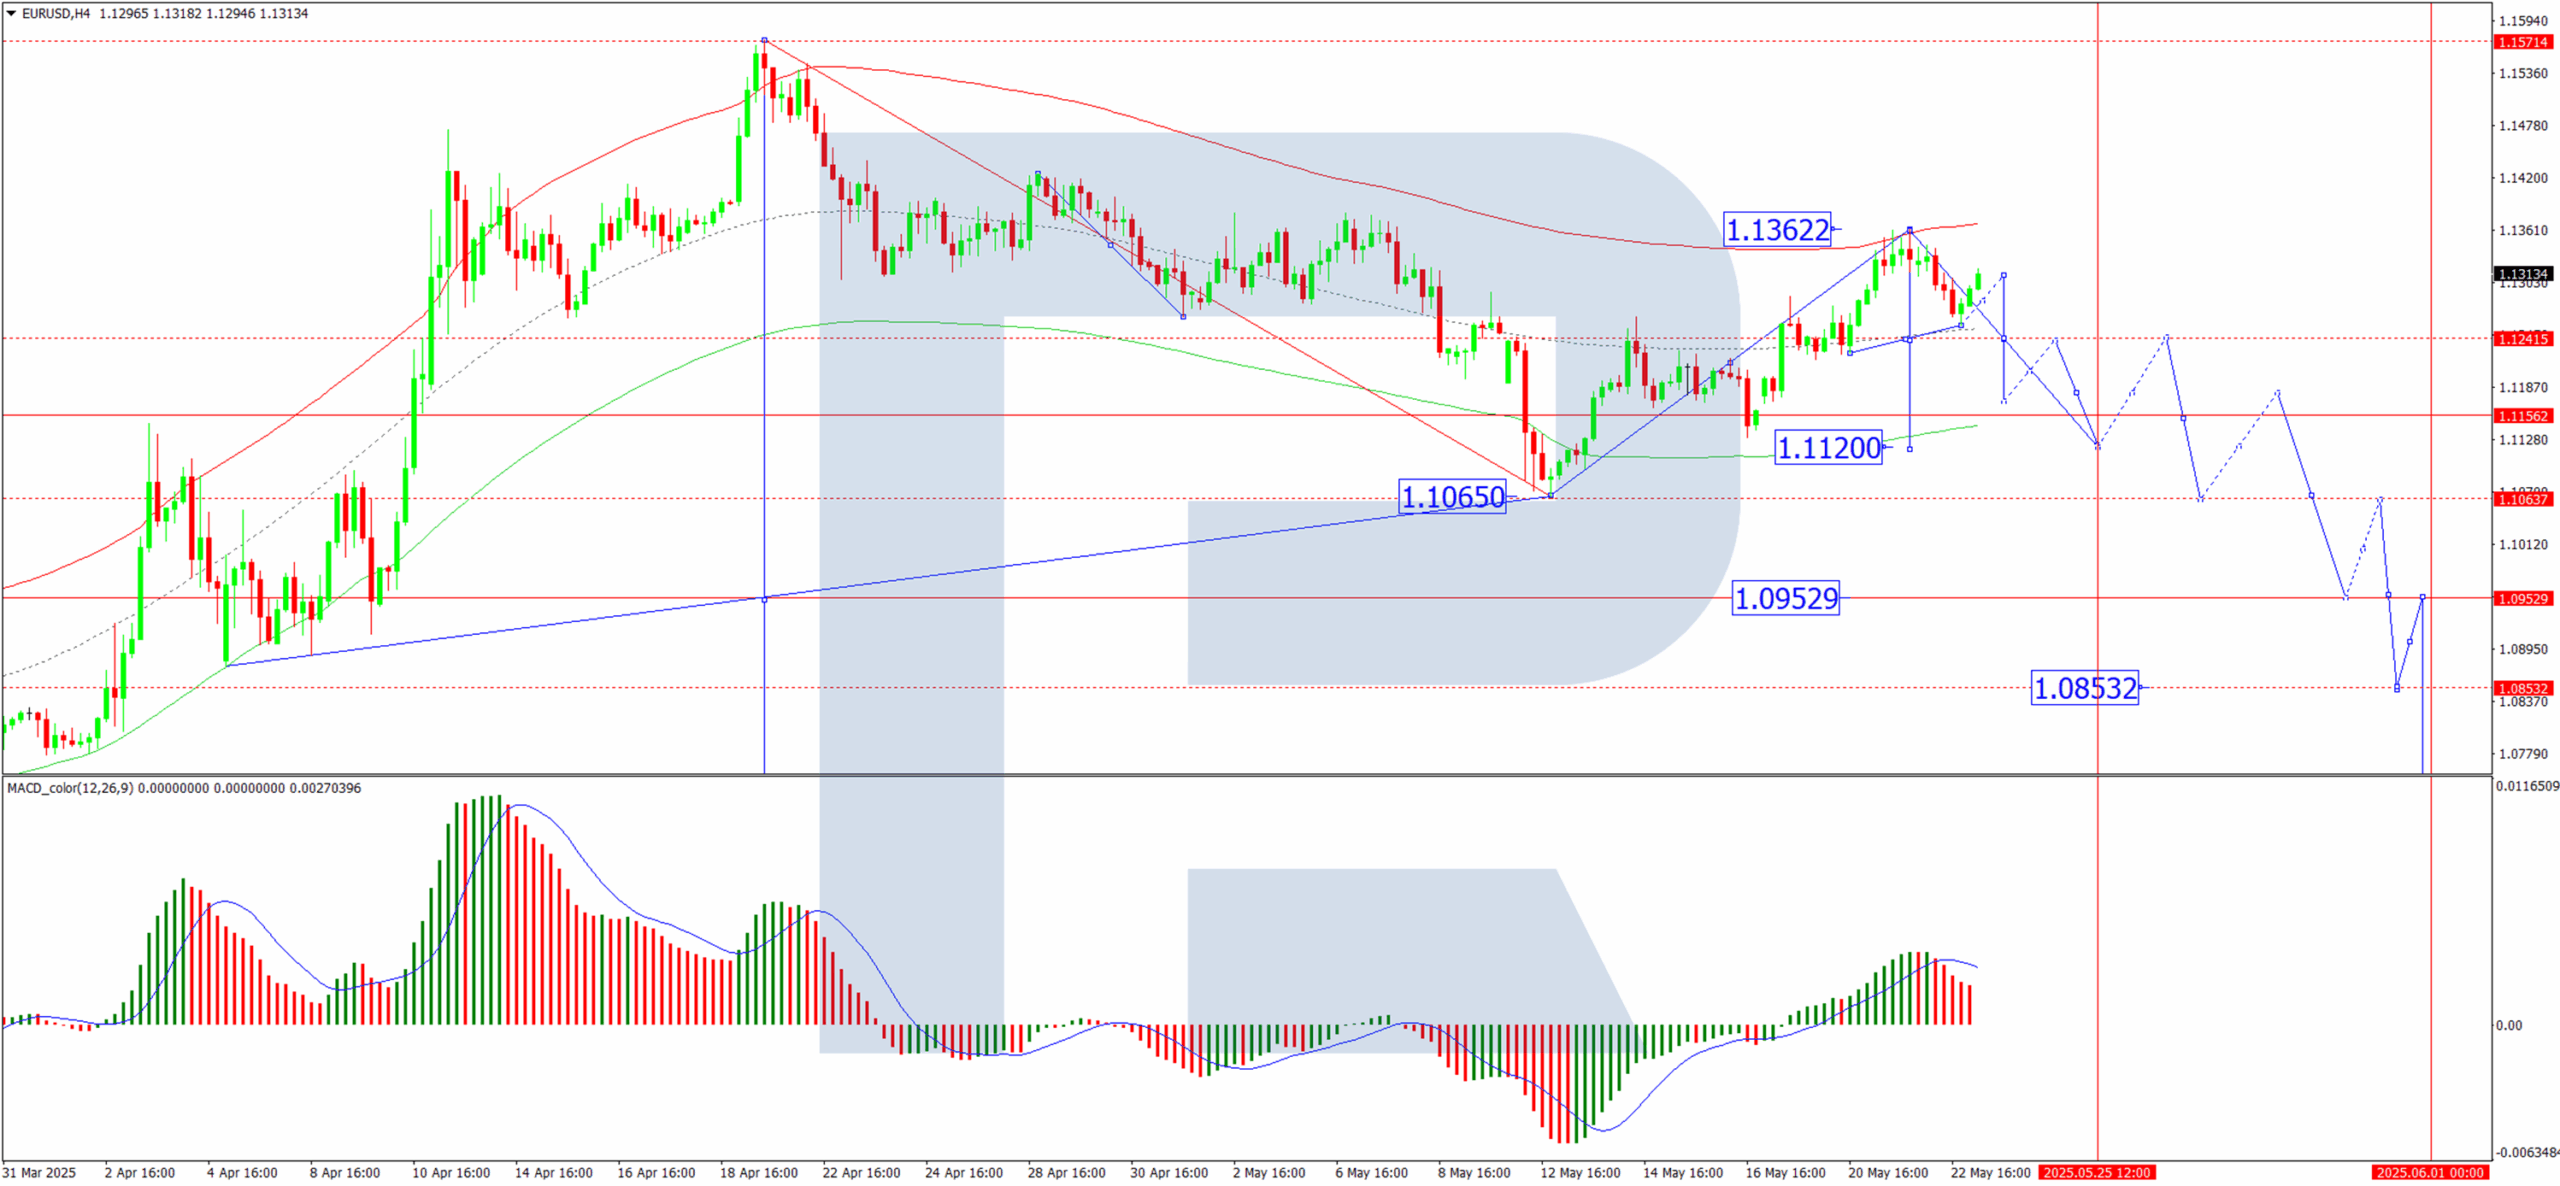
H4 Chart:
EUR/USD dipped to 1.1255 before correcting to 1.1311, with a consolidation range nearing completion. We anticipate a downward expansion towards 1.1120, supported by the MACD indicator, whose signal line has exited the histogram zone and points decisively downward.
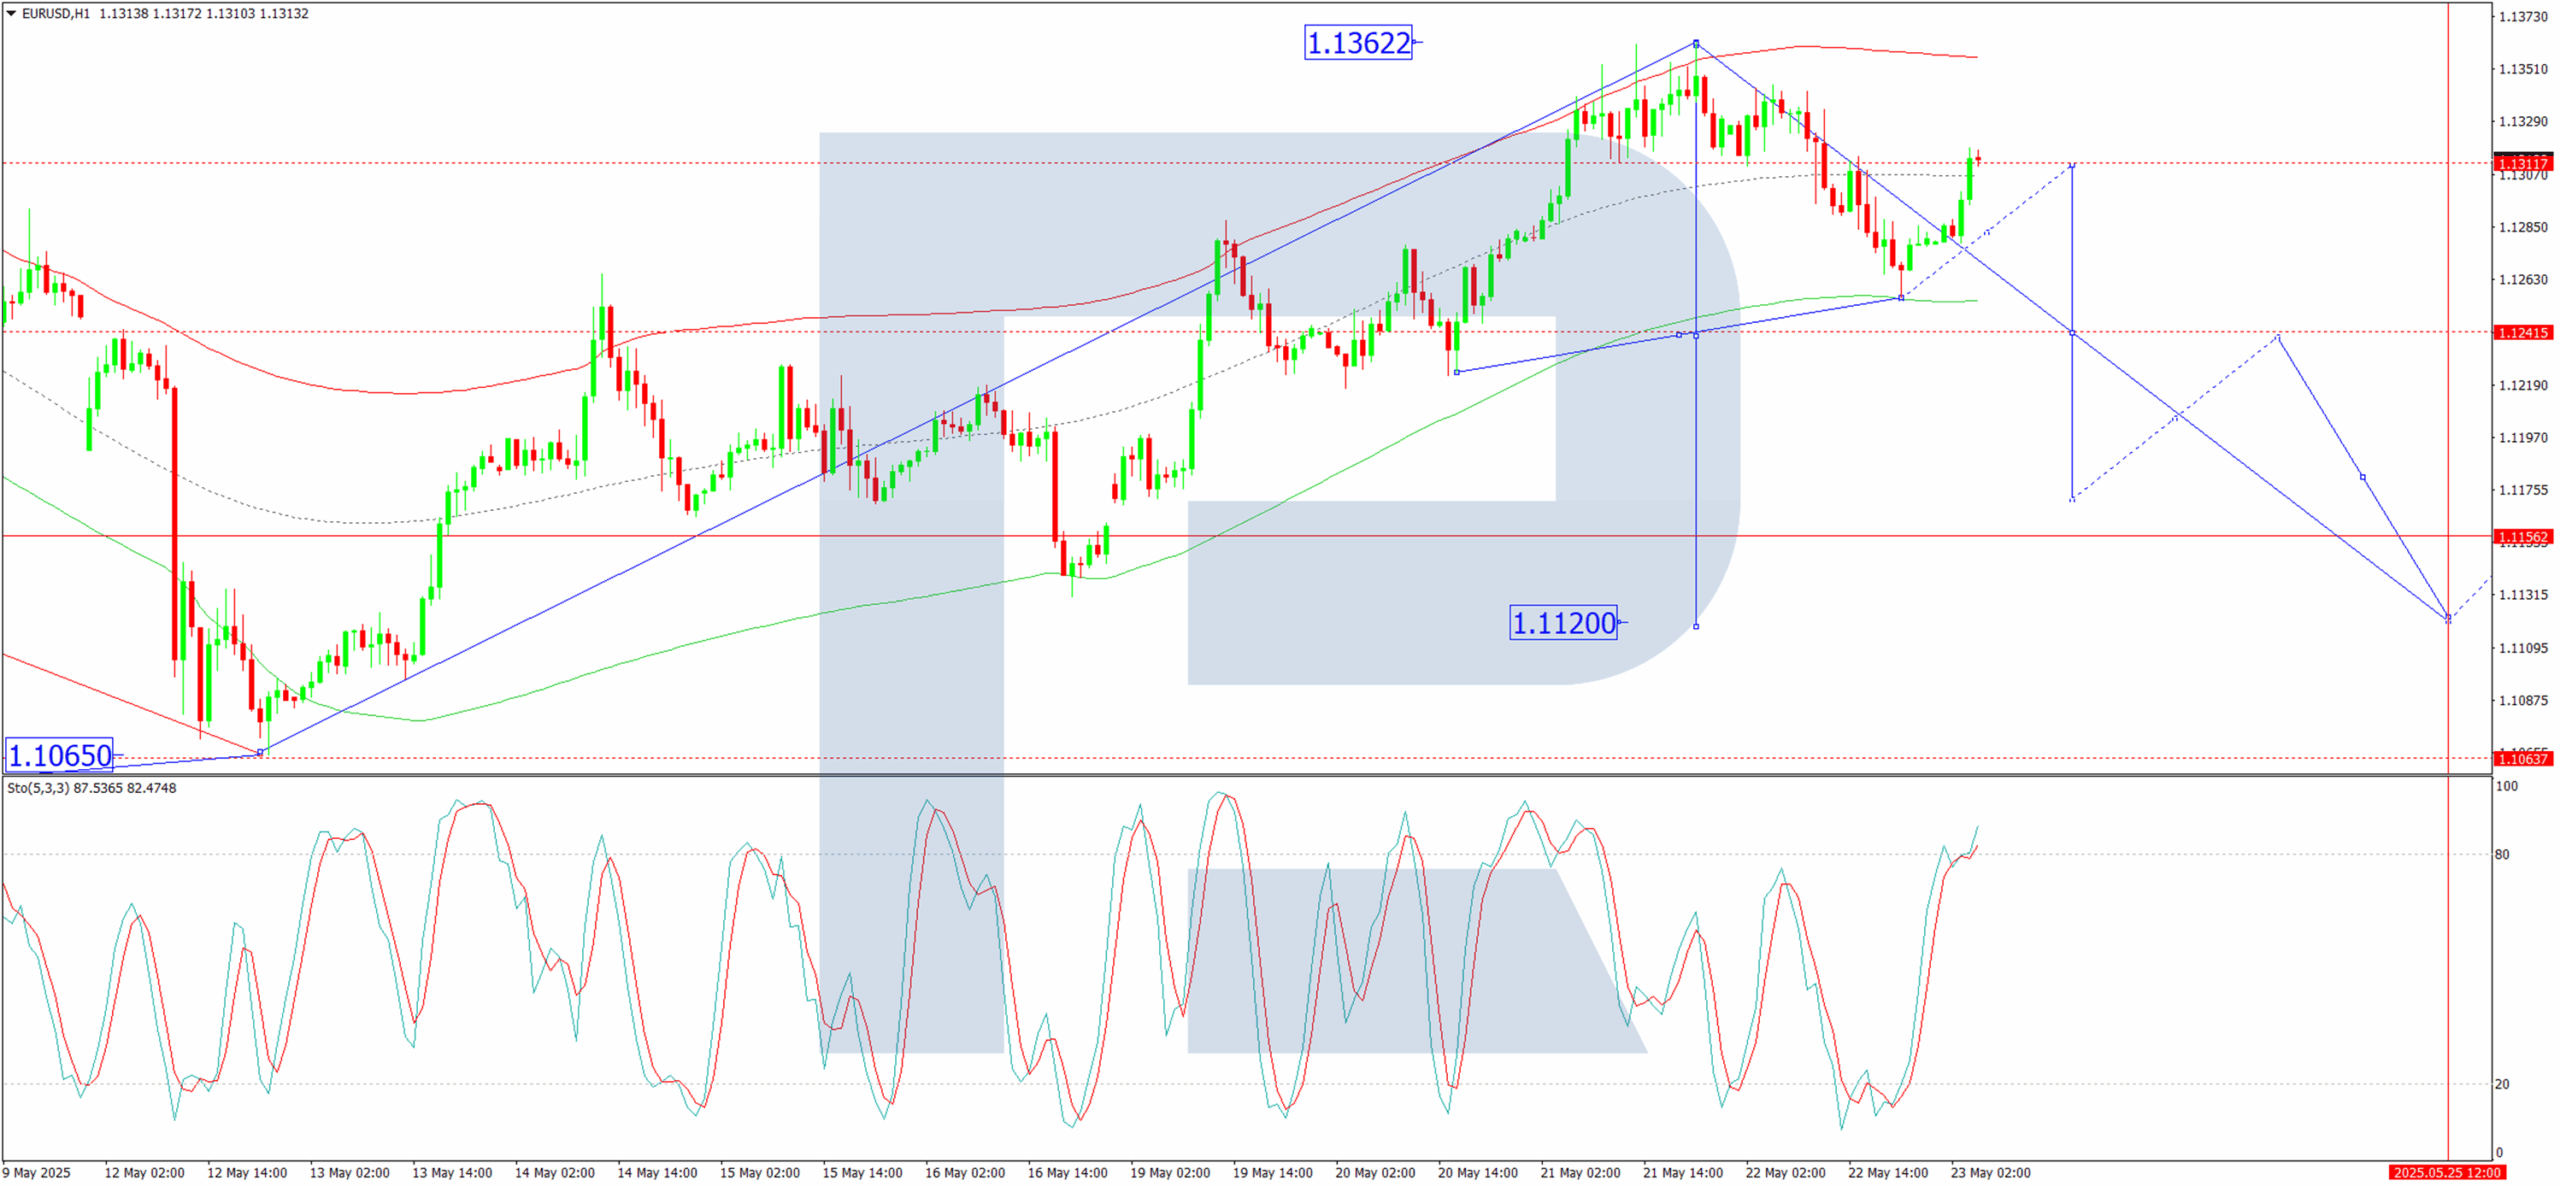
H1 Chart:
The pair is forming a downward impulse structure, followed by a correction to 1.1311. Today, a renewed decline towards 1.1240 appears likely. A break below this level could extend the downtrend to 1.1170. This scenario is corroborated by the Stochastic oscillator, with its signal line hovering above 80, poised to drop towards 20.
Conclusion
With the dollar weighed down by fiscal concerns and a credit rating downgrade, EUR/USD may extend its gains. Traders should monitor today’s US housing data for further momentum.