
Sample Category Title
Elliott Wave Analysis: Ethereum (ETHUSD) Likely Extending in Wave 5
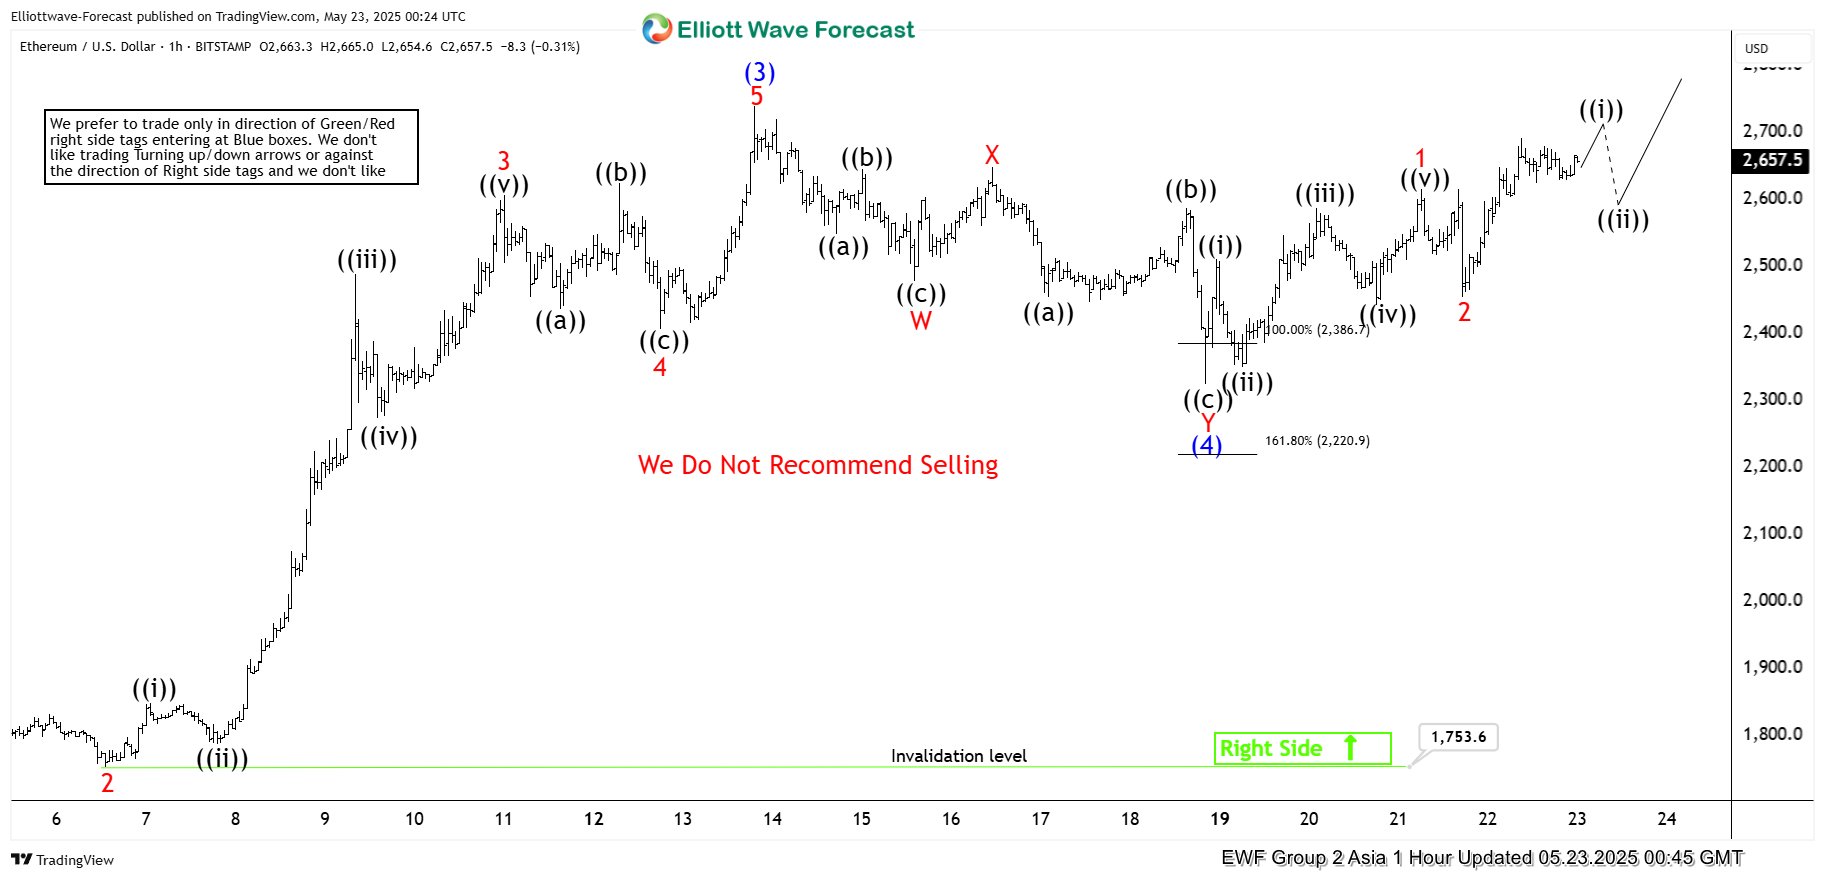
The short-term Elliott Wave analysis for Ethereum (ETHUSD) indicates that a bullish cycle, initiated from the April 9, 2025 low, is unfolding as a five-wave impulse structure. Starting from this low, wave (1) concluded at $1,687.20, followed by a corrective pullback in wave (2) that ended at $1,473. Ethereum then resumed its upward trajectory in wave (3), reaching $2,738.90, as illustrated in the one-hour chart below. The subsequent wave (4) correction formed a double-three Elliott Wave structure.
In this correction, wave W declined to $2,478.80, followed by a recovery in wave X to $2,649. The corrective wave Y then completed wave (4) at $2,405.20. From this point, Ethereum has entered wave (5), advancing with an internal five-wave subdivision. Within wave (5), wave 1 peaked at $2,615.40 as a diagonal, with wave 2 retracing to $2,454. As long as Ethereum remains above the wave (4) low of $2,405.20, the outlook favors further gains. Additionally, while the pivot low at $1,753.60 holds, any pullbacks are likely to attract buyers in a 3, 7, or 11-swing pattern, supporting Ethereum’s potential to extend higher in the near term.
Ethereum (ETHUSD) 60-Minute Elliott Wave Technical Chart
ETHUSD Elliott Wave Technical Video
https://www.youtube.com/watch?v=L7S97-Ha15U
USD/JPY Struggles To Recover, More Downsides Ahead?
Key Highlights
- USD/JPY started a fresh decline below the 145.50 support.
- It cleared a key bearish trend line with resistance at 144.00 on the 4-hour chart.
- EUR/USD gained pace for a move above the 1.1280 level.
- GBP/USD is eyeing a key upside break above the 1.3450 resistance.
USD/JPY Technical Analysis
The US Dollar failed to continue higher above 148.65 against the Japanese Yen. USD/JPY declined below the 146.00 and 145.50 support levels.
Looking at the 4-hour chart, the pair settled below the 145.00 level, the 100 simple moving average (red, 4-hour), and the 200 simple moving average (green, 4-hour). The bears even pushed the pair below the 144.00 level. A low was formed at 142.80 and the pair is now consolidating losses.
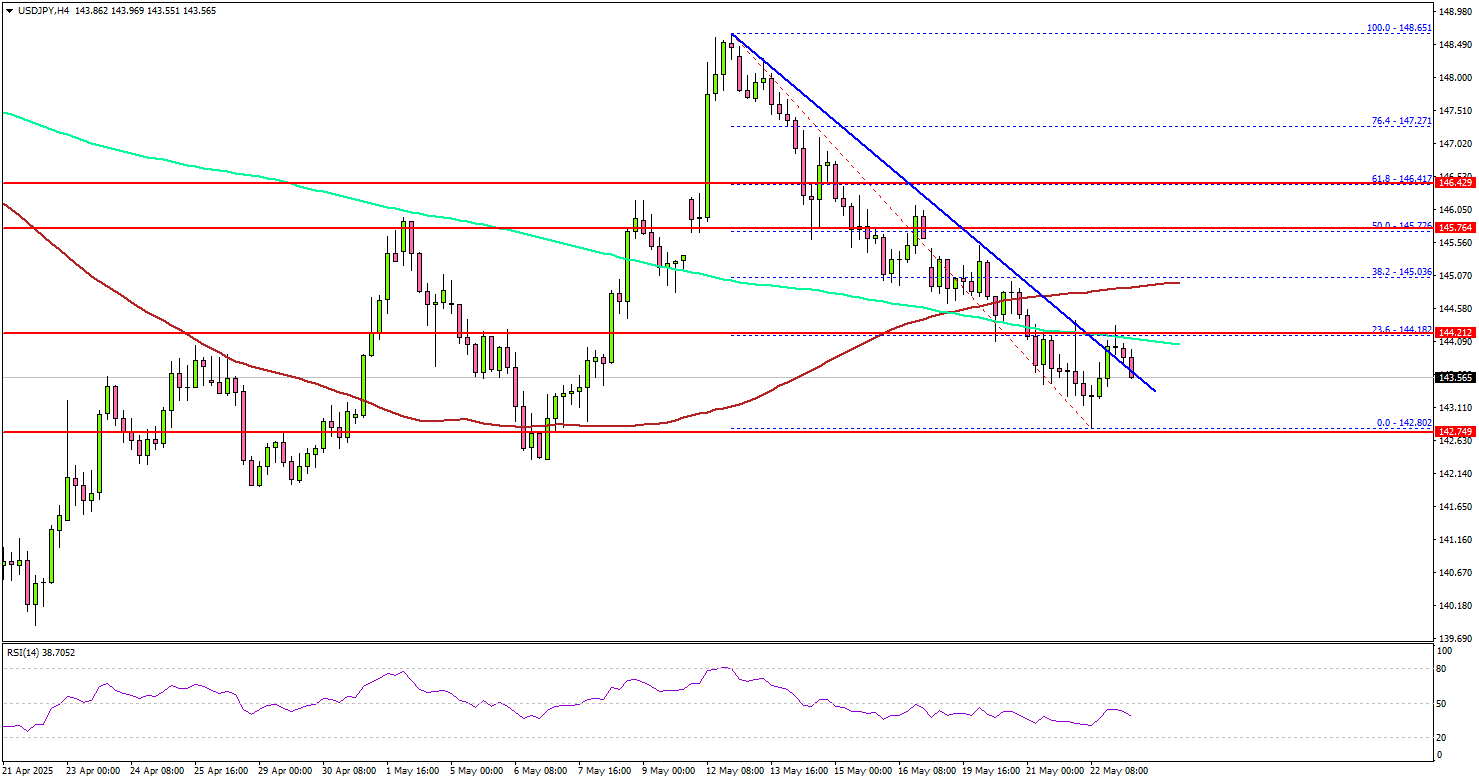
There was a break above a key bearish trend line with resistance at 144.00 on the same chart. However, the bears are active near the 144.20 level and the 200 simple moving average (green, 4-hour).
On the upside, the pair could face resistance near the 144.20 level. The next key resistance sits near the 145.00 level and the 100 simple moving average (red, 4-hour). The first major resistance sits at 145.50. A close above the 145.50 level could set the pace for another increase.
In the stated case, the pair could even clear the 146.85 resistance. The next major stop for the bulls could be near the 147.20 resistance.
On the downside, immediate support sits near the 143.20 level. The next key support sits near 142.80. Any more losses could send the pair toward the 142.00 pivot level in the near term. The main support could be near 140.00.
Looking at EUR/USD, the pair managed to avoid more losses and started a recovery wave above the 1.1280 level.
Upcoming Economic Events:
- US New Home Sales for April 2025 (MoM) – Forecast -0.2% versus +7.4% previous.
Cliff Notes: RBA Increasingly Confident on Inflation Risks
Key insights from the week that was.
As widely expected, the RBA delivered a 25bp rate cut on Tuesday, bringing the cash rate to 3.85%. In contrast to the relatively hawkish cut of February, the latest move was framed as a “confident cut” by Governor Bullock – recognition that inflation has since been confirmed in the target band and, on an underlying basis, is “expected to be around the midpoint” through to June 2027.
Further justifying the shift in tone in the RBA’s post-meeting communications was the change in the balance of risks since February. On the domestic front, the Board note that “the pick-up [in household consumption] will be a little slower than was expected three months ago”, a trend evident in card activity data for some time; although, lingering labour market tightness continues to limit their concern over the activity outlook. Offshore, the growth outlook is abnormally uncertain, and the RBA recognises this could contribute “to a weaker outlook for growth, employment and inflation in Australia”.
As discussed by Chief Economist Luci Ellis in a video update midweek, Governor Bullock stated that the domestic factors – lower inflation and downside risks to consumption – were enough to warrant May’s rate cut, but that the global backdrop strengthened the case further. That the Board considered a 50bp rate cut emphasises policy makers are willing to deliver further relief if/when the data and risks warrant. If the labour market remains in robust health and global risks do not crystalise, a 25bp cut in August and November seems the most probable path for policy, bringing the cash rate to a broadly neutral 3.35% by year end.
Offshore, it was a quiet week on the data front.
China’s April data round was on the soft side. Retail sales growth rose to only 4.7%ytd against the market’s expectation of a 5.0%ytd gain. Growth by sub-component was variable but broad based – only petroleum and autos went backwards over the past year, and arguably only as a result of price declines. Fixed asset investment was also sub-par (4.0% ytd) and heavily concentrated amongst state-backed firms – private investment essentially unchanged from 2024 (0.2%ytd). Industrial production meanwhile showed continued strength (6.4% ytd), led by growth in semiconductors and electric vehicles.
Continuing the steady flow of policy support, Chinese authorities this week cut the 1-year and 5-year Loan Prime Rates by 10bps to 3.0% and 3.5% respectively having already lowered the Reserve Requirement Ratio early in the month. Authorities remain committed to their 5.0% growth target for 2025, but are likely to wait and see the outcomes of trade negotiations with the US before deciding the next steps for stimulus. The 90-day truce with the US will provide additional near-term support for GDP growth, keeping the growth target within reach without aggressive stimulus.
Further afield, April CPI readings showed a re-acceleration in inflation in the UK and Canada. Annual UK headline inflation rose to 3.5%yr in April, the first reading above 3.0% since March 2024. Energy prices were the main driver as subsidies roll off. Transport (3.3%yr) and recreation & culture (3.1% yr) also contributed meaningfully. Abstracting from food and energy, core inflation rose to 3.8%yr in April from 3.4%yr in March.
In Canada meanwhile, headline inflation eased to 1.7%yr, largely due to falling gasoline prices after the removal of the consumer carbon tax on April 1. However, trimmed mean core inflation rose from 2.8%yr to 3.1%yr, surprising market participants.
For these nations’ central banks, balancing upside inflation risks and growth concerns will remain a challenge. With limited fiscal capacity and monetary policy still restrictive, the Bank of England is likely to prioritise growth over inflation in the near term. In contrast, with greater fiscal flexibility and accommodative monetary policy, the Bank of Canada is expected to remain more focused on inflation expectations and risks. In its last statement, the BoC alluded to this noting “Monetary policy cannot offset the impacts of a trade war. What it can and must do is ensure that higher prices do not lead to ongoing inflation.”
As a final note, overnight President Trump’s tax bill passed the House in a 215-214 vote after a week of negotiations. Passage through the Senate is likely to prove much more challenging and may also see changes to the bill that are unpalatable for the House. The administration still has 7 months to pass the bill through Congress before the temporary tax cuts currently in effect lapse. However, the debt ceiling, which the current bill also looks to address, will become a binding constraint again in August or September. More broadly, every week that slips past debating these issues is one less the Administration and the House majority has to craft and debate the deregulation initiatives financial markets expect from this Administration. If such measures are not forthcoming, an additional risk to medium-term US growth prospects may be priced by markets.
USD/JPY Forecast: Dollar-Yen Remains Bearish as Price Slides Below 144.00
In today’s session, USD/JPY trades 0.03% higher, having fallen below the key level of 144.000 courtesy of a weaker dollar, increased safe-haven demand, and a narrowing interest rate differential.
USD/JPY Key Takeaways
- Primarily due to a fall in dollar value, USD/JPY currently trades at around ~144.058, representing two-week lows for the currency pair
- Renewed tariff fears, geopolitical tensions, and general uncertainty on the US economy are allowing the Japanese yen to strengthen against the U.S. dollar
USD/JPY: Yen benefits from renewed safe-haven flows
With global equities somewhat wobbly this week, markets have made a notable shift towards yen strength, renewing demand for typical safe-haven assets.
Compounded by a credit rating downgrade on U.S. sovereign debt last week, nervousness surrounding US trade policy and the latest developments on Trump’s ‘big, beautiful’ tax bill have done little to calm market nerves, with questions rising on how the current administration will address a ballooning US deficit and rising interest costs.
At least in part, the outcome has been a weaker dollar, with USD/JPY trading around ~1.09% lower in this week’s trading.
USD/JPY: Tide turning on Japanese bond yields
Snoynmous with ultra-low interest rates for the best part of 20 years, the Bank of Japan’s change in monetary policy, bookmarked by the appointment of Kazuo Ueda, represents a profound shift in perception for the Japanese economy, and by extension, the yen.
At least one outcome has been rising Japanese bond yields, with longer-dated treasuries gaining value massively under the new monetary policy outlook. Recently, the 30-year yield hit a 25-year high of ~3.2%, while the 40-year yield reached over ~3.5%, its highest point since inception in 2007.
With the differential between US and Japanese treasuries becoming increasingly narrow, the dollar is becoming less attractive to hold, especially when considering the stark difference in current predictions on future monetary policy of the Fed and the Bank of Japan, respectively.
Worsened by a continuing unwinding of the infamous yen carry trade, any further reduction in the yield differential between US and Japanese treasuries will likely encourage further USD/JPY downside.
USD/JPY: Increased US rate cut bets weaken dollar-yen exchange rate
With markets currently pricing in two Fed rate cuts and one Bank of Japan rate hike before year-end, the attractiveness of holding the dollar over the yen, at least by some metrics, is set to be reduced.
While the latest US data shows inflation cooling faster than first predicted, Japanese inflation remains stubborn, further cementing current monetary policy predictions.
Further commitment to this narrowing interest rate differential trajectory, whether in policy decisions or general commentary, will likely lead to further USD/JPY downside.
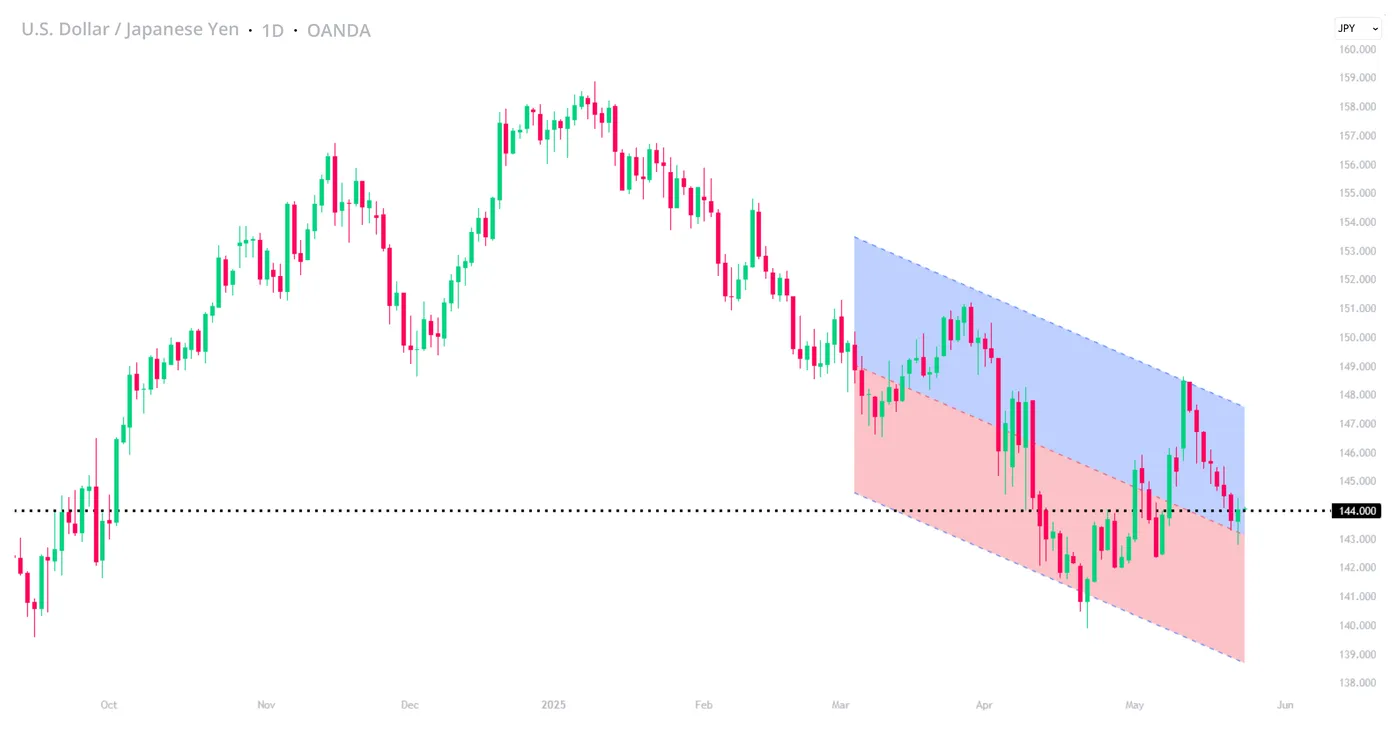
A chart showing the recent price action of USD/JPY. OANDA,TradingView, 22/05/2024
USD/JPY technical analysis
- Breaking a 6-day losing streak in today’s session, USD/JPY remains bearish at a technical level. Decisively breaking the key level of 145.000 earlier this week, bears will likely target previous lows at ~142.384 in price breaks down further
Ethereum Eyes Gains as It Trails Bitcoin’s Rally
- Bitcoin really stood dominant in the past 6 months while Ethereum was lagging against other cryptocurrencies such as Solana and XRP.
- Is Ether going to play catch-up? An in-depth technical analysis is due for the second biggest crypto.
- ETH Revisits levels last seen in February 2025 around the $2600 mark.
An Overview on the Cryptocurrencies Market
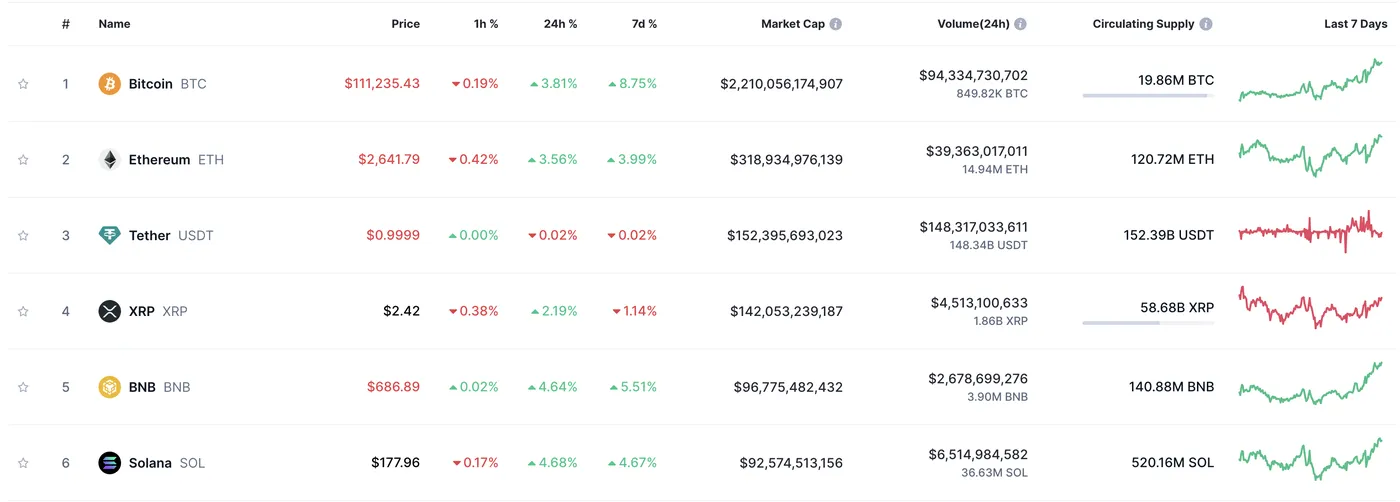
Top 6 Cryptocurrencies by their Market Cap. Source -- coinmarketcap.com
Ethereum still stands as the second biggest cryptocurrency even after lagging on the rally that took Bitcoin and Solana to their own all-time highs.
There are concerns surrounding the cryptocurrency that pioneered smart contracts, as it faces higher transaction costs and slower processing speeds compared to its closest competitor, Solana (SOL).
It is important to note though that the development of ETFs for the Cryptocurrency tends to boost its performance, as we have seen with the past year introduction of BTC ETFs.
Besides, Bitcoin hitting fresh all-time highs in today's overnight session tends to provide a boost to the overall crypto market.
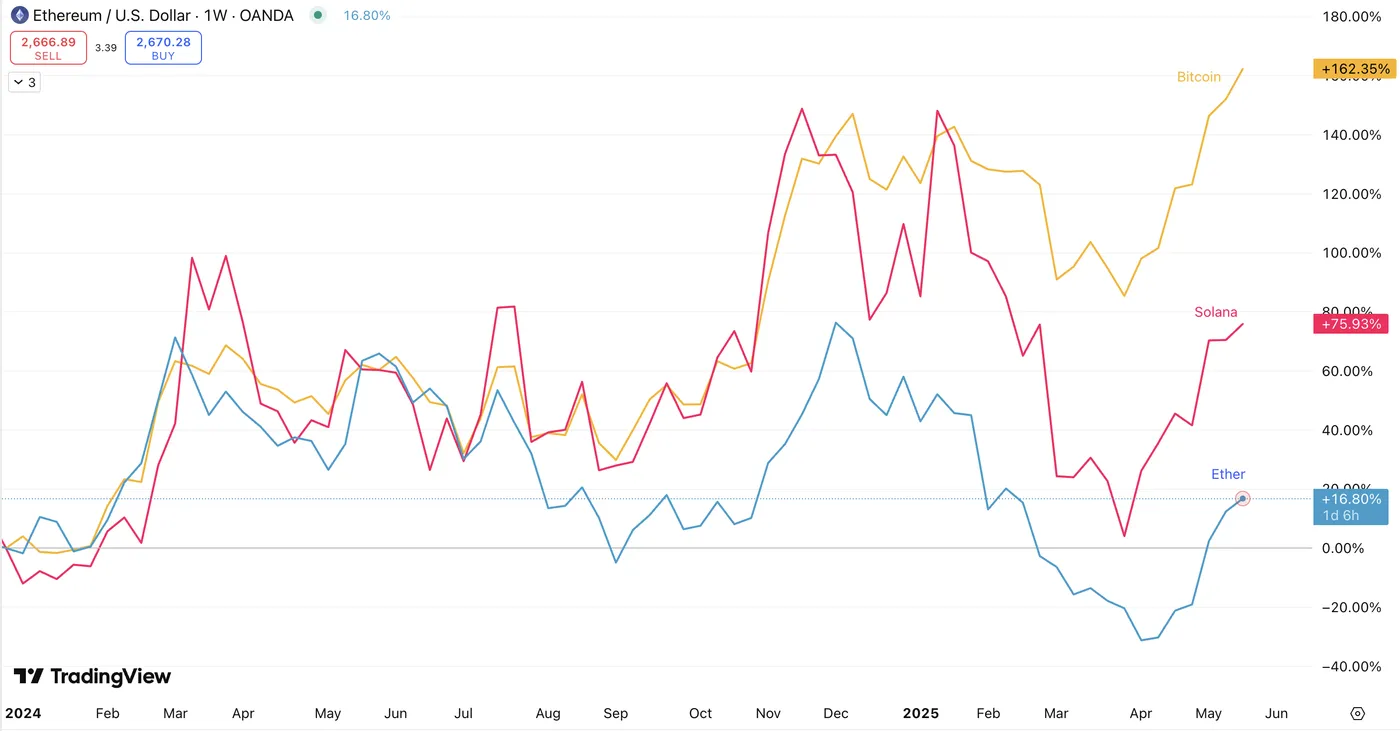
ETH performance vs BTC and SOL, Jan 2024 to today. Source - TradingView.
Ethereum in-depth Technical Analysis
ETH Weekly Levels
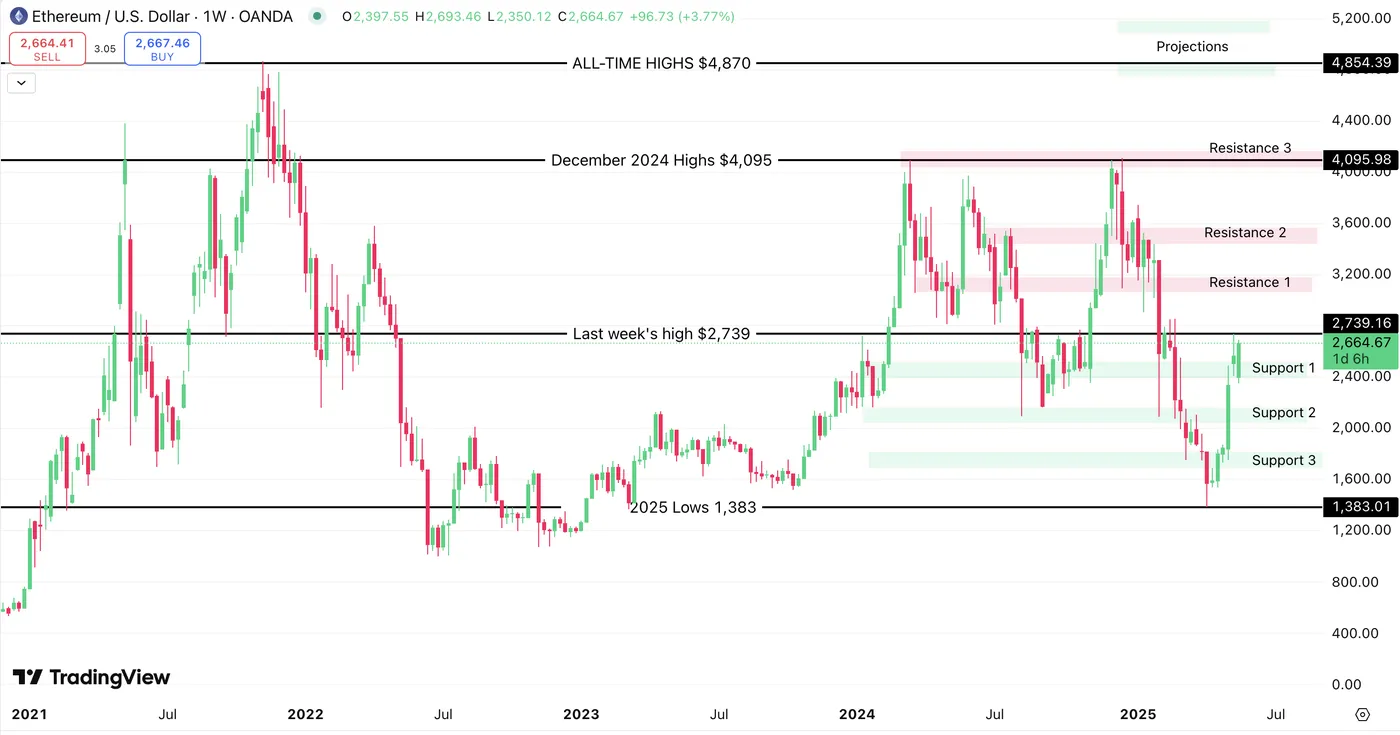
Ethereum Weekly Chart, 2021 to May 22, 2025. Source - TradingView
The weekly charts point to a decent comeback from the crypto with strong bullish candles the past 4 weeks.
We are currently in a support zone on the weekly timeframe, though prices will have to consolidate here to avoid it becoming a bearish pivot zone.
Resistance and Support Zones to look for on the weekly:
- S1: 2,385 - 2,525
- S2: 2,035 - 2,167
- S3: 1,700 - 1,825
Note that prices will already have to break last week highs of $2,739
- R1: 2,850 - 2,992
- R2: 3,225 - 3,363
- R3: 3,660 - 3,800
- December 2024 highs: $4,095
ETH Daily Levels
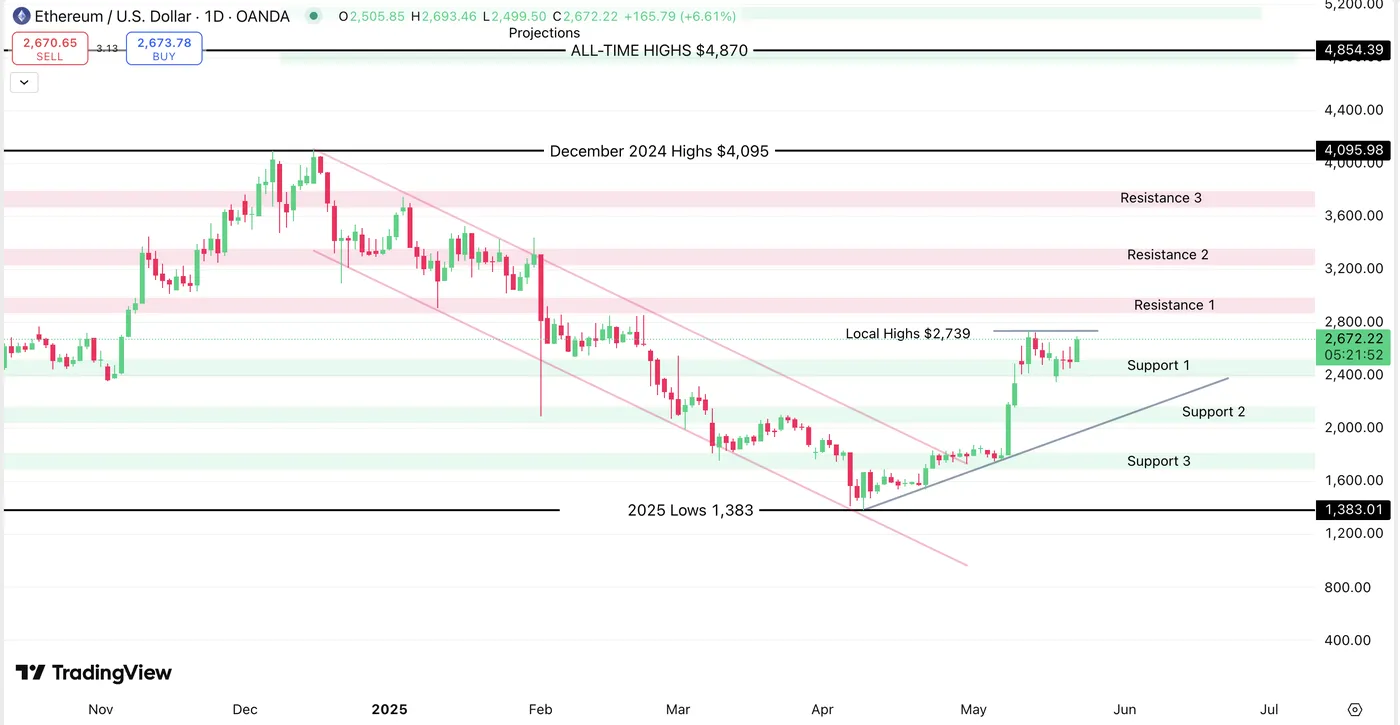
Ethereum Daily Chart, November 2024 to May 22, 2025. Source - TradingView
Daily support and resistance zones for the ETH are similar to the ones found on the weekly timeframe.
ETH has to break above the 14th of May 2025 Highs at $2,739 for a further bullish breakout - though the trend is still bullish as long as we maintain above S1.
ETH Closer View - 4H Chart
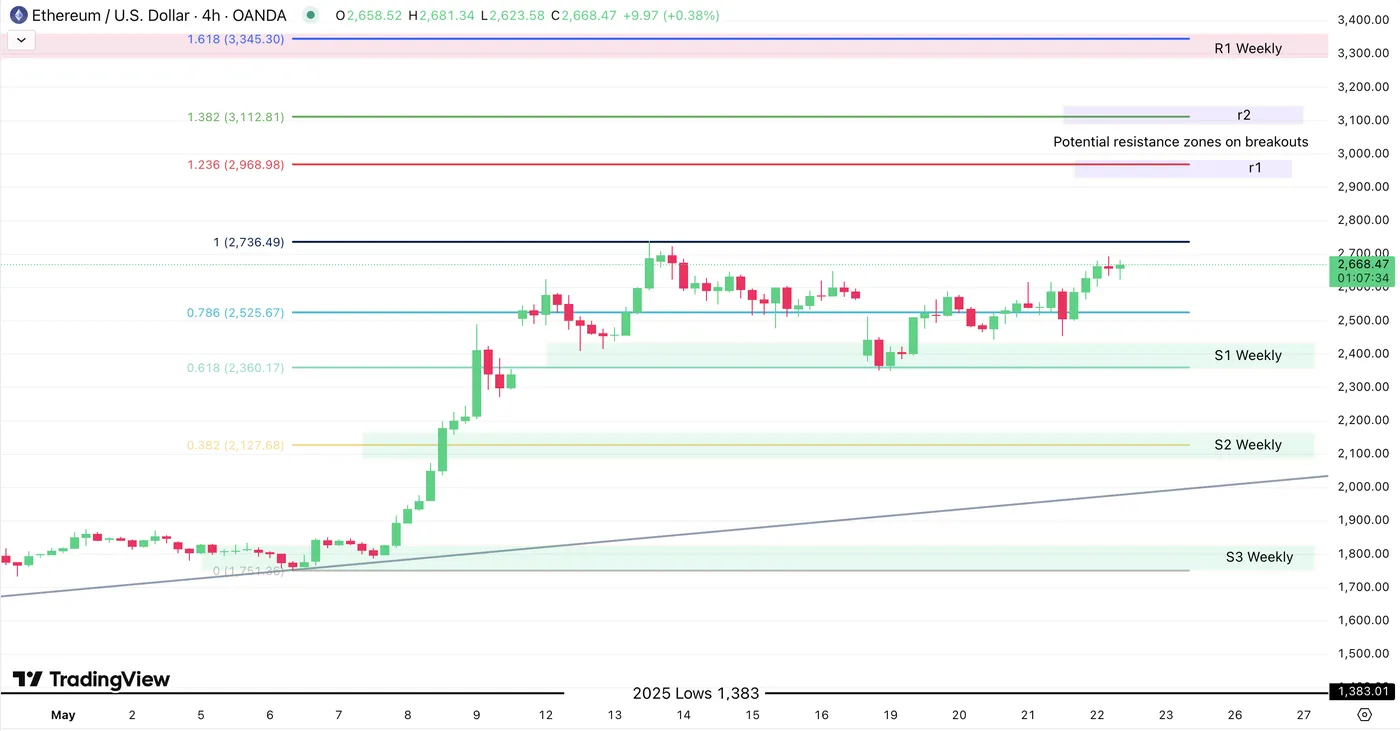
Ethereum 4H Chart, May 2025. Source - TradingView
Ethereum is consolidating at its local highs, a good sign generally as the local top at $2,739 did not form clear lower highs. Prices are now looking to retest the last week highs.
Fibonacci Levels on this 4h charts are key to spot potential support and resistance zones for entry and/or position closes.
Observe how levels on this tool coincide with Support and Resistance zones from bigger timeframes.
r1 and r2 on the chart indicate potential resistance zones to expect on a breakout.
- r1: 2,926 - 3,000
- r2: 3,086 - 3,150
Safe trades!
EURUSD Tactical Retreat Ahead of 1.25 Spurt
The single currency is losing ground against the dollar, pulling back to 1.13 on weak PMIs. This helps the 1.12-1.15 area cement its title as a multi-year pivot area. However, today’s momentum may prove to be just a short game within a longer-term uptrend towards 1.20-1.25.
On the daily timeframes, EURUSD pushed away from the 50-day moving average in March, starting a rapid rise and later breaking above the 200-day. From late April to mid-May, the overheated market corrected within a classic Fibonacci pattern, and EURUSD regained support at the 50-day touch.
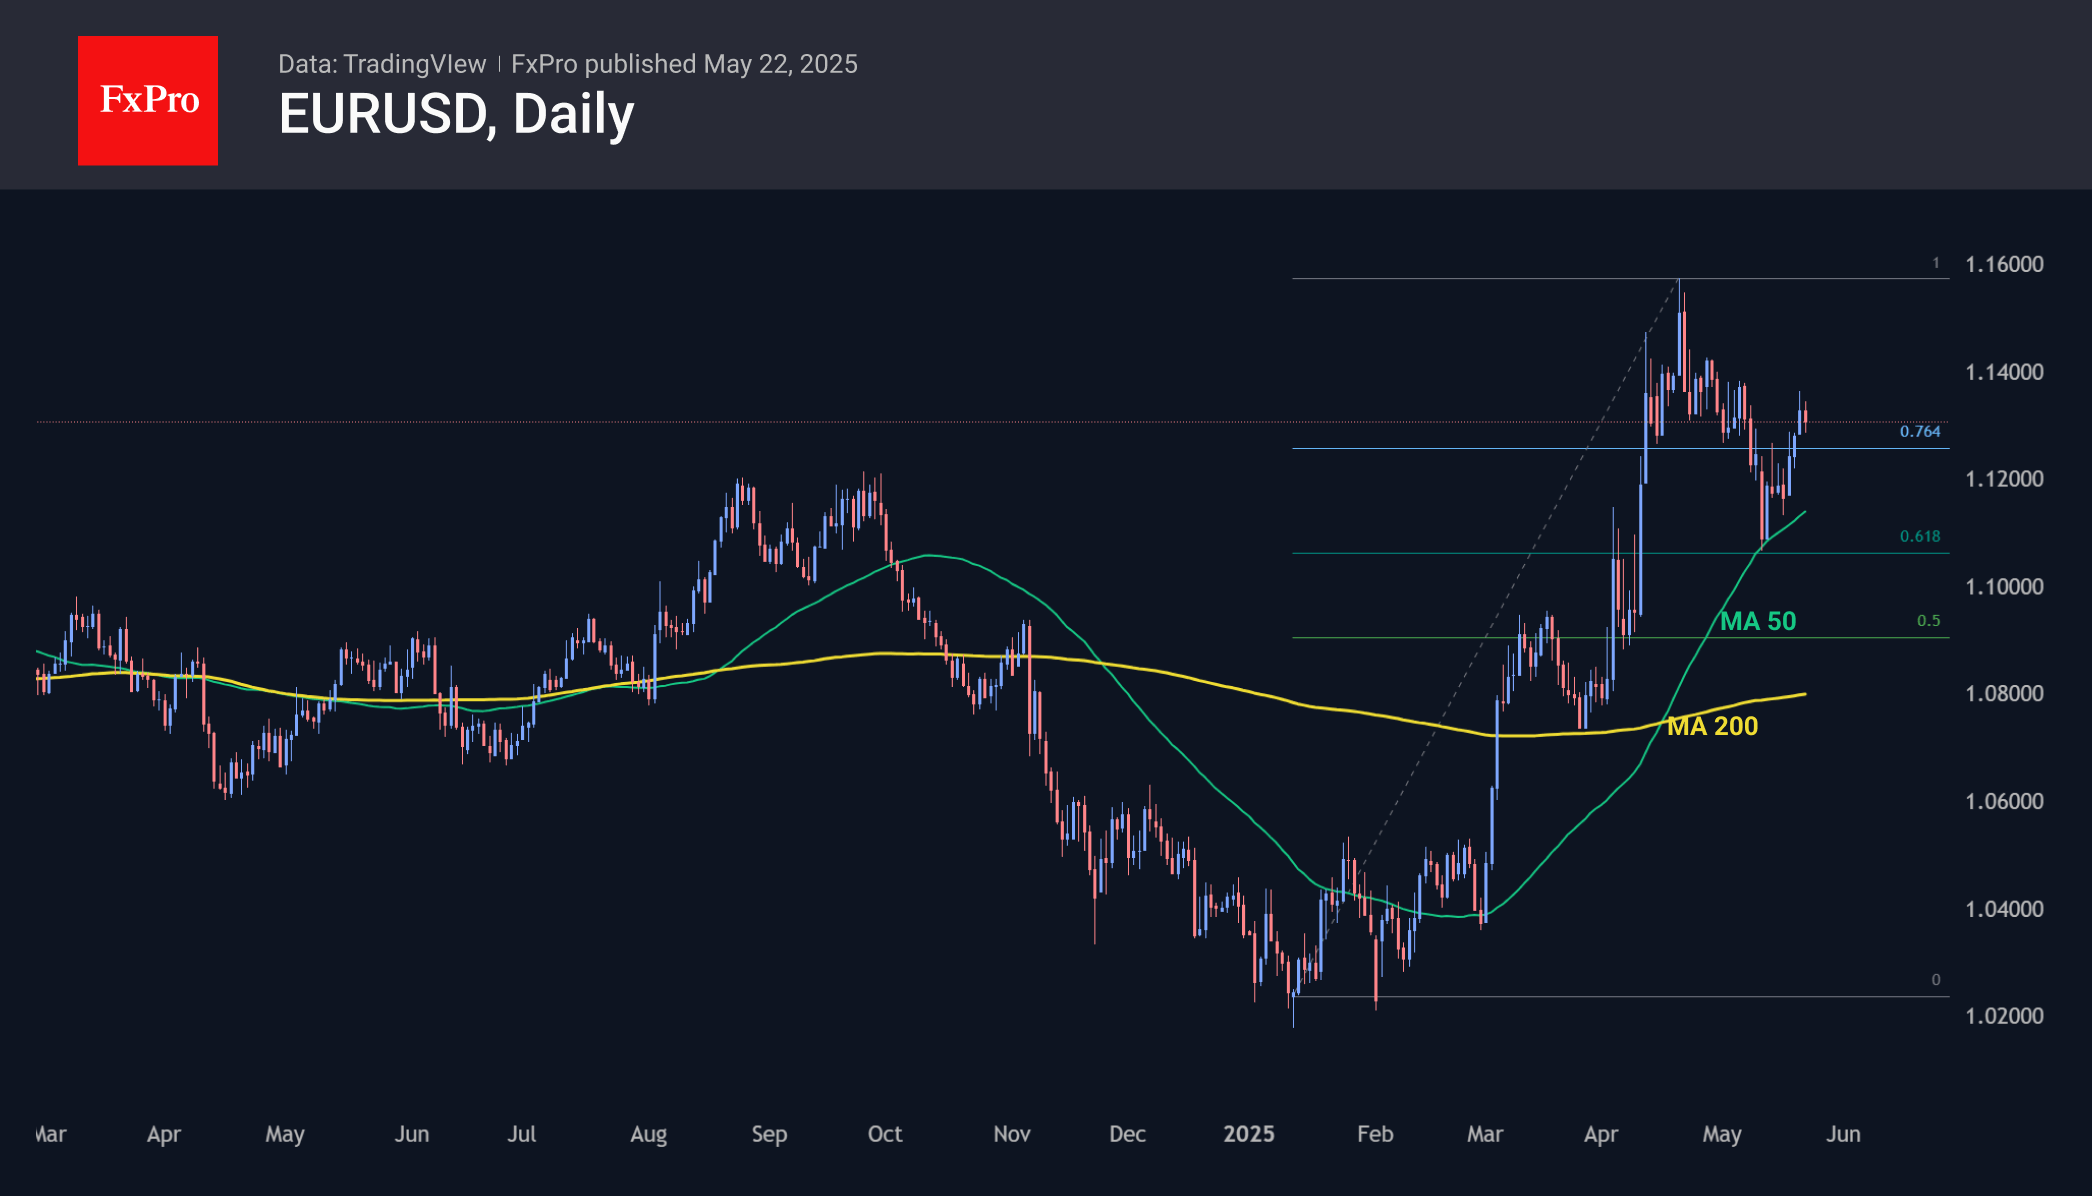
The recovery of the uptrend reinforces our belief that we have seen a corrective pullback and not a reversal. This is also evidenced by the fact that EURUSD quickly returned above 1.12, which served as a reversal point from upside to downside for the previous two years. Now it is working as support.
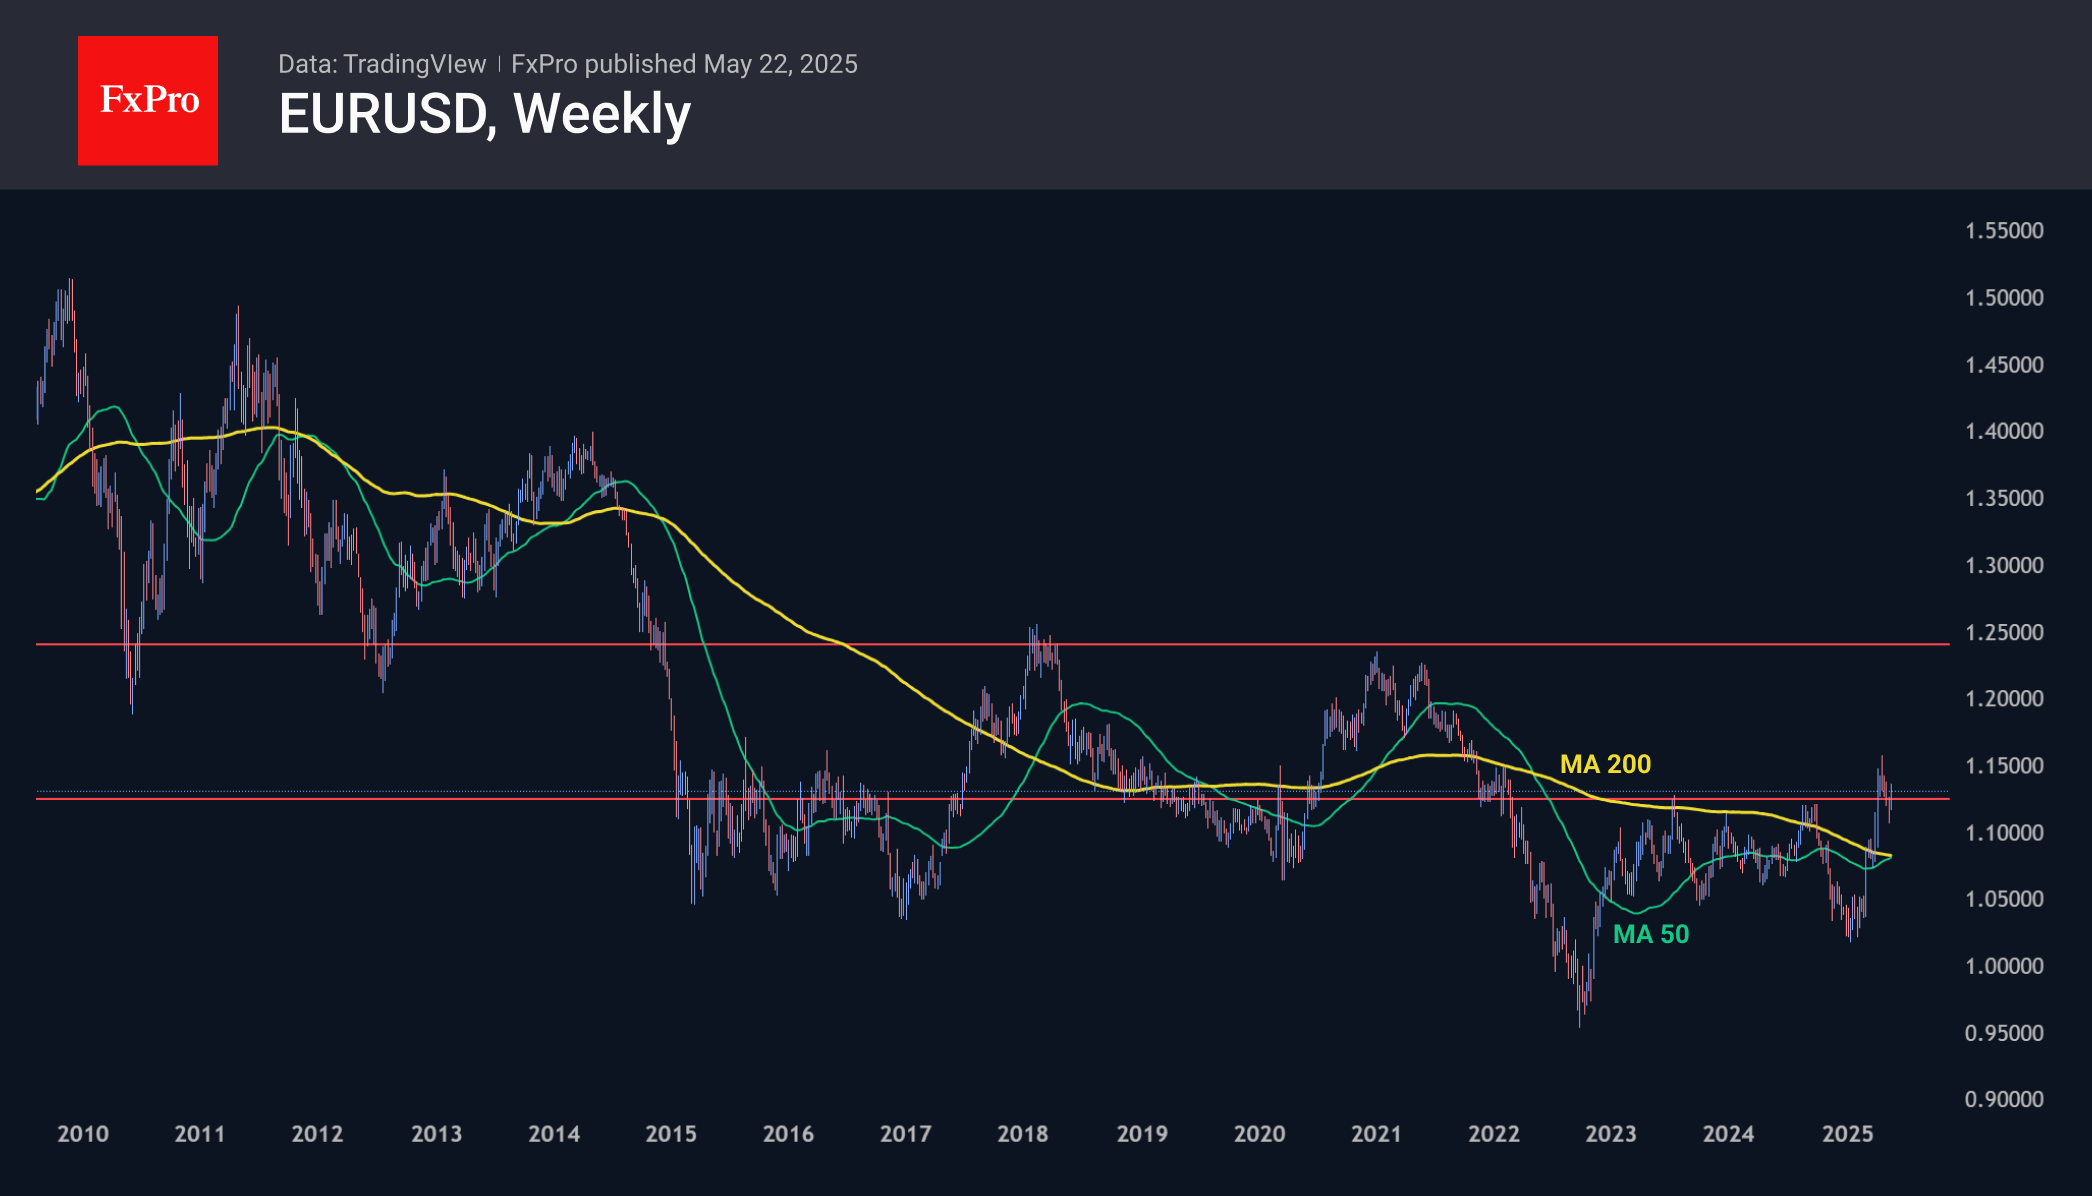
Only overcoming the previous peaks at 1.1570 will confirm the uptrend. However, a bullish signal is already forming on the weekly timeframes—a golden cross, as the 50-week moving average is preparing to exceed the 200-week moving average.
A consolidation above the broad 1.05-1.12 corridor is likely to be followed by an entry to a new floor with support at 1.12 and resistance in the 1.25 area, where the market reversed down in 2018 and 2021, but from 2008 to 2014 the ‘ceiling’ of this range was support for the pair.
That is, the EURUSD’s corrective pullback since late April could be just a tactical consolidation of forces before a further breakout with a long-term target at 1.25.
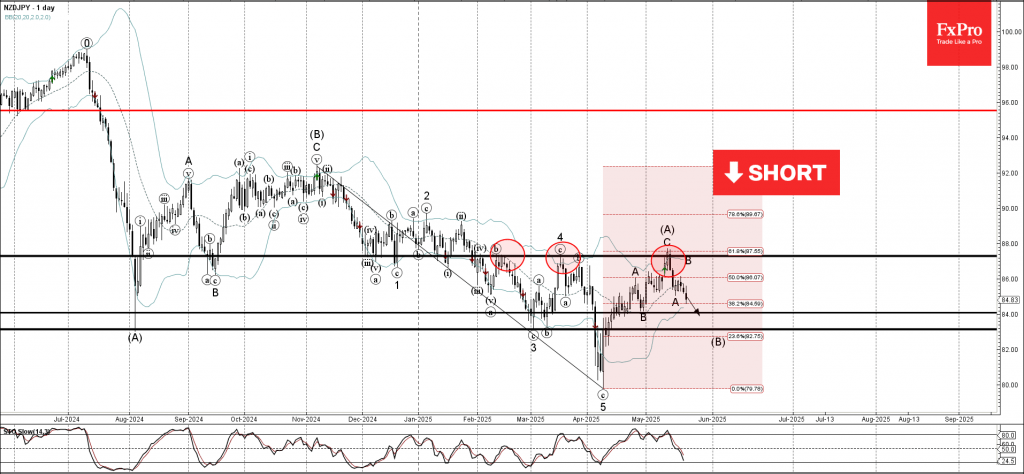
NZDJPY Wave Analysis
NZDJPY: ⬇️ Sell
- NZDJPY reversed from resistance zone
- Likely to fall to support level 84.00
NZDJPY currency pair recently reversed down from the resistance zone between the resistance level 87.30 (which has been reversing the price from February, as can be seen below), upper daily Bollinger Band and the 61.8% Fibonacci correction of the downward impulse from November.
The downward reversal from the resistance zone stopped the previous intermediate ABC correction (A).
Given the overriding daily downtrend, NZDJPY currency pair can be expected to fall to the next support level 84.00 (low of the previous minor correction B).
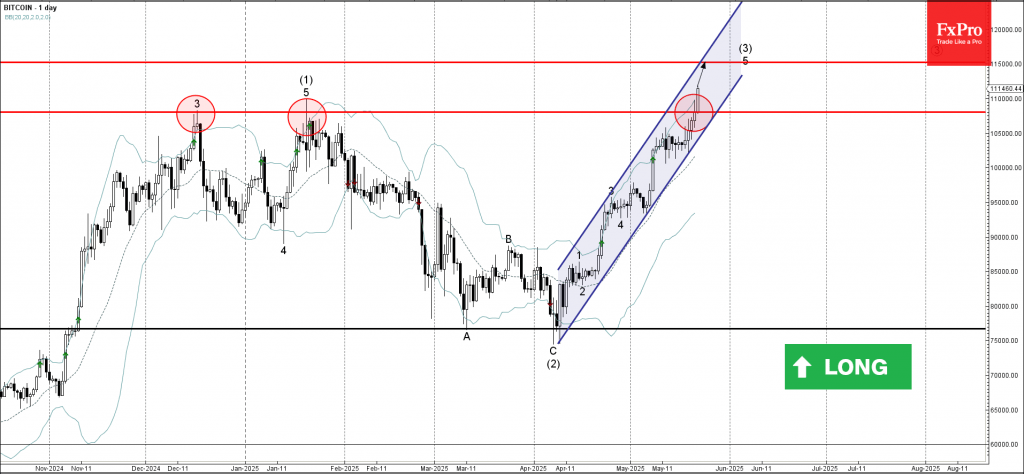
Bitcoin Wave Analysis
Bitcoin: ⬆️ Buy
- Bitcoin broke key resistance level 108055.00
- Likely to rise to resistance level 115000.00
Bitcoin cryptocurrency pair recently broke above the key resistance level 108,055.00 (former monthly high from December and January, as can be seen below).
The breakout of the resistance level 108055.00 accelerated the active minor impulse wave 5 of the intermediate impulse wave (3) from the start of April.
Bitcoin cryptocurrency can be expected to rise to the next resistance level 115,000.00 (which is the target price for the completion of the active minor impulse wave 5).
Sunset Market Commentary
Markets
The flash EMU May PMI’s disappointed. After hovering just north of the 50 level that separates growth from contraction in the first four months of the year, it unexpectedly dropped from 50.4 to 49.5. As the HCOB chief economist indicated: US tariffs are not to blame. It is domestic oriented services dropping from 50.1 to 48.9. Manufacturing production (51.5) rose for the third month in a row. Germany (composite 48.6 from 50.1) joined France in contraction territory (48). S&P indicates that the rest of the euro area continues to register growth, but the pace slows. S&P sees the May reading as in line with 0.1% Q/Q EMU Q2 growth, compared to 0.3% in Q1. Orders for services still declined further. New orders in manufacturing stabilized. Despite the pause in the implementation of tariffs, business confidence also declined further after the drop in April. Services confidence dropped to lowest level since September 2022. Inflation indicators mostly slowed, but the picture wasn’t unequivocal. Services input prices still rose sharply, but the rise selling prices eased. Manufacturing input costs declined as did selling prices. With higher services inflation mainly due to high wage growth, this remains mixed input for the ECB. Even so, markets see current mix as justifying the ECB to proceed with a next ‘pre-emptive’ 25 bps rate cut in June (95% discounted). Short-term Germany yields stay lower in a daily perspective (2-y -4.5 bps), but long term yields turned back north with the 30-y again adding 2.5 bps. Investors in LT bonds globally are still keeping a close eye at the developments in the US. In this respect, the US House (narrowly) approved President Trump’s tax Bill, which will now go to the Senate. Even as amendments are likely, the outcome will sharply further raise US deficits and the path of government debt. LT US yields again jumped higher after the approval. The 30-y touched 5.15%, but the pressure gradually eased somewhat. US yields currently are changing between -4.0 bps (2-y) and +2.0 bps (30-y). Fed Waller kept the door open Fed rate cuts in H2 if the tariffs on US trading partners would settle around 10%. A higher level could complicate the Fed assessment. At the time of finishing this report, the US PMI’s surprise sharply to the upside (composite 52.3 from 50.2), helping to put an intraday bottom yields.
Yesterday evening, US fiscal uncertainty and a poor US 20-y auction already triggered a correction in US equities. This spilled over to Asia an Europa. EMU PMI’s didn’t help European markets negative guidance from the US. The EuroStoxx 50 currently cedes about 1.0%. US futures reversed initial further losses after the approval of the tax bill. The S&P opens little changed. On FX markets, the dollar shows a mixed picture. The US currency eased further against the likes of the yen, but gradually found a bottom, supported by the US PMI’s (USD/JPY 143.8). Poor EMU PMI’s pushed EUR/USD back below 1.13, but the damage stays modest for now. Sterling slightly outperforms the euro (EUR/GBP 0.8420). UK PMI’s were not impressive, but better than EMU. (composite 49.4, from 48.5, services back at 50.2). Even so, the UK 30-y yield adding another 6 bps (5.55-60 area 6%) remains another warning sign.
News & Views
The Turkish central bank (CBRT) kept its EoY inflation forecasts unchanged for 2025 and 2026 in its second (out of four in total) inflation reports this year. The respective 24% and 12% projections are on the optimistic side given that actual CPI was 38% in April with the disinflationary process showing signs of stalling in recent months. CBRT governor Karahan cited easing commodity prices and domestic activity to keep forecasts stable. Annual average oil prices were lowered by 14% and 18% for 2025 and 2026 respectively compared to the Q1 inflation report while growth was revised down. But he did warn for upside risks. The arrest of president Erdogan’s political rival in March wreaked havoc on Turkish markets, including on the local currency. While Karahan expects the inflationary impact of to be temporary, they remain on the lookout for pass-through effects. Either way, by keeping the inflation forecasts well above the 5% target and coupled with Karahan’s pledge to do “whatever is needed” to tame price pressures, the central bank signals any future rate cuts would only be gradually. The CBRT started easing late last year but changed course after the March shocker. The de facto policy rate currently stands at 49%.
The oil price rally yesterday following CNN reports of Israel preparing an attack on Iranian nuclear facilities was very short-lived. It reversed course already during the day and extends losses today. The latter followed a Bloomberg report suggesting OPEC+ is readying another jumbo (+411k barrels) output hike in July. That would be the third such move in a row and another strong deviation from the much more gradual return of output OPEC had agreed on initially. Brent oil drops to $63.75.