Sample Category Title
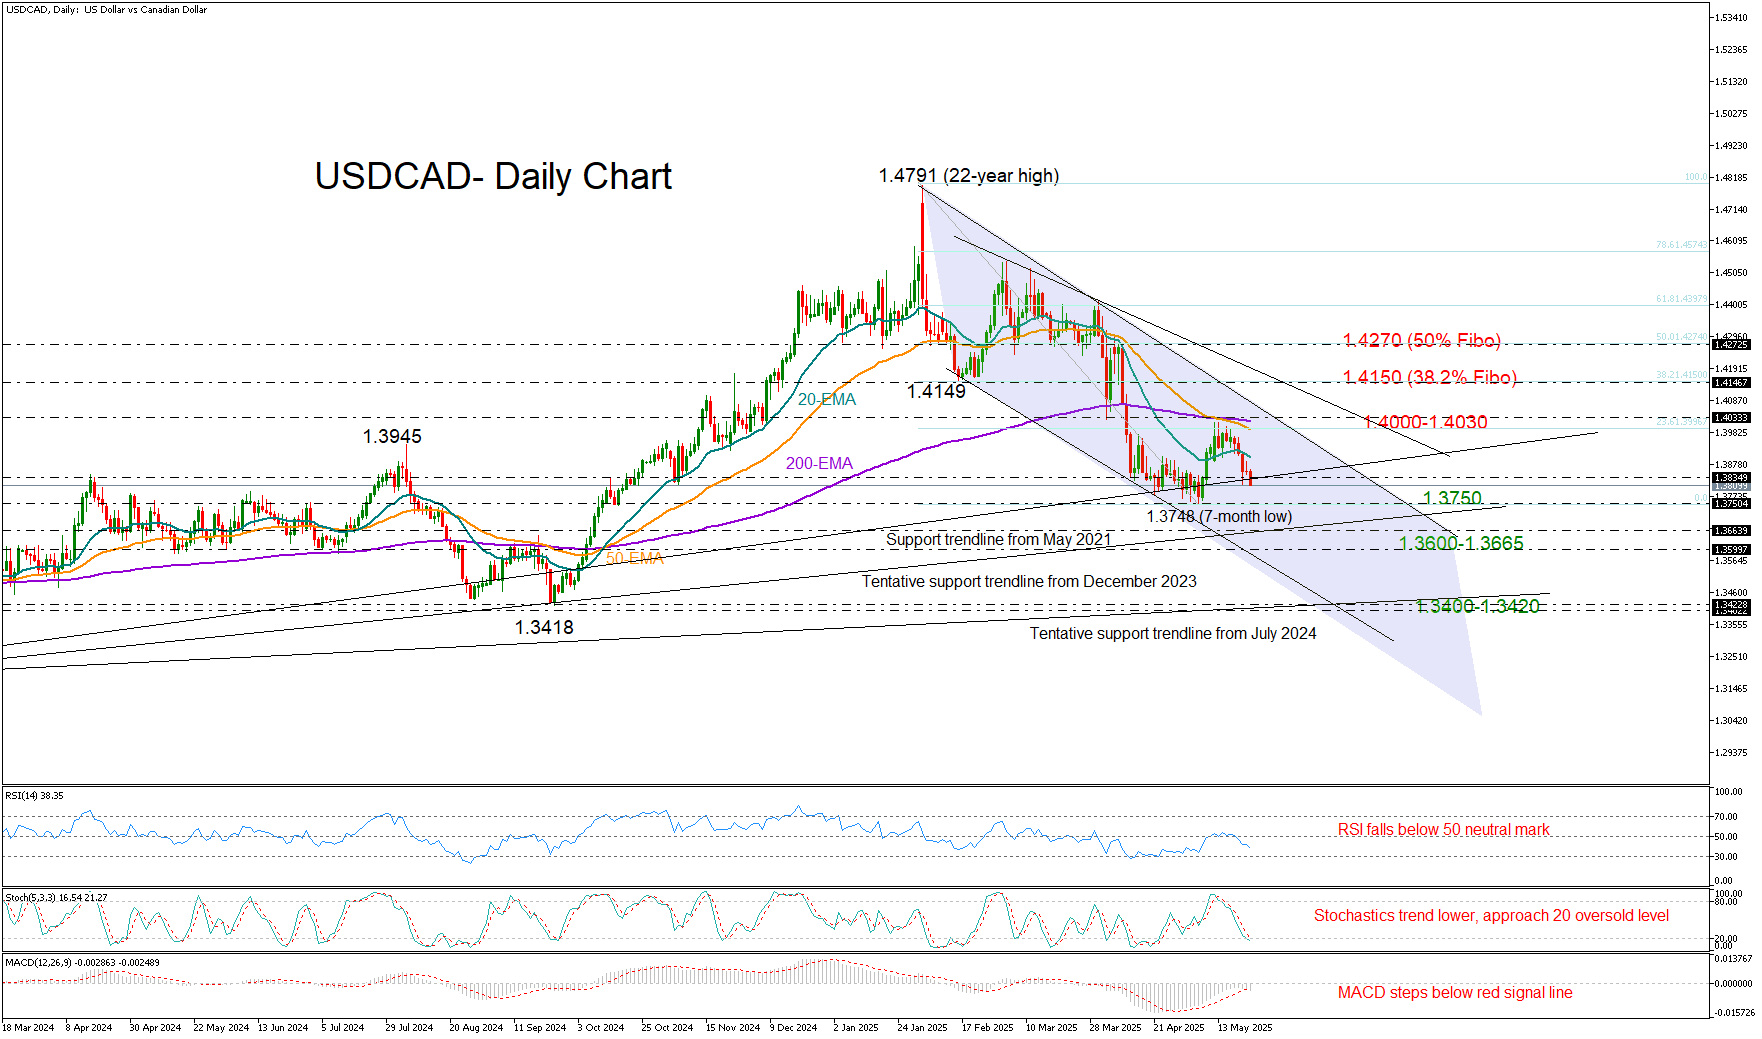
USD/CAD Bounce Proves Unsustainable
- USDCAD retreats after short-lived recovery attempt.
- Long-term support trendline in focus as bears target April’s low of 1.3748.
USDCAD has surrendered much of its May gains after repeated attempts to break above the 1.4000 mark faltered, pushing the pair back into negative territory this week.
Adding to the pressure, Trump’s narrowly passed tax-cut bill in the House on Thursday is expected to significantly increase the already ballooned federal debt. This development raises concerns about a potential default and threatens the dollar’s safe-haven feature.
From a technical perspective, the pair is now seeking support near the familiar trendline at 1.3827, drawn from the 2021 low, after failing to convincingly surpass the 23.6% Fibonacci retracement level of the February–May downtrend. If this support level also gives way, attention will shift to the April low of 1.3748, and then towards a more critical support zone between the tentative trendline at 1.3663 and the lower boundary of the descending channel at 1.3600. A break below this region could worsen the medium-term outlook, potentially driving the pair down to the September 2024 double-bottom area around 1.3420.
Technical indicators suggest continued downside potential. The RSI remains above the oversold threshold of 30, and the stochastic oscillator has yet to bottom out below 20, indicating that selling interest may persist.
For the outlook to improve, bulls would need to push decisively above 1.4000 and overcome both the 50- and 200-day exponential moving averages (EMAs), which have recently formed a death cross. The upper boundary of the descending channel lies nearby as well. A bullish breakout from this zone could open the door to test the 38.2% Fibonacci retracement level at 1.4150, followed by the 50% level at 1.4270.
In summary, USDCAD remains under bearish pressure and may continue to struggle unless the 1.3835 region can effectively stem halt the current selling momentum.
USD/CAD Rate Drops Towards Yearly Lows
The USD/CAD chart is currently showing clear signs of a bearish trend, characterised by a sequence of lower highs and lower lows (A→B→C→D→E→F→G).
This week’s decline suggests the downward structure may continue to develop, putting the current yearly low around the 1.3770 level at risk.
Why Is USD/CAD Falling?
On one hand, the US dollar remains under pressure:
→ Following last week’s downgrade of US debt ratings by Moody’s, investor attention has shifted to the country’s $36 trillion debt burden.
→ A tax bill backed by Donald Trump — recently passed in the Republican-controlled House of Representatives — could add trillions more to the national debt. Market participants may be increasingly concerned about the US’s fiscal outlook, prompting a shift towards safe-haven assets.
On the other hand, the Canadian dollar has strengthened this week relative to other major currencies. Tuesday’s CPI figures from Canada came in above analysts’ expectations and may be seen as a sign that the inflation surge could delay any potential rate cuts by the Bank of Canada.
USD/CAD Technical Analysis
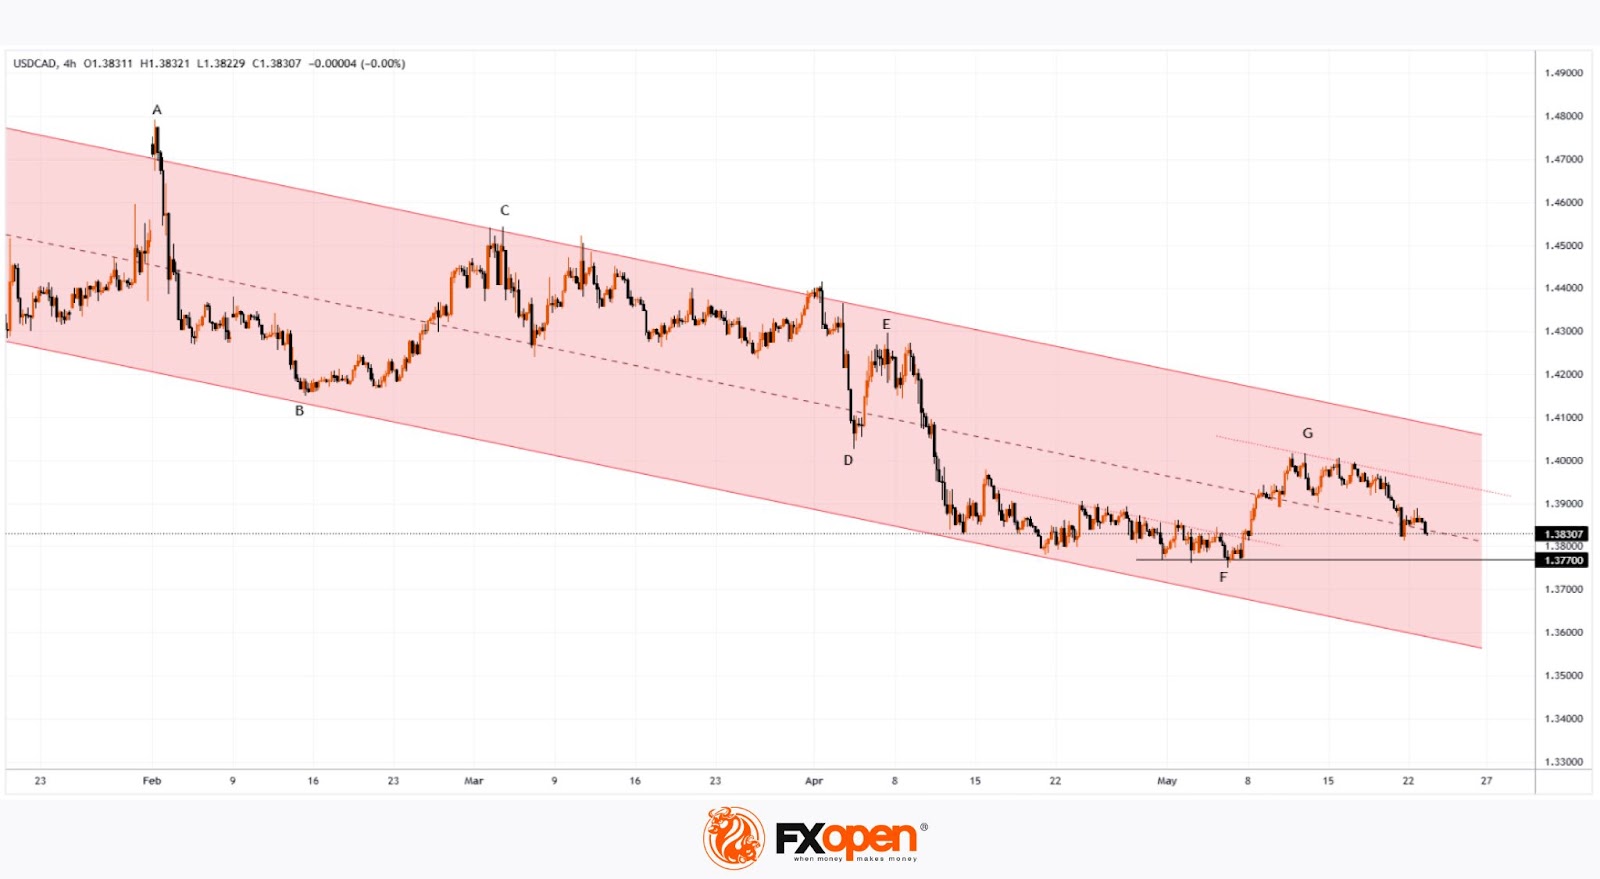
In early May, we outlined a descending channel on the USD/CAD chart — a structure that remains relevant today.
The current price is hovering near the channel’s median line, which could indicate a temporary balance between supply and demand. However, with Canadian retail sales data due at 15:30 GMT+3 today, the risk of increased volatility remains high. A new weekly low cannot be ruled out.
Trade over 50 forex markets 24 hours a day with FXOpen. Take advantage of low commissions, deep liquidity, and spreads from 0.0 pips. Open your FXOpen account now or learn more about trading forex with FXOpen.
This article represents the opinion of the Companies operating under the FXOpen brand only. It is not to be construed as an offer, solicitation, or recommendation with respect to products and services provided by the Companies operating under the FXOpen brand, nor is it to be considered financial advice.
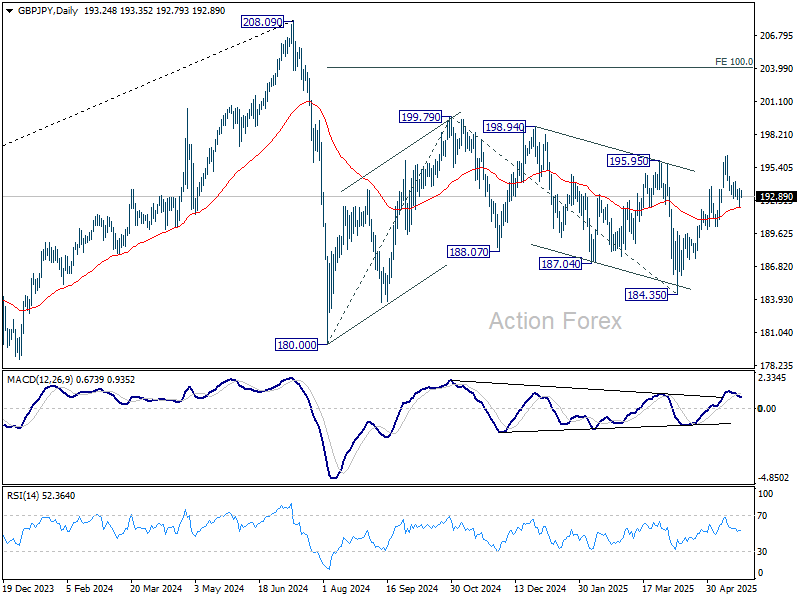
GBP/JPY Daily Outlook
Daily Pivots: (S1) 192.23; (P) 192.91; (R1) 193.93; More...
Intraday bias in GBP/JPY remains neutral at this point. While deeper pullback might be seen, further rally is expected as long as 190.22 structural support holds. On the upside, above 194.18 minor resistance will turn bias back to the upside for 196.38 resistance. However, sustained break of 190.22 will indicate near term reversal.
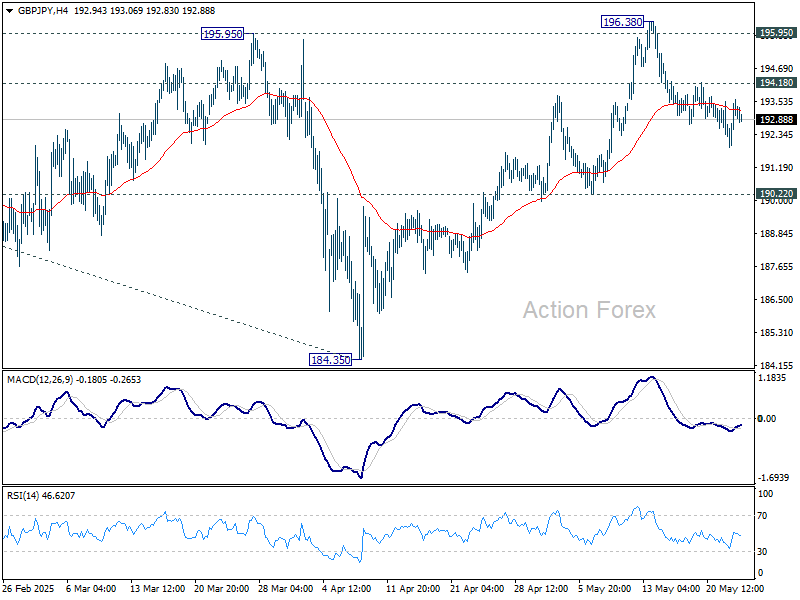
In the bigger picture, price actions from 208.09 are seen as a correction to rally from 123.94 (2020 low). Strong support should be seen from 38.2% retracement of 123.94 to 208.09 at 175.94 to contain downside. However, sustained break of 175.94 will bring deeper fall even still as a correction.
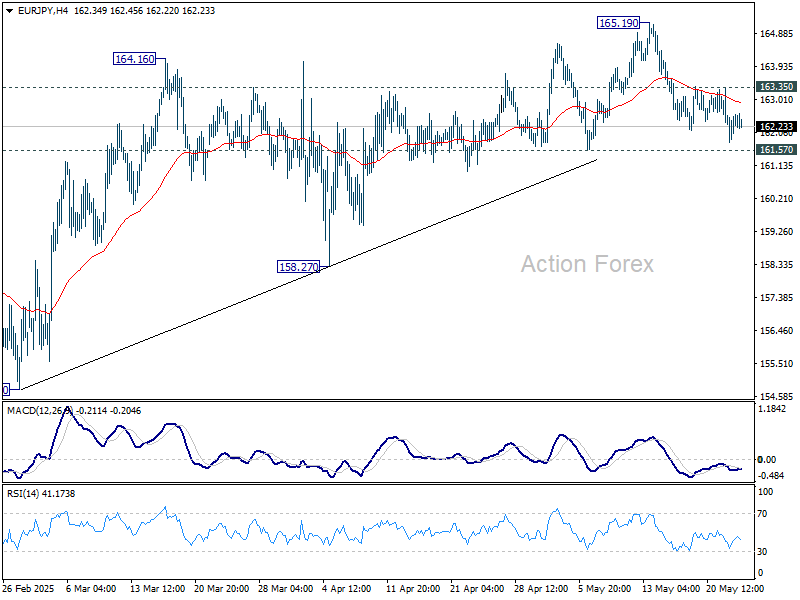
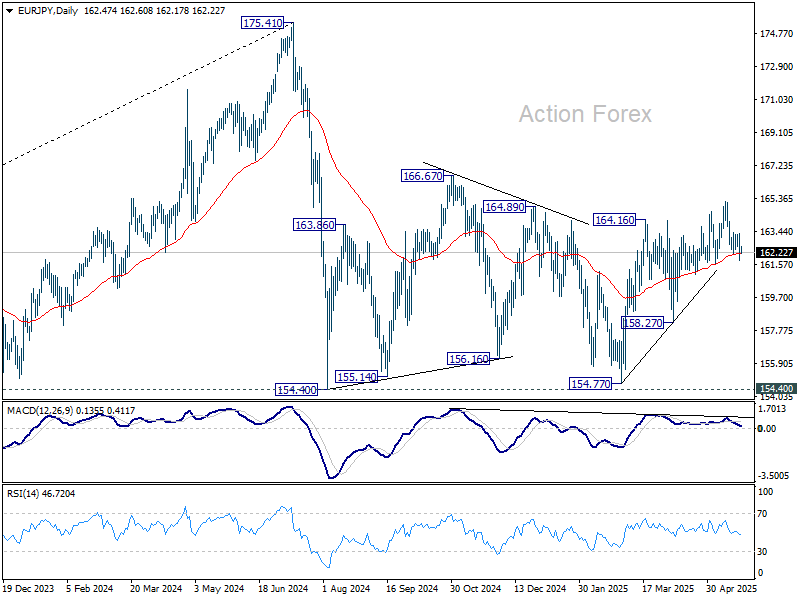
EUR/JPY Daily Outlook
Daily Pivots: (S1) 161.67; (P) 162.55; (R1) 163.29; More...
Intraday bias in EUR/JPY remains neutral at this point. Further rally is in favor as long as 161.57 support holds. On the upside, break of 163.35 minor resistance will bring retest of 165.19 first. Break of 165.19 will resume the rise from 154.77 to 166.67 resistance. However, firm break of 161.57 will indicate near term reversal, and turn bias back to the downside.
In the bigger picture, price actions from 175.41 are seen as correction to rally from 114.42 (2020 low). Strong support should be seen from 38.2% retracement of 114.42 to 175.41 at 152.11 to contain downside. However, sustained break of 152.11 will bring deeper fall even still as a correction.
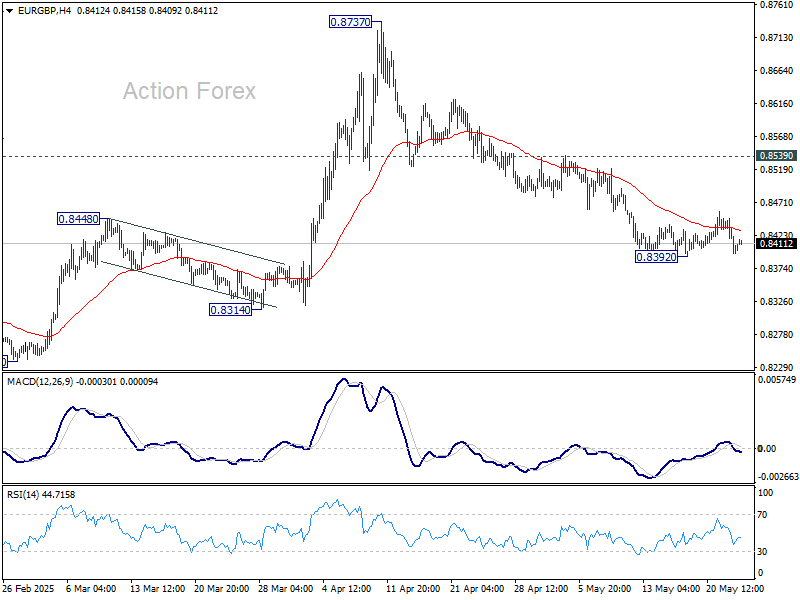
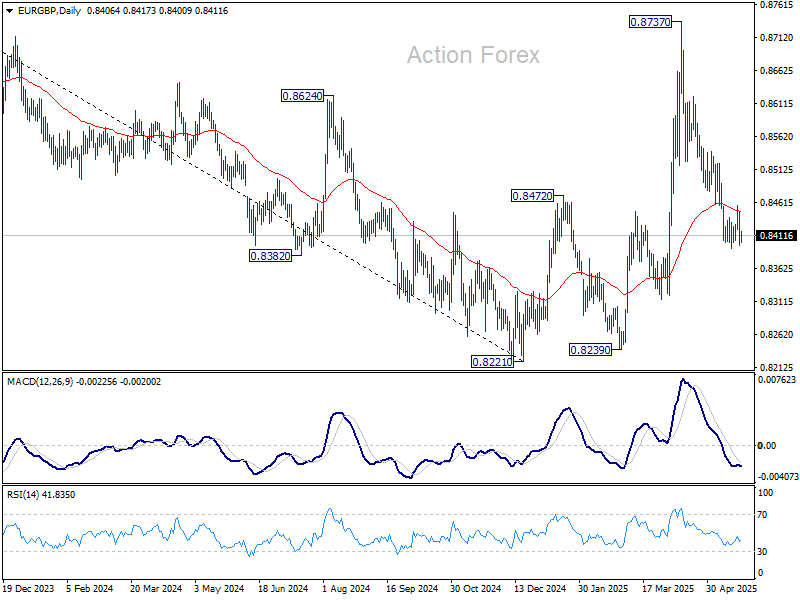
EUR/GBP Daily Outlook
Daily Pivots: (S1) 0.8387; (P) 0.8418; (R1) 0.8438; More...
Intraday bias in EUR/GBP remains neutral at this point. Overall outlook stay bearish as long as 0.8539 resistance holds. On the downside, break of 0.8392 temporary low will resume the decline from 0.8737 to 0.8221/8239 support zone.
In the bigger picture, current development suggests that price actions from 0.8221 medium term bottom are merely forming a corrective pattern. However, there is no clear momentum to break through 0.8201 key support (2022 low) yet. Hence, range trading is expected between 0.8221/8737 for now.
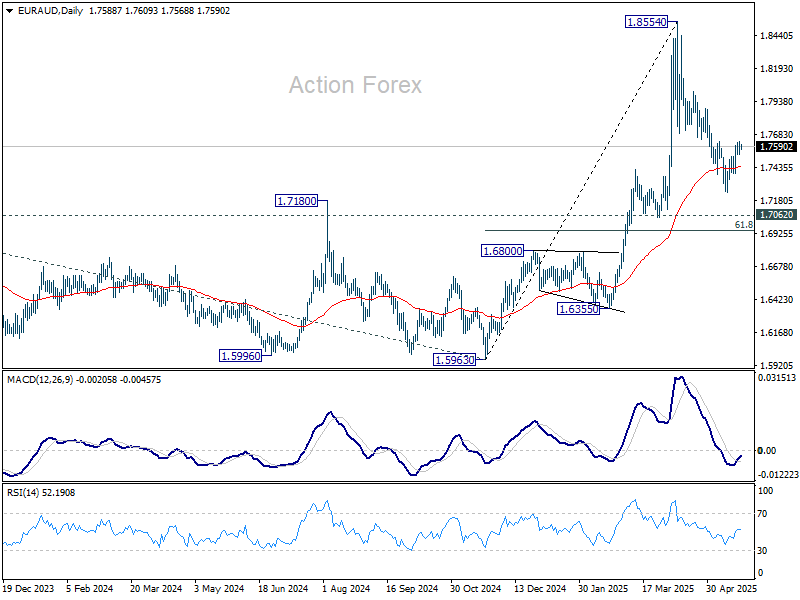
EUR/AUD Daily Outlook
Daily Pivots: (S1) 1.7545; (P) 1.7590; (R1) 1.7643; More...
Intraday bias in EUR/AUD stays neutral at this point. On the upside, firm break of 1.7628 resistance will suggest that fall from 1.8554 as completed as a correction, and retain larger bullishness. Intraday bias will be back on the upside for stronger rebound. However, below 1.7245 will resume the fall to 61.8% retracement of 1.5963 to 1.8554 at 1.6953.
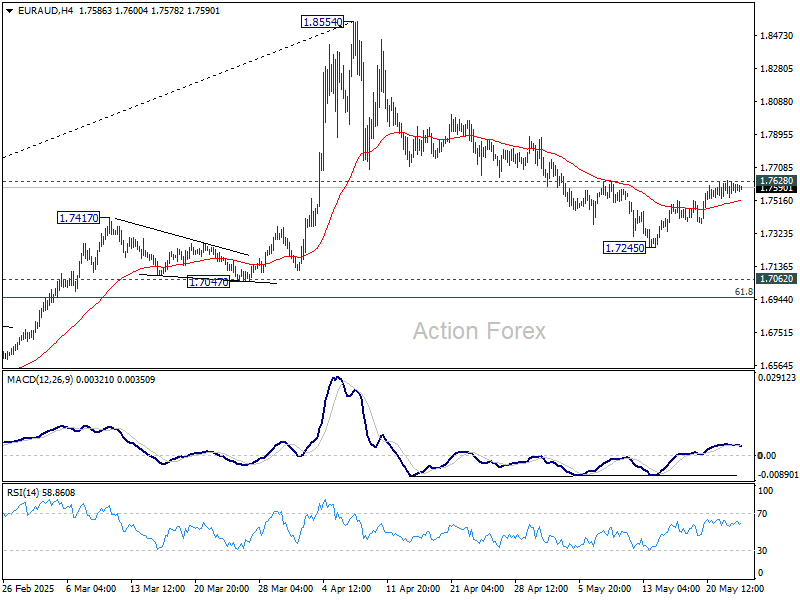
In the bigger picture, as long as 1.7062 resistance turned support (2023 high) holds, up trend from 1.4281 (2022 low) should still be in progress. Break of 1.8554 will target 100% projection of 1.4281 to 1.7062 from 1.5963 at 1.8744. However, sustained break of 1.7062 will confirm medium term topping and bring deeper fall back to 1.5963 support.
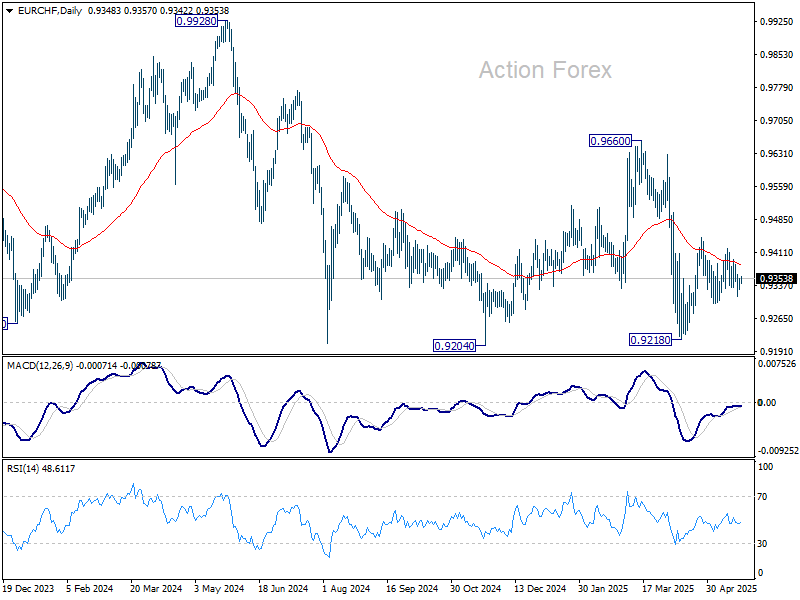
EUR/CHF Daily Outlook
Daily Pivots: (S1) 0.9331; (P) 0.9349; (R1) 0.9368; More....
Intraday bias in EUR/CHF remains neutral as sideway trading continues. Price actions from 0.9218 are seen as either a corrective move or the third leg of the pattern from 0.9204. On the upside, break of 0.9419 will resume the rise from 0.9218 through 0.9445 resistance. However, break of 0.9296 support will bring retest of 0.9218 low.
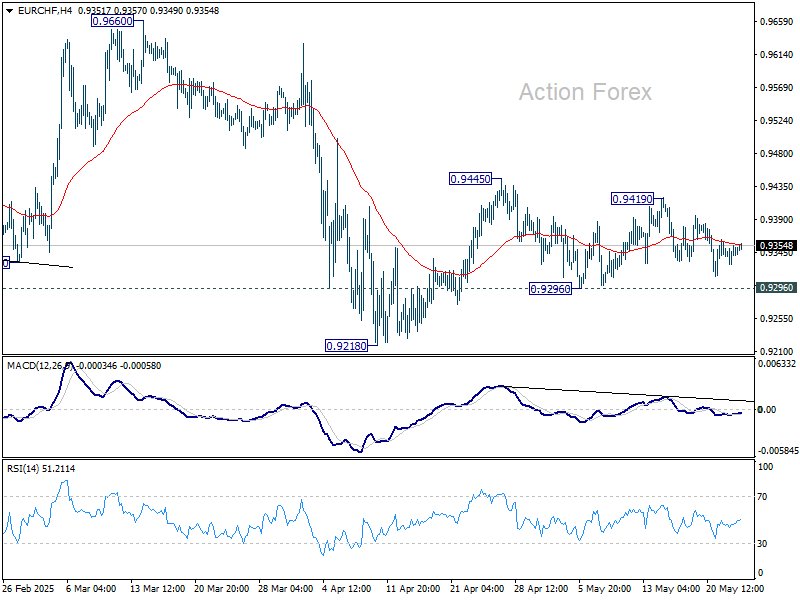
In the bigger picture, prior rejection by long-term falling channel resistance (now at 0.9548) retains medium term bearishness. That is, down trend from 1.2004 (2018 high) is still in progress. Firm break of 0.9204 (2024 low) will confirm resumption. This will remain the favored case as long as 0.9660 resistance holds.
US Fiscal Theme Not at All Gone But Could Move a Bit to the Background
Markets
Yesterday’s House approval of Trump’s multi-trillion bill wraps up days of suspense going into the vote. The fiscal theme returned front-and-center since the 90-day US-Sino trade truce almost two weeks ago. Dire deficit and debt forecasts by the Committee for a Responsible Federal Budget and weak auctions in the UK, Japan and eventually in the US ($16bn 20-yr sale) all added to the negative sentiment and pressured the long end of the curve. The House vote delivered a final push, lifting the 30-yr to just 2 bps shy of the 5.17% 2023 high. But without a test, let alone break, some technical return action kicked in. Net daily changes eventually varied between -2.8 (2-yr) and -7.2 (20-yr) bps. Stronger-than-expected US PMI’s help explain the front-end’s underperformance. Both the services and manufacturing gauge rebounded to 52.3, driven by accelerating growth in new orders. Following the tariff pause, optimism for the year ahead recovered from April’s slump to its highest since January. Input costs rose sharply and was “overwhelmingly linked to tariffs”. That resulted in the sharpest rise in prices charged since August 2022. The contrasting mixed-to-weak European PMIs triggered some bull steepening and pushed EUR/USD lower, be it only marginally, to 1.128. EUR/GBP for similar reasons (UK PMIs were slightly less disappointing than the EMU ones) dipped back towards the 0.84 support area.
Those business confidence indicators were the only highlight on this week’s economic calendar. The ECB’s wage negotiations tracker scheduled for release today is worth mentioning but it’s unlikely to alter markets’ 100% conviction on a 25 bps June rate cut. With Trump’s bill now headed to the Senate, the fiscal theme is not at all gone but could move a bit to the background in a daily perspective and maybe even give way for the trade topic again (cf. below). Add to that long weekend ahead in the US (Memorial Day on Monday) and we’re set for a technical trading session. A weekly close of the 30-yr north of 5% would be an important signal, suggesting lingering fiscal worries. EUR/USD already recoups yesterday’s losses to trade around 1.132 but we don’t expect the move to run much further. UK retail sales for April were much stronger-than-expected, even considering the downward revisions for March. Sterling shrugs though. EUR/GBP holds steady north of 0.841. UK markets are also closed on Monday.
News & Views
National inflation in Japan rose slightly more than expected in April. Headline inflation held stable at 3.6% Y/Y. CPI inflation ex-fresh food, a measure closely watched by the BOJ, accelerated by from 3.2% to 3.5%. The index is touching the highest level since January 2023. Inflation ex fresh food and energy also rose from 2.9% to 3.0%. Food prices, while easing from 7.4% Y/Y in March to 6.4% remain in important source of upward price pressures. Rice prices even rose 98.4% Y/Y. Prices of utilities also accelerated (3.0% M/M and 8.4% Y/Y) due to the government phasing out support measures for gas and electricity. Service price inflation remained modest (1.3%), but this due to changes in education fees. Other topics suggest that private companies might further raise prices. Today’s CPI release is keeping the door open for the BOJ to continue is normalization process even as it currently has a wait-and-see bias to assess the impact of US tariffs on price and activity. Next BOJ policy meetings are scheduled on June 17 and July 31. Markets currently see only a very low probability of a next step at these meetings yet.
The Financial Times this morning reports that in the trade negotiations between the US and the EU, the US is urging the EU to make unilateral tariff concessions referring to people familiar with the discussions. These concessions are said to be necessary to make progress in talks to avoid additional 20% reciprocal tariffs. The US is said to be unhappy that the EU only offered mutual tariff reductions rather committing to lower duties alone. The EU apparently also didn’t give any indication that the digital tax may be discussed, a demand from the US. The US also wants the EU to reduce regulation and accepting US standards on food and other products, amongst other non-tariff requests. The report suggests that talks for now have made little progress in the run-up to the July 8 deadline when the reduced reciprocal tariffs expire.
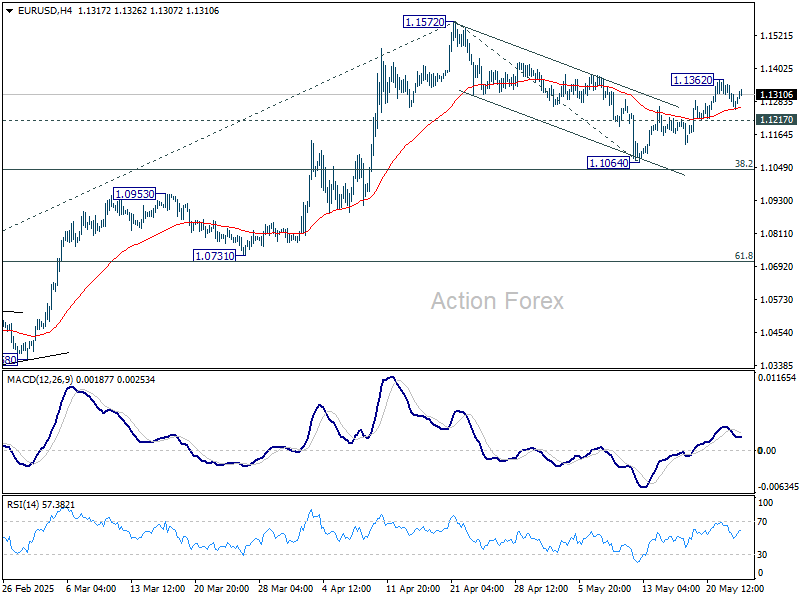
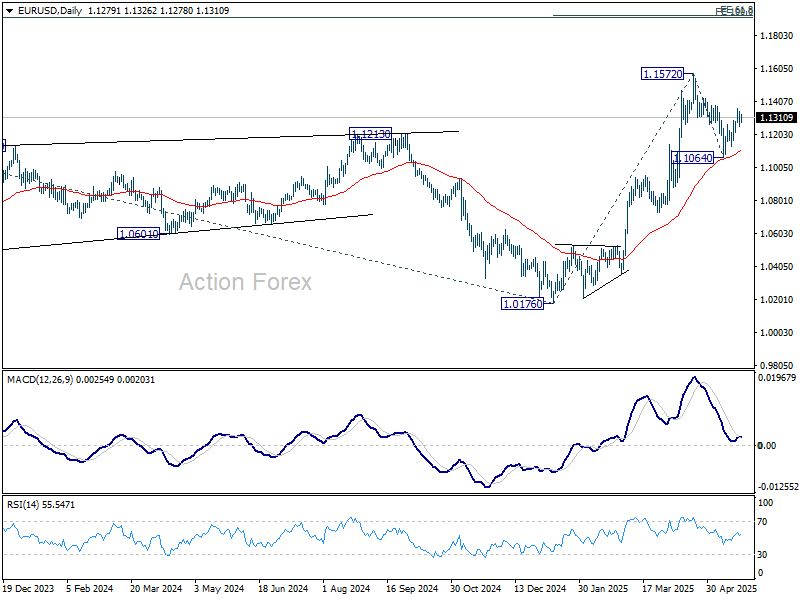
EUR/USD Daily Outlook
Daily Pivots: (S1) 1.1242; (P) 1.1294; (R1) 1.1331; More...
Intraday bias in EUR/USD remains neutral and more consolidations could be seen below 1.1362 temporary top. Further rise is expected as long as 1.1216 support holds. Correction from 1.1572 could have completed at 1.1064 already. Above 1.1362 will bring retest of 1.1572 first. Firm break there will resume larger up trend. Next near term target will be 61.8% projection of 1.0176 to 1.1572 from 1.1064 at 1.1927. However, break of 1.1217 will turn bias back to the downside for 1.1064 support instead.
In the bigger picture, rise from 0.9534 long term bottom could be correcting the multi-decade downtrend or the start of a long term up trend. In either case, further rise should be seen to 100% projection of 0.9534 to 1.1274 from 1.0176 at 1.1916. This will now remain the favored case as long as 55 W EMA (now at 1.0818) holds.
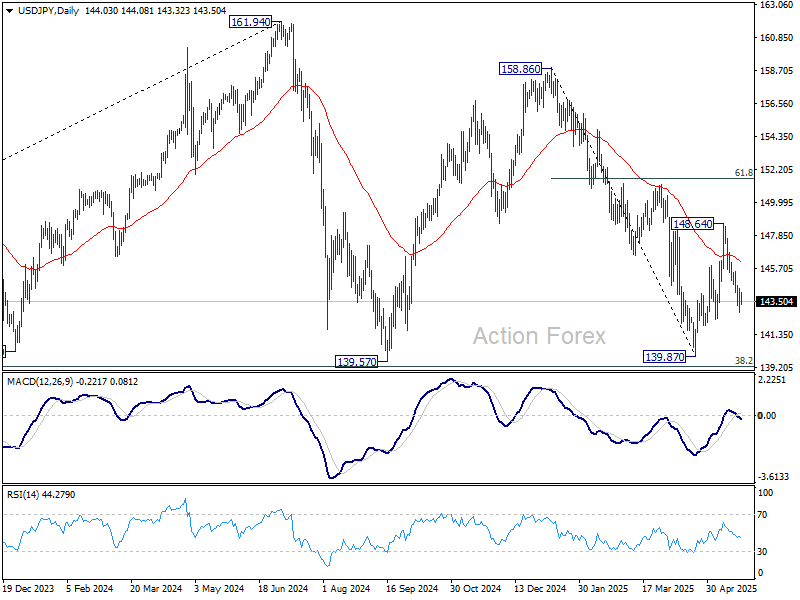
USD/JPY Daily Outlook
Daily Pivots: (S1) 143.08; (P) 143.75; (R1) 144.68; More...
Intraday bias in USD/JPY is turned neutral with current recovery, and some consolidations would be seen above 142.79 temporary low. Risk will stay on the downside as long as 146.08 minor resistance holds. Rebound from 139.87 could have completed as a correction to 148.64 already. Below 142.79 will target a retest on 139.87 low.
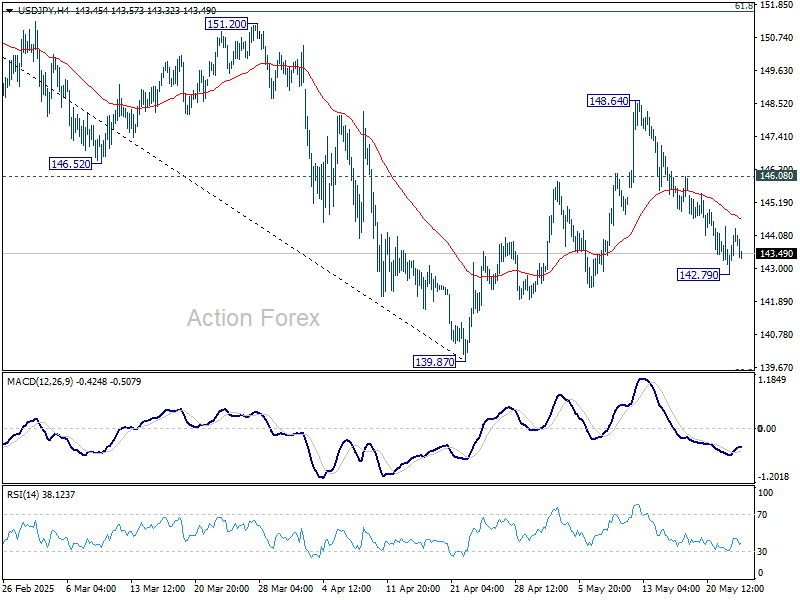
In the bigger picture, price actions from 161.94 are seen as a corrective pattern to rise from 102.58 (2021 low), with fall from 158.86 as the third leg. Strong support should be seen from 38.2% retracement of 102.58 to 161.94 at 139.26 to bring rebound. However, sustained break of 139.26 would open up deeper medium term decline to 61.8% retracement at 125.25.