Sample Category Title
GBP/USD Mid-Day Outlook
Daily Pivots: (S1) 1.3354; (P) 1.3375; (R1) 1.3414; More...
Intraday bias in GBP/USD stays on the upside for the moment, with focus on 1.3433/42 key resistance zone. Decisive break there will confirm larger up trend resumption. Next near term target will be 61.8% projection of 1.2706 to 1.3442 from 1.3138 at 1.3593, and then 100% projection at 1.1.3874. On the downside, below 1.3333 minor support will delay the bullish case and turn intraday bias neutral first.
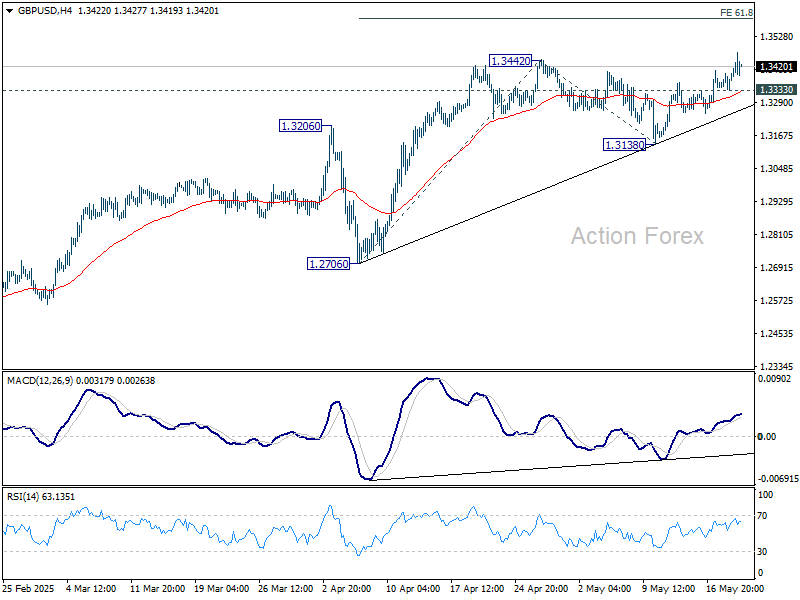
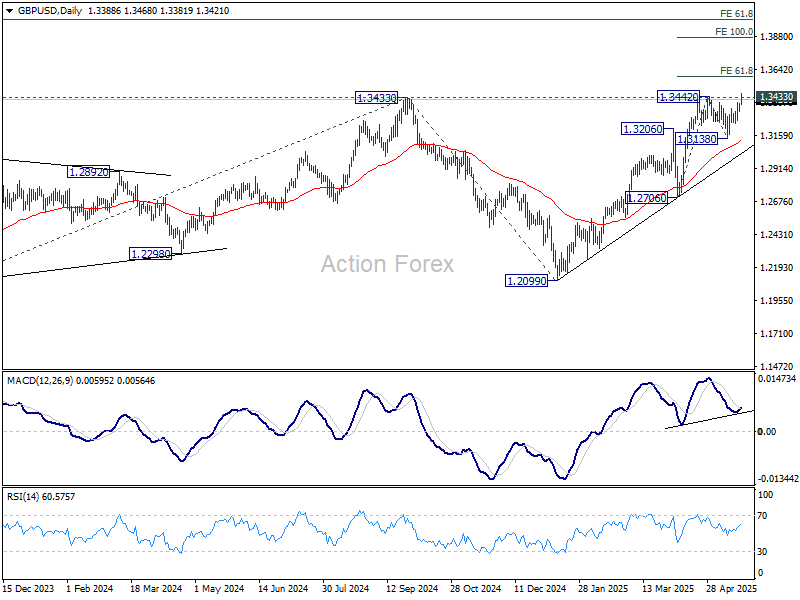
In the bigger picture, up trend from 1.3051 (2022 low) is still in progress. Decisive break of 1.3433 (2024 high) will confirm resumption. Next medium term target is 61.8% projection of 1.0351 to 1.3433 from 1.2099 at 1.4004. Nevertheless, sustained trading below 55 D EMA (now at 1.3124) will delay the bullish case and bring more consolidations first.
US Assets Remain Under Pressure; Sterling Gains Muted Despite Hot CPI
Dollar’s selloff moderated slightly during European session, but pressure on US assets remains firmly in place. DOW futures are down more than -300 points, while the 10-year Treasury yield has surged back above the 4.5% mark. Market sentiment continues to reflect unease over the US fiscal outlook and uncertainty surrounding the Trump administration’s trade stance. With the G7 finance ministers’ meeting underway, any hint that Washington may be aiming for a weaker currency will be closely scrutinized.
In the UK, despite a hotter-than-expected CPI report, Sterling failed to extend gains beyond Dollar and weakened against most other majors. A particularly striking detail in the report was the 5.4% surge in services inflation, which surpassed BoE’s own forecast of 5.0%. On a monthly basis, services prices jumped 2.2% the largest monthly rise in 34 years.
This supports recent remarks from BoE Chief Economist Huw Pill, who argued that the pace of policy easing may be too fast given the structural persistence in wage and price-setting behavior. The CPI report has clearly dampened market expectations for a summer rate cut, with odds of an August move now down to 40%, compared to 60% before the data release.
In the broader currency markets, Dollar remains the weakest performer so far today, trailed by Sterling and the Loonie. At the other end, Yen leads the pack amid safe-haven demand, followed by Swiss Franc and Euro. Aussie and Kiwi are trading in the middle.
In Europe, at the time of writing, FTSE is up 0.06%. DAX is down -0.28%. CAC is down -0.58%. UK 10-year yield is up 0.066 at 4.771. Germany 10-year yield is up 0.046 at 2.654. Earlier in Asia, Nikkei fell -0.61%. Hong Kong HSI rose 0.62%. China Shanghai SSE rose 0.21%. Singapore Strait Times closed flat. Japan 10-year JGB yield fell -0.002 to 1.521.
UK CPI surges to 3.5% in April, core jumps to 3.8%
UK inflation came in hotter than expected in April, with headline CPI rising 1.2% mom versus expectation f 1.1% mom. Annual CPI accelerated from 2.6% yoy to 3.5% yoy, above the 3% mark for the first time since March 2024.
Core CPI, which strips out energy, food, alcohol and tobacco, climbed sharply from 3.4% yoy to 3.8% yoy, its highest level since April 2024.
Breakdowns show a sharp jump in both goods and services inflation. Goods inflation accelerated from 0.6% yoy to 1.7% yoy, while services inflation climbed from 4.7% yoy to 5.4% yoy , highlighting the strength of domestic price pressures.
Japan’s US-bound exports fall -1.8% yoy as tariffs and strong Yen Bite
.Japan’s export growth slowed to just 2.0% yoy in April, marking the weakest pace since October 2024.
Notably, shipments to the US fell -1.8% yoy — the first decline in four months — as demand for automobiles, steel, and ships weakened. Exports of automobiles alone dropped -4.8% yoy by value, impacted by a stronger Yen and reduced demand for high-end models.
The decline coincides with the imposition of 25% US tariffs on Japanese auto, steel, and aluminum exports, alongside the 10% blanket levy applied to most trade partners under the current US trade regime.
Trade with Asia remained more resilient, with exports rising 6.0% yoy. However, shipments to China dipped -0.6% yoy.
On the import side, Japan saw a -2.2% yoy contraction, resulting in a trade deficit of JPY -115.8B.
Seasonally adjusted figures show a -2.7% mom drop in exports and a -1.4% mom drop in imports, with the adjusted trade deficit widening to JPY -409B.
Australia’s leading index falls to 0.2%, growth pulse fades
Australia’s Westpac Leading Index slowed from 0.5% to 0.2% in April, signaling a loss in growth momentum.
According to Westpac, the above-trend growth seen earlier this year has "all but disappeared," primarily due to rising global trade uncertainty and weaker commodity prices.
While these external pressures dominate, domestic factors such as a slowing labor market and only modest support from interest rate cuts are also contributing to the loss of momentum.
The overall picture suggests a stalling in the already tepid recovery, with GDP growth expected to reach just 1.9% by the end of 2025, well below historical averages.
Following RBA's recent 25bps rate cut to 3.85%, Westpac expects a cautious pause at the next policy meeting on July 7–8. The central bank is likely to await further clarity from the Q2 inflation data due at the end of July before considering additional easing.
GBP/USD Mid-Day Outlook
Daily Pivots: (S1) 1.3354; (P) 1.3375; (R1) 1.3414; More...
Intraday bias in GBP/USD stays on the upside for the moment, with focus on 1.3433/42 key resistance zone. Decisive break there will confirm larger up trend resumption. Next near term target will be 61.8% projection of 1.2706 to 1.3442 from 1.3138 at 1.3593, and then 100% projection at 1.1.3874. On the downside, below 1.3333 minor support will delay the bullish case and turn intraday bias neutral first.
In the bigger picture, up trend from 1.3051 (2022 low) is still in progress. Decisive break of 1.3433 (2024 high) will confirm resumption. Next medium term target is 61.8% projection of 1.0351 to 1.3433 from 1.2099 at 1.4004. Nevertheless, sustained trading below 55 D EMA (now at 1.3124) will delay the bullish case and bring more consolidations first.
Gold: Bulls Regained Traction and Establish Above $3,300
Gold keeps firm tone and attempts to establish above $3300 level, after the price hit the highest in over one week on Wednesday morning, in extension of Thursday’s 1.8% rally.
Fresh safe haven demand was fueled by further weakening of US dollar, which was also hurt by the US credit rating downgrade, while traders also opted to move into safety on fresh uncertainty over US Congressional debate on Trump’s tax cut bill, which could further undermine the US currency.
Adding to supportive factors for the yellow metal, was the latest media report about growing tensions between Israel and Iran.
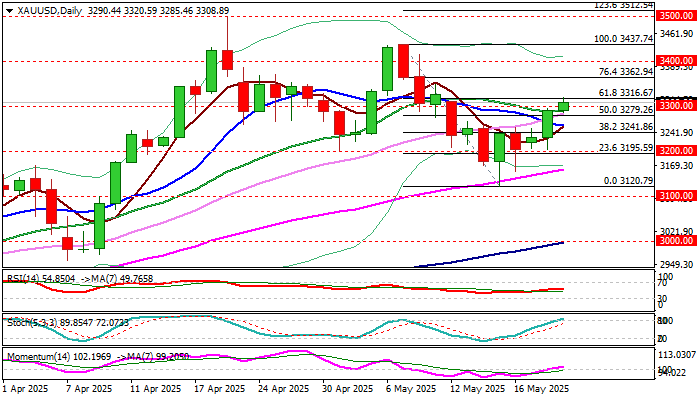
Technical picture has improved on daily chart after fresh acceleration higher retraced 61.8% of $3437/$3120 bear-leg and also left strong support at $3200 zone, where several attacks failed to register a sustained break lower and also left a bear-trap (under $3164 Fibo support).
Daily MA’s are back to full bullish setup, 14-d momentum broke into positive territory and heading north that underpins near term action, though bulls may take a breather, as conditions on daily and 4-hr charts are overbought.
Consolidation with limited dips is seen as likely scenario in current situation, with $3280 zone (broken Fibo 50% / near session low) to ideally contain and keep fresh bulls intact.
Reaction at $3300/16 zone will be closely watched, with sustained break through these levels to confirm bullish structure and expose targets at $3362/$3400 (Fibo 76.4% / psychological).
Caution on loss of $3280 handle that would risk attack at lower trigger at $3256 (10DMA).
Res: 3320; 3347; 3362; 3400.
Sup: 3300; 3280; 3256; 3241.
Gold, Oil Spike on Renewed Israel-Iran Tension
The European Open
European stocks pulled back from two-month highs on Wednesday, with JD Sports and Julius Baer shares leading the decline. Meanwhile, investors stayed cautious, watching U.S. trade talks and the tax bill debate.
The pan-European STOXX 600 index dropped 0.4%, with retail and auto stocks leading the decline
Swiss bank Julius Baer saw its shares fall 4.6% after revealing a $156.4 million charge from a credit review and announcing a new chief risk officer.
JD Sports shares dropped 6.5%, making it the worst performer in the index, after the British retailer reported a 2% drop in first-quarter sales and warned that higher prices in the U.S. could reduce customer demand.
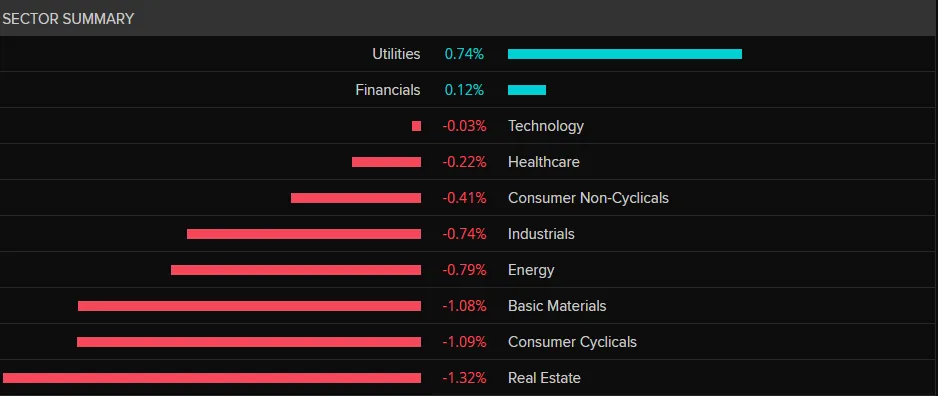
The Dax index is struggling to gain acceptance above the 24000 handle at present, with yesterday's daily candle close leaving bulls with something to consider. All sectors are currently in the red for the day excluding Utilities and Financials which have eked out marginal gains.
Source: LSEG
Will the G7 Meeting Aid the Ailing Dollar?
The US Dollar has continued its struggles this morning with the G7 meeting now underway in Canada. Safe haven currencies received a bid overnight as rumors of a potential Israeli strike on Iranian nuclear facilities ramped up geopolitical risk.
The G7 meeting kicked off yesterday and could be the saving grace the US Dollar needs at the moment. The lack of high impact US data this week has meant that the US Dollar slide has been unchallenged, but comments from the G7 meeting around trade could arrest the greenbacks slide.
Keep an eye out for any communication post the meeting or over the next day or so. Any tweaks to the language used to describe FX policy could have repercussions for the US Dollar and FX as a whole.
However, given the current climate and risks present in markets, there is also the possibility that the G7 may not want to stir up volatility and may keep their communication limited and language on FX policy unchanged.
Currency Power Balance
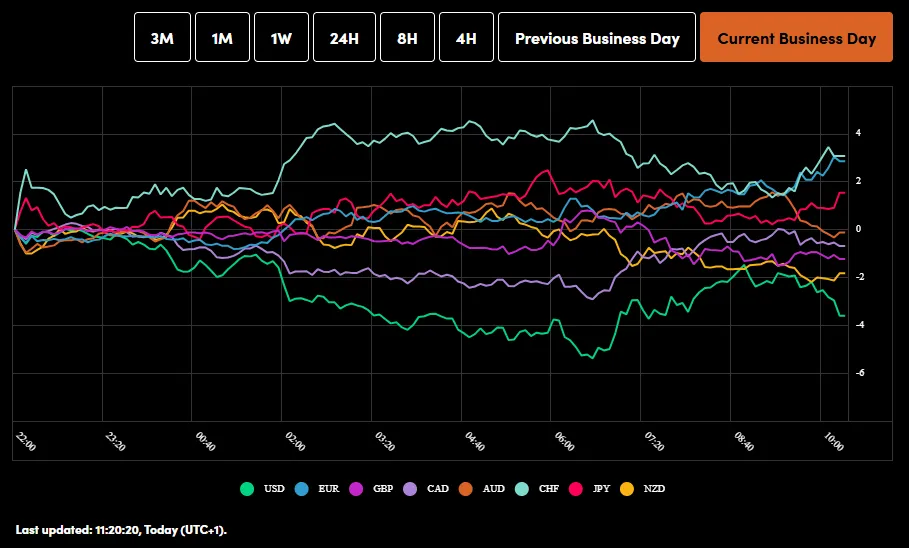
Source: OANDA Labs
Israel-Iran Tensions Triggers Haven Bids
Safe haven demand received a bid overnight on news that Israel might be planning to attack Iran's nuclear sites, based on U.S. intelligence.
This is happening while Iran and the U.S. are reportedly in talks to reduce tensions. A CNN report suggests that an attack on Iran's nuclear sites could be more likely if the U.S. makes a deal with Iran that doesn't fully eliminate its uranium stockpile.
However, Yesterday Irans Supreme Leader Khameini stated that he has doubts about the nuclear discussions with the US. “I don’t think nuclear talks with the U.S. will bring results. I don’t know,” Khamenei said during a speech in remembrance of Iran’s late President Ebrahim Raisi.
The impact has seen Oil prices rise temporarily and Gold continue its ascent and reclaim the $3300/oz handle. Oil prices have surrendered the initial gains but Gold continues to hold the high ground at around $3315/oz at the time of writing.
Any further developments here should be monitored as it could have a significant impact on both Gold and Oil prices.
Economic Data Releases
Looking at the economic calendar, it's another quiet day in terms of data releases from the US.
For now, keep an eye on the G7 meeting and any potential announcements around a potential escalation between Iran-Israel. Trade deal announcements also remain key should any materialize during the US session.
Chart of the day - WTI Oil
From a technical standpoint, WTI has looked poised for a continuation of the bullish move started on May 5.
However, after the initial rally WTI has been consolidating for the past 5 trading days with today's spike higher facing significant selling pressure.
For the bullish momentum to continue a daily candle close above the 63.70 swing high is needed.
Geopolitical risk with regard to Iran-Israel could also be the catalyst needed for a bullish rally.
Until then and if the status quo remains unchanged there is a possibility that the sideways price action we are witnessing may continue.
WTI Oil Daily Chart, May 21, 2025
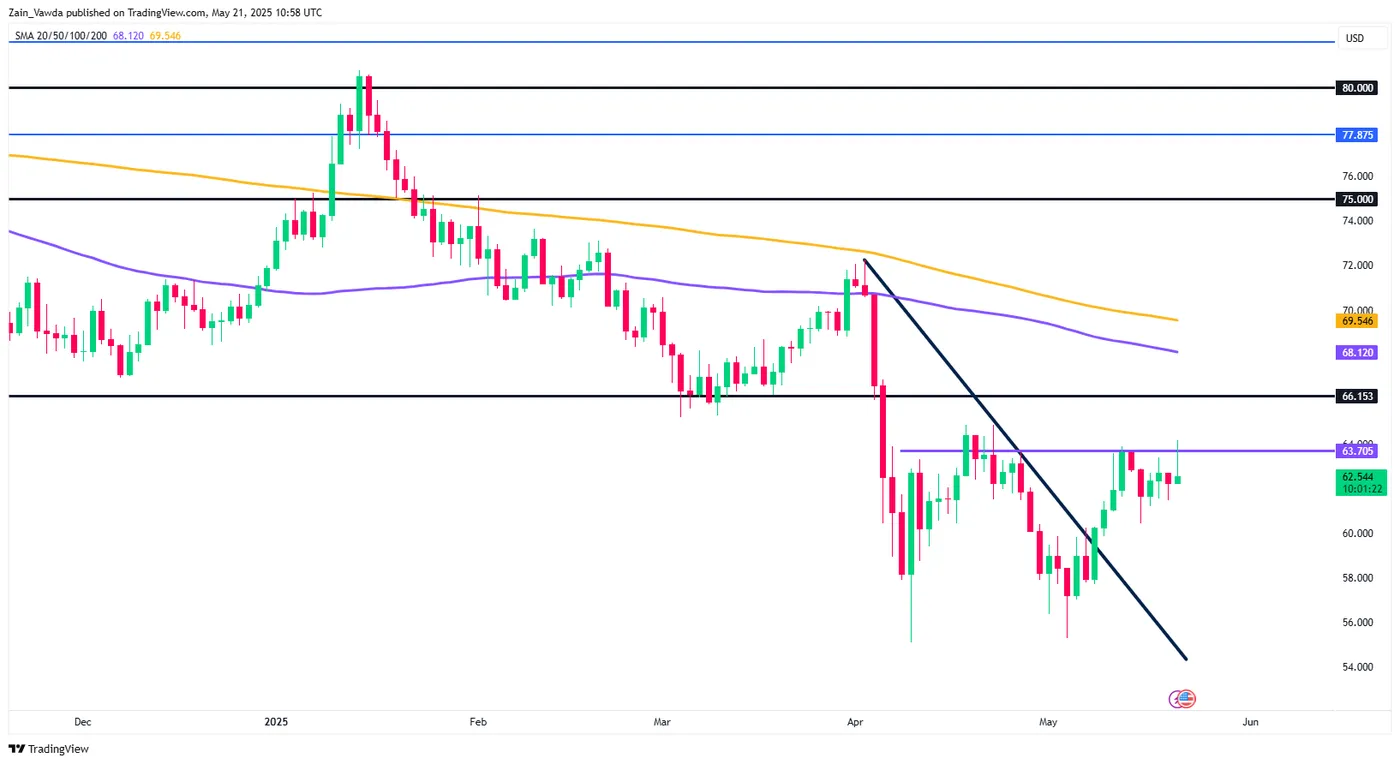
Source: TradingView.com (click to enlarge)
Support
- 61.50
- 60.56
- 60.00
Resistance
- 63.00
- 63.70
- 65.00
Pound Steady as UK Inflation Surges
Pound hits highest level since Feb. 2022
The British pound posted gains earlier but has failed to consolidate. In the European session, GBP/USD is trading at 1.3395, up 0.03% on the day. The pound has gained 1.1% this week and earlier today rose as high as 1.3468, its highest level since Feb. 2022.
UK inflation jumps to 3.5%
UK inflation jumped to 3.5% y/y in April, up sharply from 2.6% in March and above the market estimate of 3.3%. This was the highest annual inflation rate since Jan. 2024 and was driven by higher prices for transport, housing and energy. Monthly, inflation soared to 1.2%, up from 0.3% and above the market estimate of 1.1%.
The news wasn't much better from core CPI, which rose to 3.8% from 3.4% and was higher than the market estimate of 3.6%. This was the highest reading since April 2024. Monthly, the core rate jumped to 1.4%, up from 0.5% and above the market estimate of 1.2%.
The rise in inflation can be partially attributed to the increase in the energy price cap and the Easter holidays, but is a disappointment for the government and for the Bank of England, as inflation had been trending lower.
The BoE will be concerned by the rise in core inflation, which will complicate plans to further reduce rates. The BoE trimmed the cash rate by a quarter-point earlier this week to 4.25%, but rates are still higher than other major central banks, with the exception of the Federal Reserve.
The Federal Reserve is taking a wait-and-see attitude before it lowers rates again, especially with the uncertainty swirling around US tariff policy. Atlanta Fed President Raphael Bostic said this week that even reduced tariffs would be "definitely economically significant" and said he favored one rate cut this year.
GBP/USD Technical
GBP/USD tested resistance at 1.3408 earlier. Above, there is resistance at 1.3422
1.3385 and 1.3371 are the next support levels
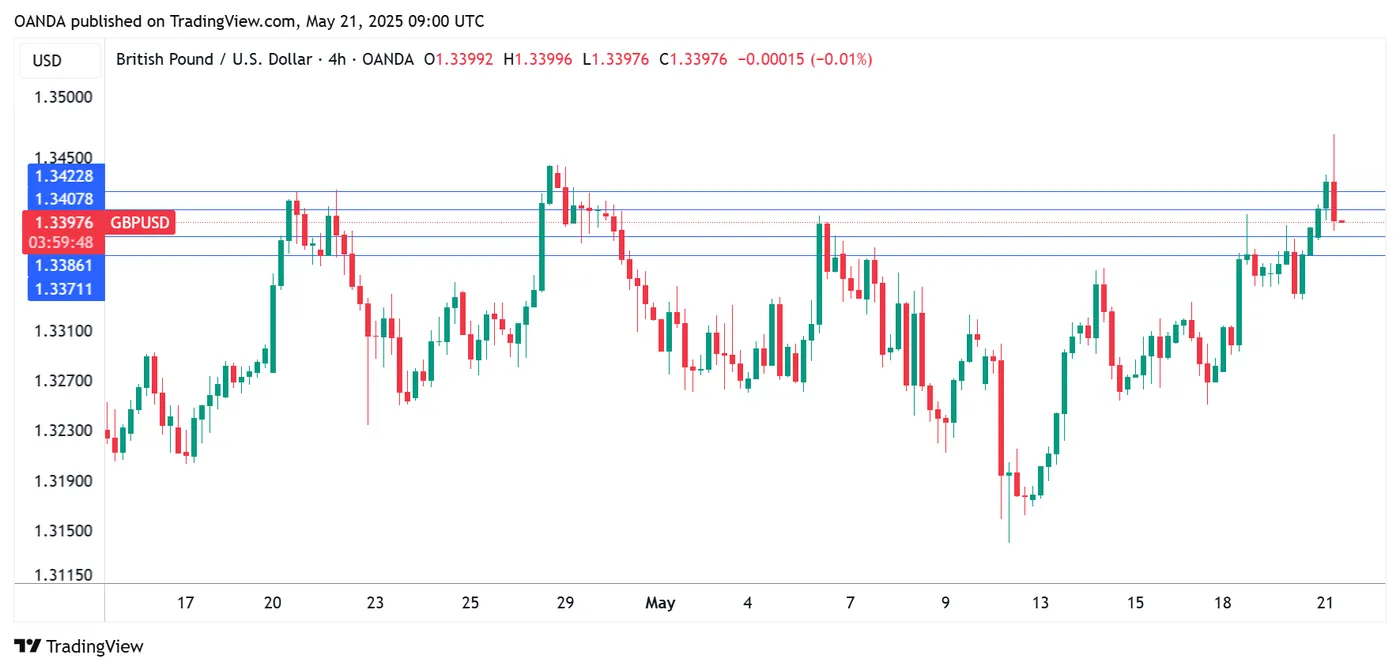
GBPUSD 4-Hour Chart, May 21, 2025
Oil Prices Surge Amid Threat of Strike on Iran
As shown on today’s XBR/USD chart, Brent crude oil prices have jumped (as indicated by the arrow) to a one-week high. This surge follows U.S. intelligence reports suggesting that Israel may be preparing to strike Iran’s nuclear facilities.
Although CNN, citing officials, noted that it remains unclear whether Israeli leaders have made a final decision, oil prices are rising as markets price in the risk of escalation disrupting Middle Eastern oil supply chains:
→ Iran is the third-largest oil producer within OPEC.
→ There is concern that Iran could retaliate by blocking the Strait of Hormuz in the Persian Gulf — a key shipping route used by Saudi Arabia, Kuwait, and others to export oil products.
Technical Analysis of XBR/USD
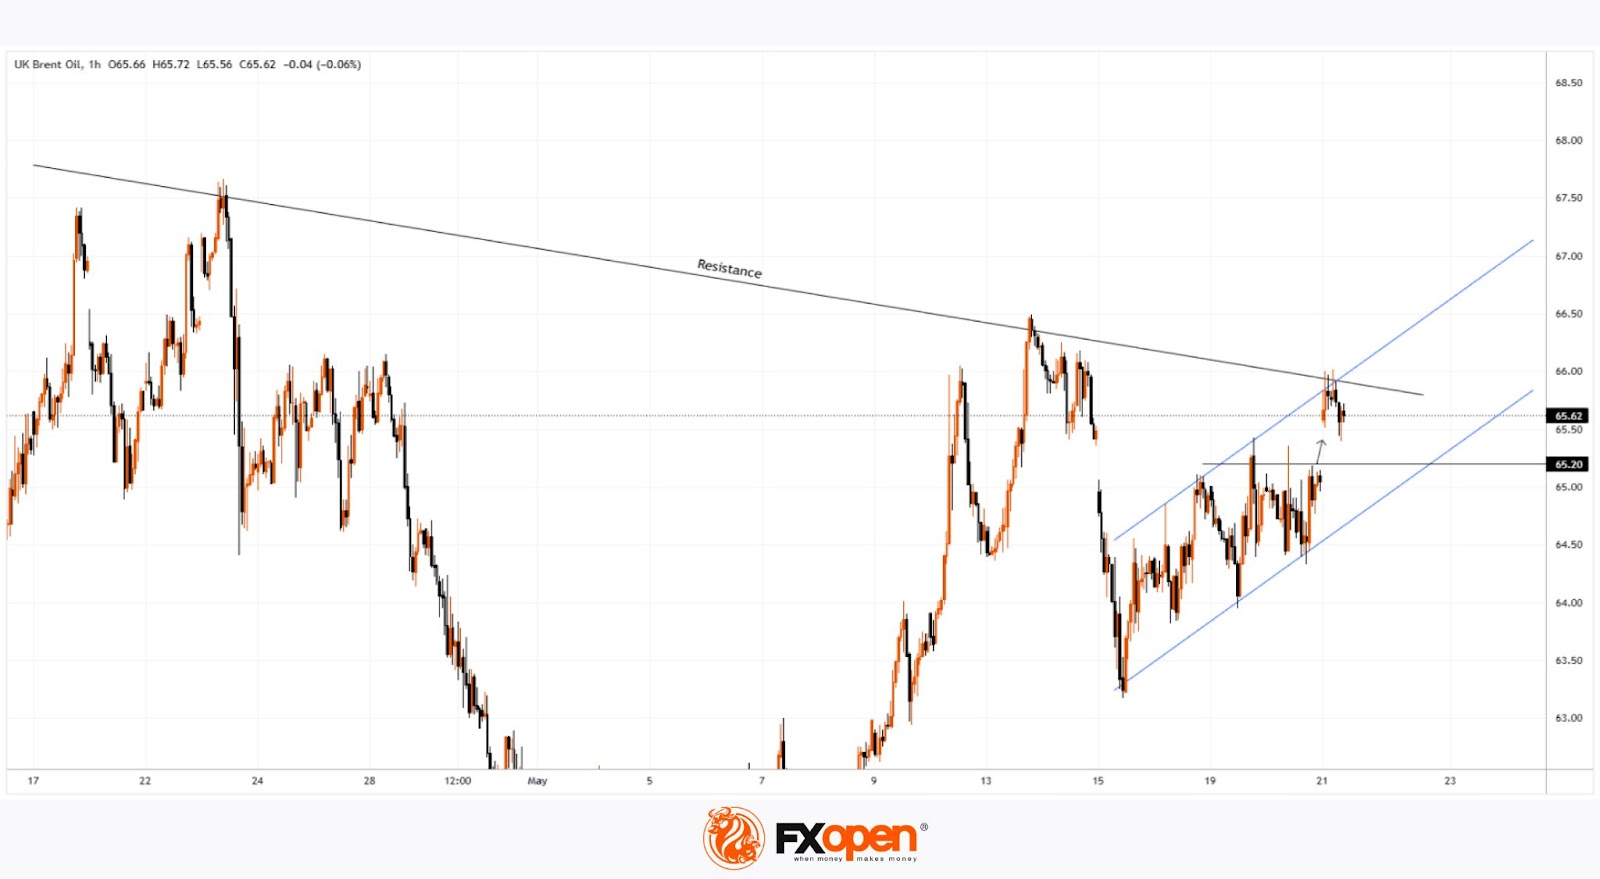
Brent crude oil price has climbed towards the descending trendline (marked in black), drawn through key highs from April and mid-May. From a bearish perspective, this key resistance could trigger a downward pullback.
On the other hand, recent price action in Brent suggests upward momentum (indicated by blue lines), with the $65.20 level — previously a cap — potentially turning into support after a breakout.
Whether the black resistance line is broken will largely depend on geopolitical developments. It is possible that reports of an imminent missile strike on Iran may later be refuted.
Start trading commodity CFDs with tight spreads. Open your trading account now or learn more about trading commodity CFDs with FXOpen.
This article represents the opinion of the Companies operating under the FXOpen brand only. It is not to be construed as an offer, solicitation, or recommendation with respect to products and services provided by the Companies operating under the FXOpen brand, nor is it to be considered financial advice.
Gold Prices Climb Amid Geopolitical Tensions
The price of gold rose to $3,303 per troy ounce on Wednesday, nearing a two-week high. The precious metal gained for the third consecutive day, following a 2% surge the previous day as investors sought safety amid heightened geopolitical uncertainty.
Key drivers behind the rally
Middle East Tensions: fears of escalation increased over a potential Israeli strike on Iran’s nuclear facilities, which could trigger retaliatory measures from Tehran.
US Political Uncertainty: President Donald Trump’s remarks on peace talks between Russia and Ukraine added to market unease, though he distanced himself from a mediating role.
Dollar Weakness: the US dollar remained under pressure after the Federal Reserve’s cautious economic outlook and Moody’s downgrade of the US credit rating, citing rising government debt.
Trade & Fiscal Policy: investor confidence in the dollar was further dented by uncertainty over trade tariffs and the pending vote on Trump’s proposed tax reforms.
As a result, the dollar’s weakness has made gold more attractive to international buyers.
Technical analysis: XAU/USD
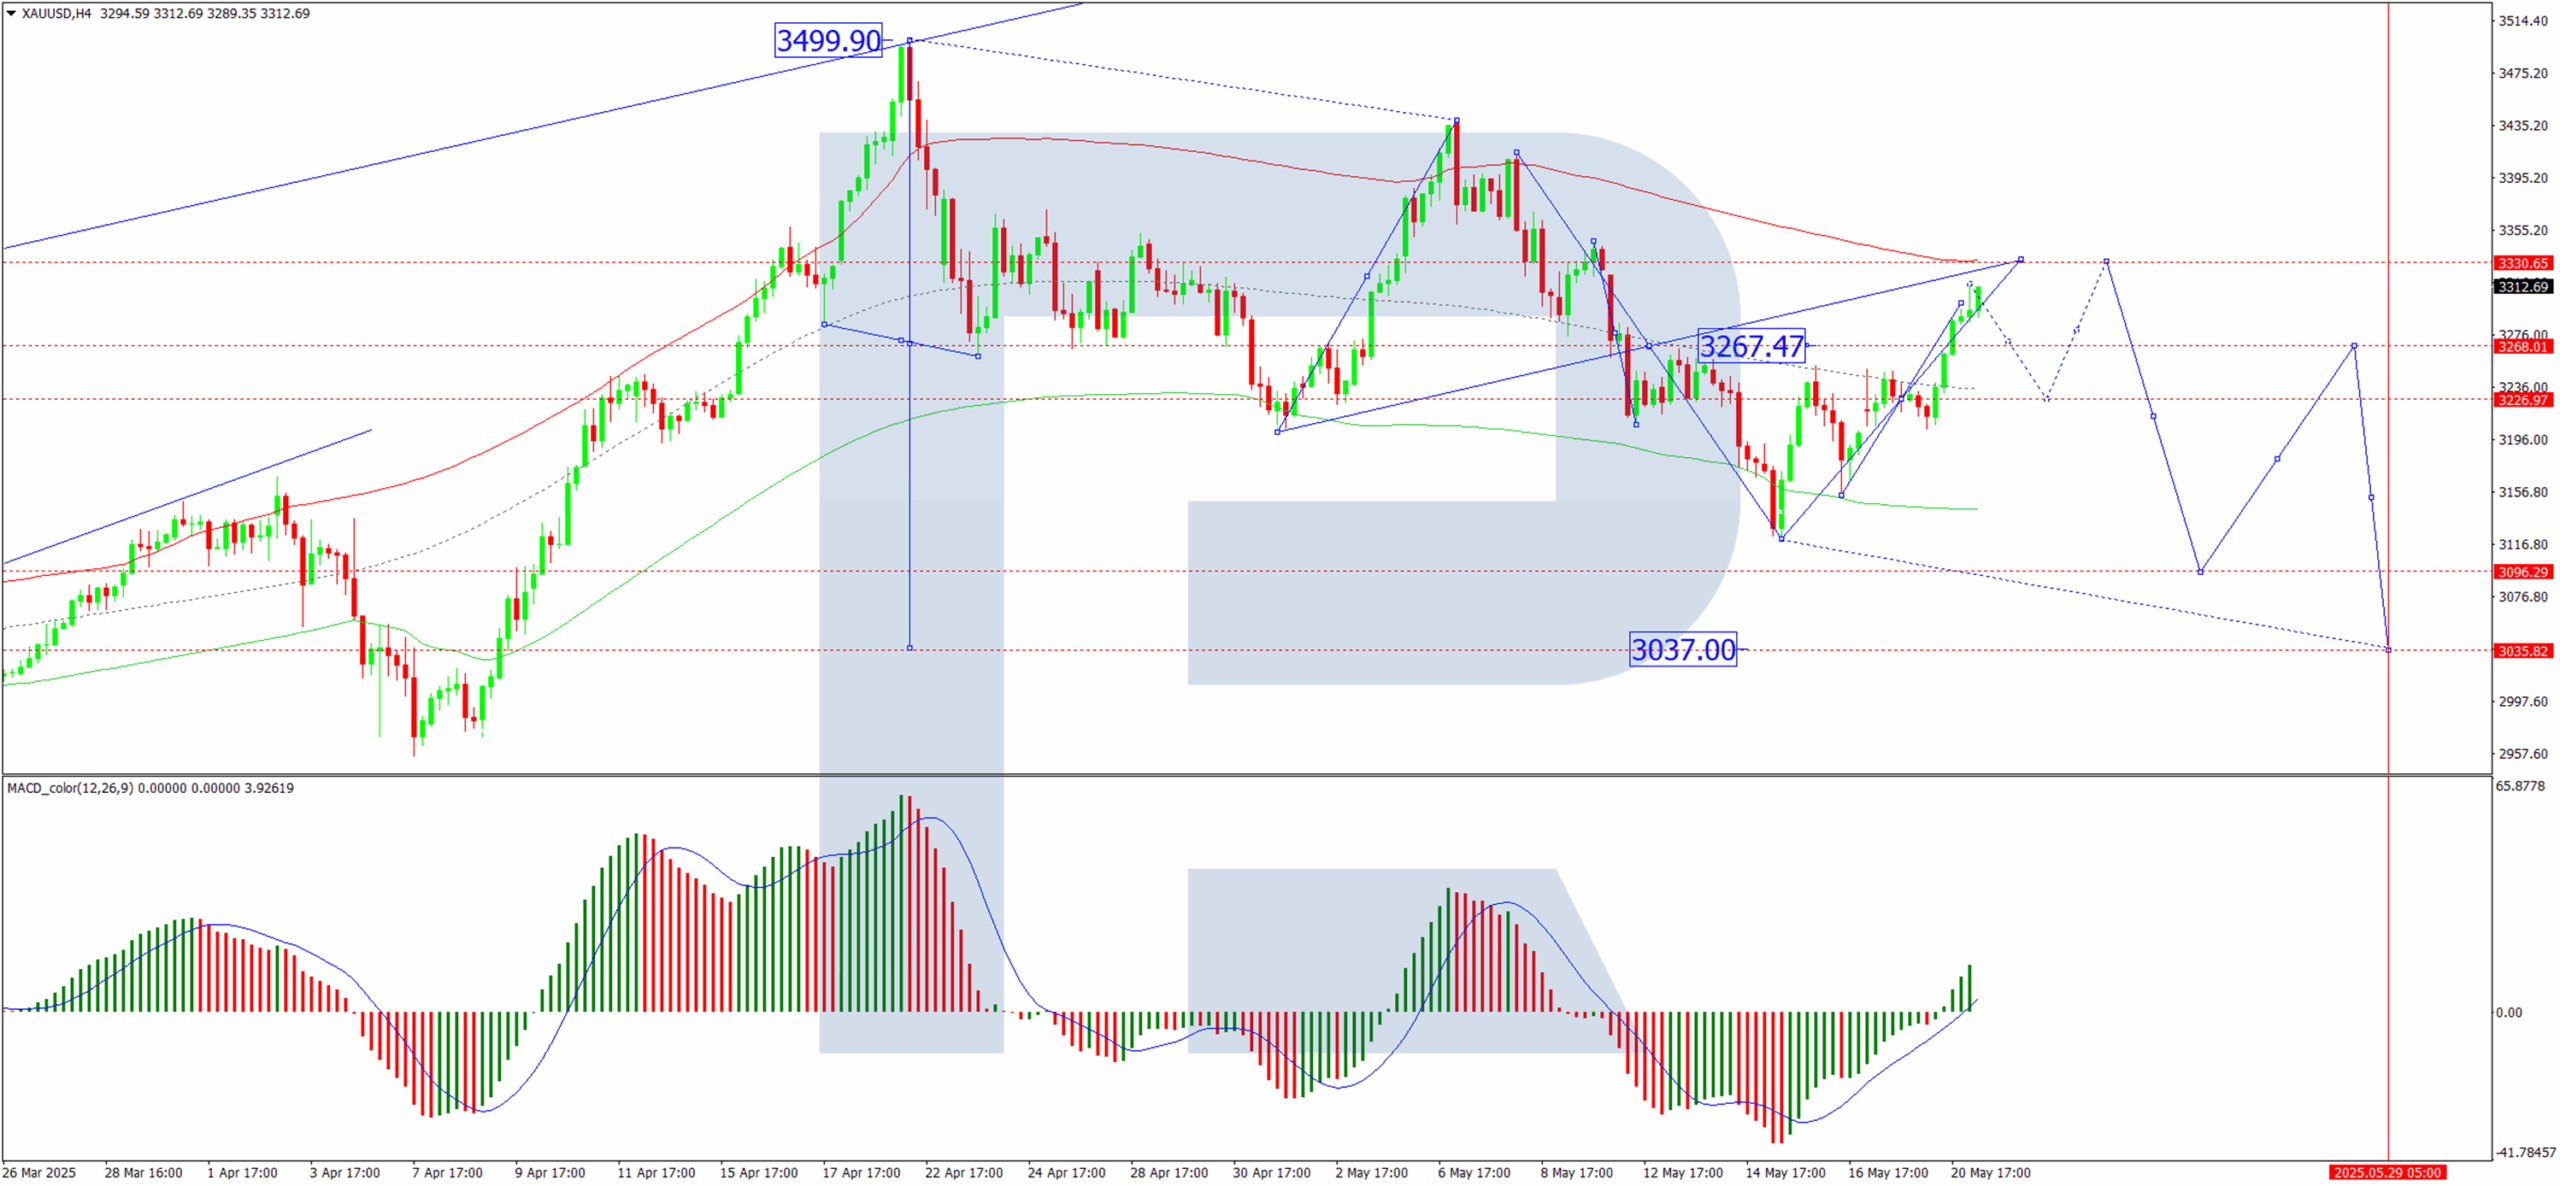
H4 Chart:
- The market consolidated near 3,222 before breaking upward
- The immediate upside target of 3,312 has now been met
- A pullback to retest 3,222 (from above) is likely, followed by a potential rise towards 3,333
- MACD Indicator: The signal line remains above zero and points upward, supporting further gains
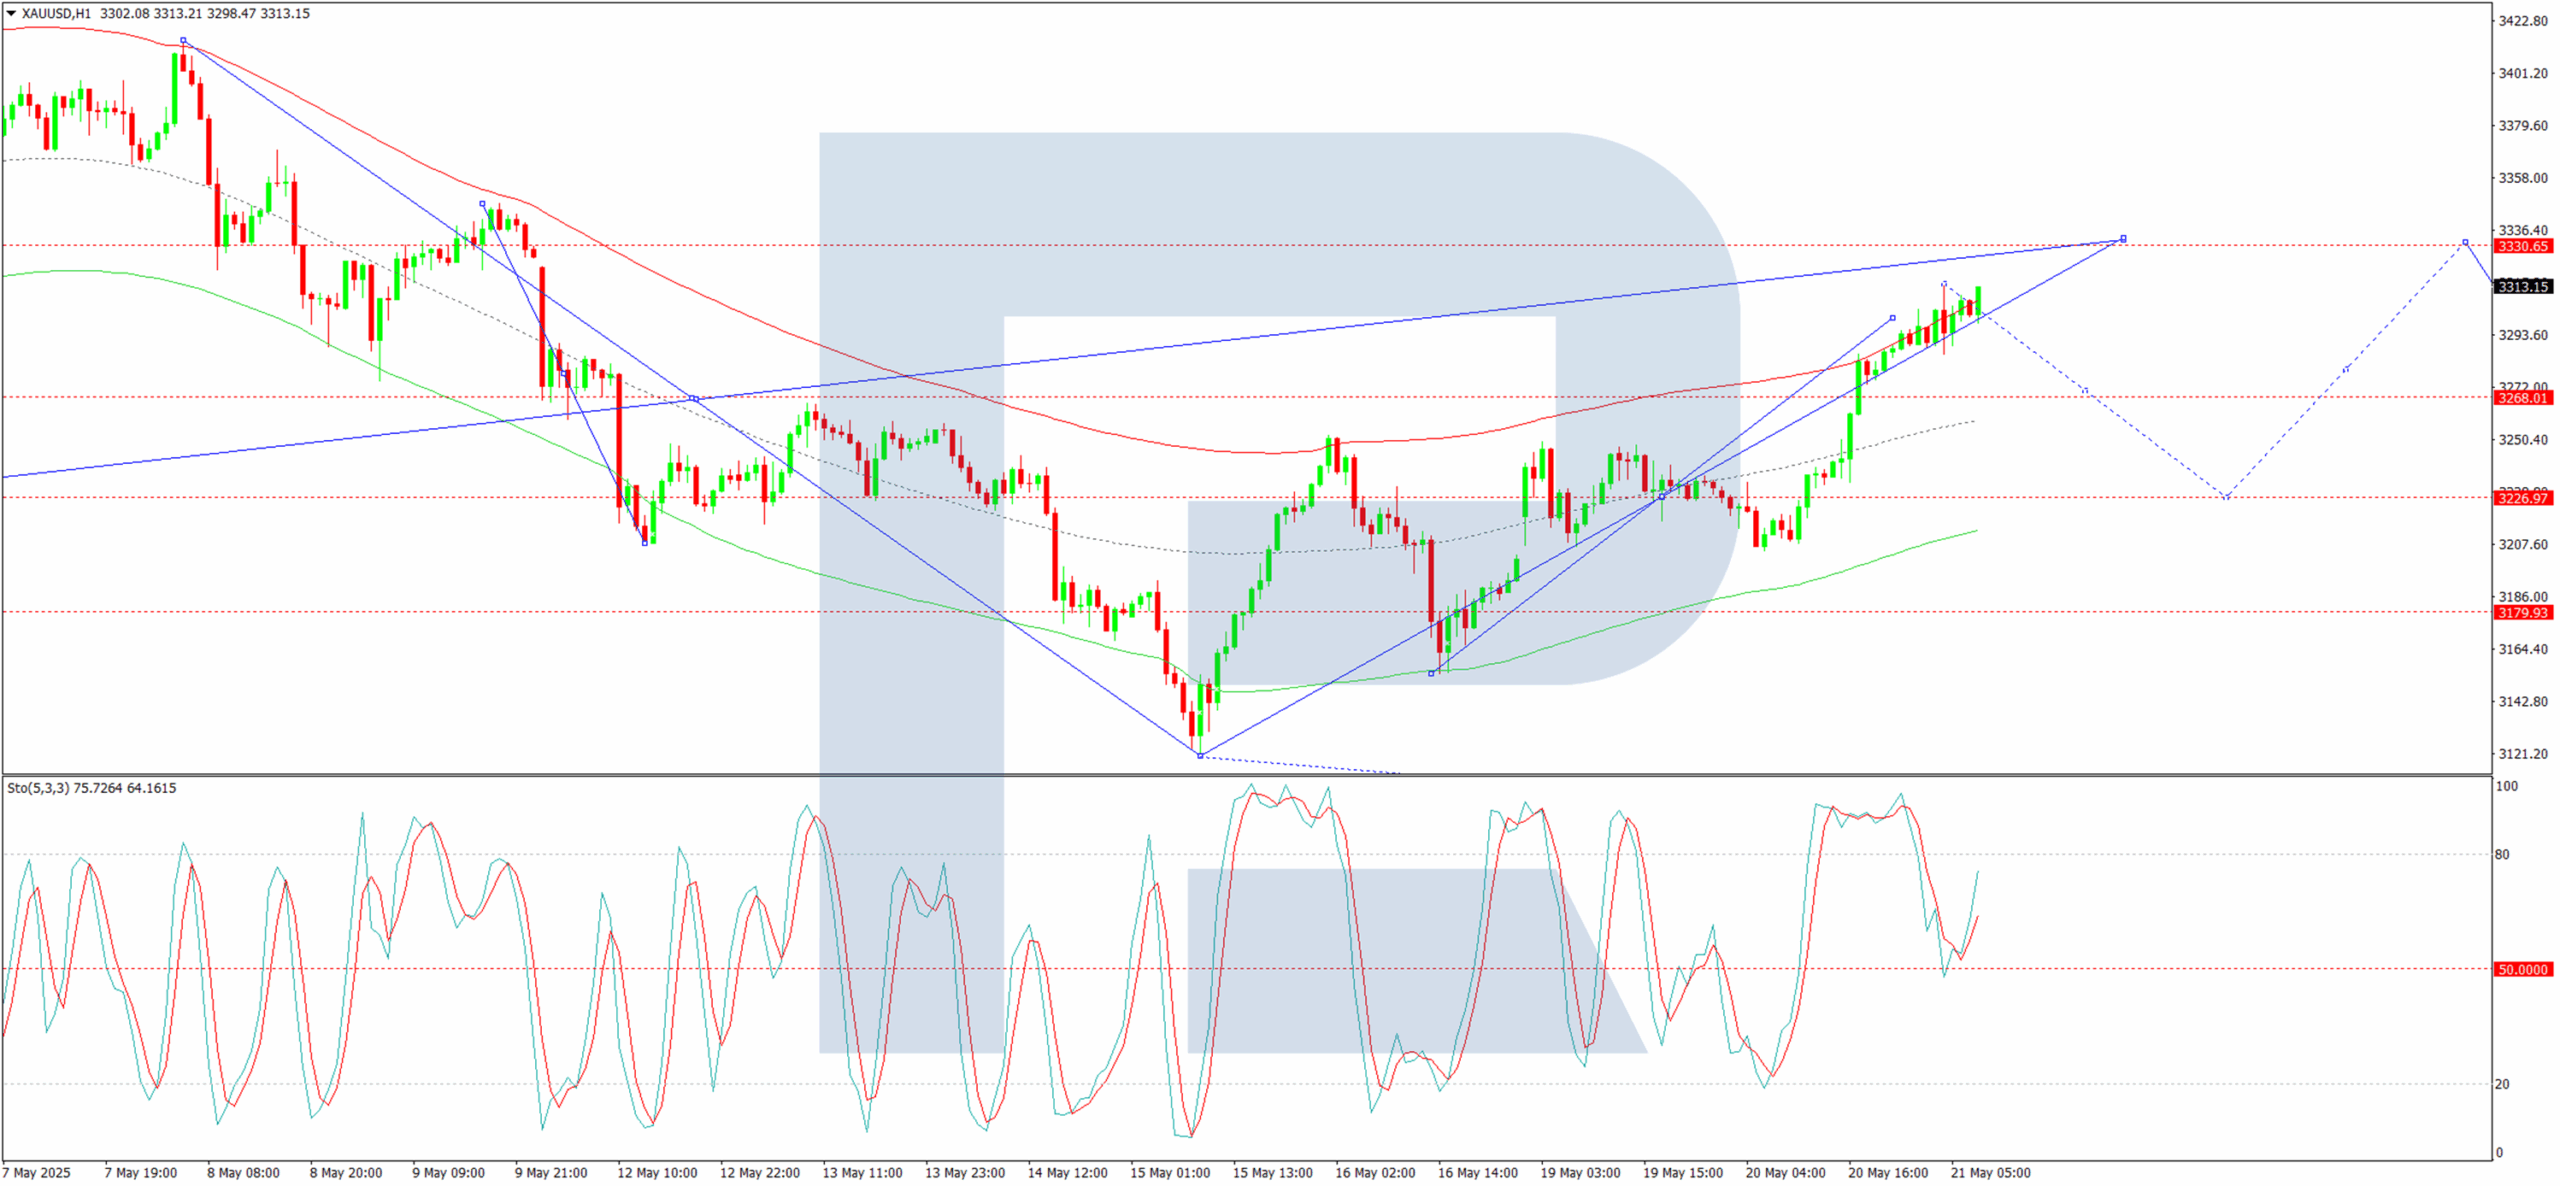
H1 Chart:
- The pair broke through 3,250 and continued its upward trajectory towards 3,333
- A short-term correction to 3,222 is expected before another push higher
- The current uptrend is viewed as corrective; once complete, a downward wave towards 3,222 may follow
- Stochastic Oscillator: The signal line is below 80 and trending downward towards 20, indicating potential near-term weakness
Conclusion
Gold’s rally reflects its role as a haven amid geopolitical risks and dollar softness. While technical indicators point to a temporary correction, the broader uptrend remains intact, with 3,333 as the next key resistance level.
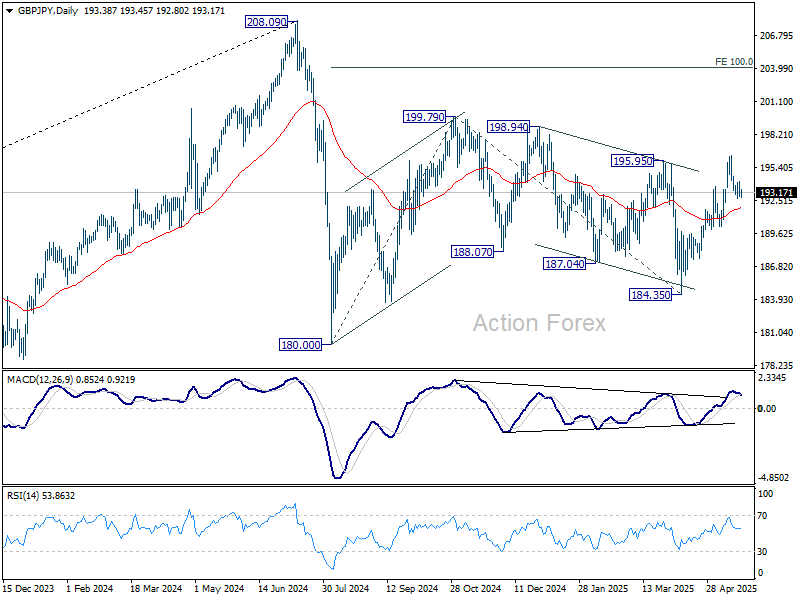
GBP/JPY Daily Outlook
Daily Pivots: (S1) 192.89; (P) 193.56; (R1) 194.19; More...
Intraday bias in GBP/JPY remains neutral at this point. More consolidations could be seen below 196.38. Further rise is in favor as long as 190.22 support holds. On the upside, firm break of 195.95 will suggest that whole choppy decline from 199.79 has completed, and target this resistance next.
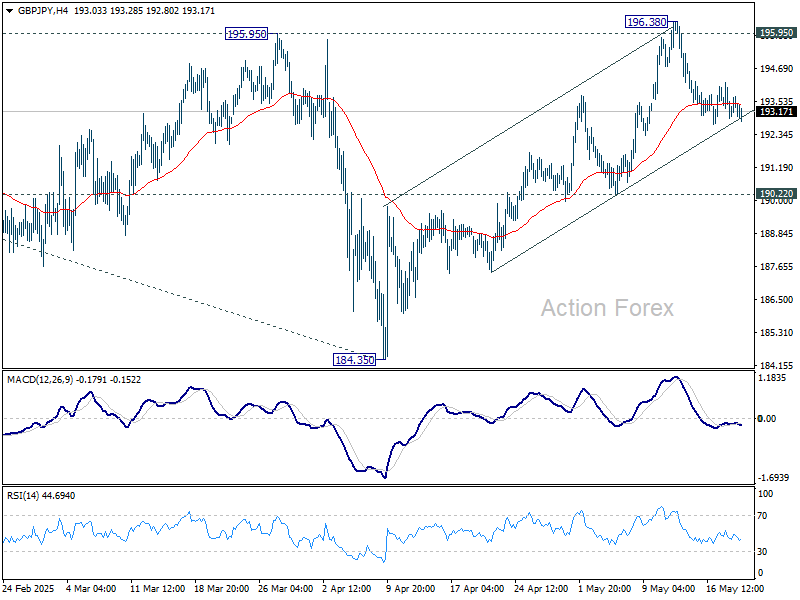
In the bigger picture, price actions from 208.09 are seen as a correction to rally from 123.94 (2020 low). Strong support should be seen from 38.2% retracement of 123.94 to 208.09 at 175.94 to contain downside. However, sustained break of 175.94 will bring deeper fall even still as a correction.
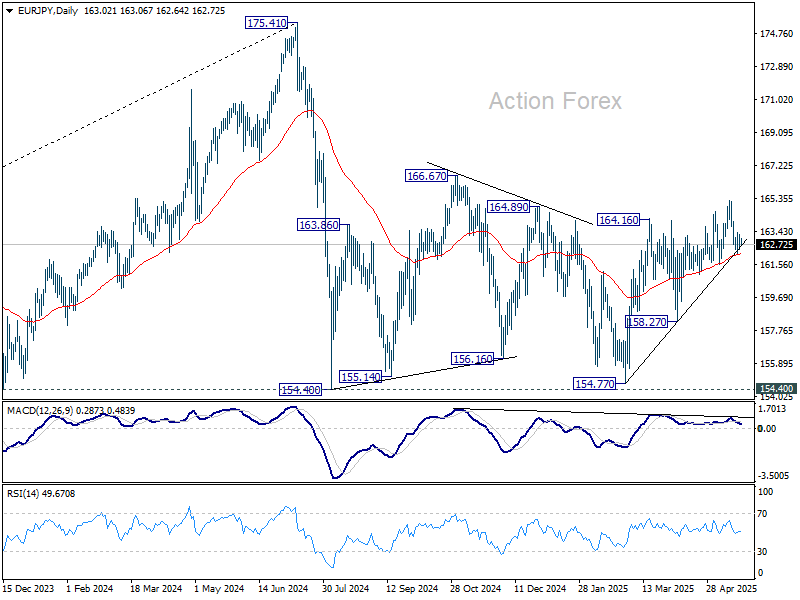
EUR/JPY Daily Outlook
Daily Pivots: (S1) 162.56; (P) 162.92; (R1) 163.42; More...
No change in EUR/JPY's outlook as range trading continues. Intraday bias stays neutral at this point. Further rally is in favor as long as 161.57 support holds. Break of 165.19 will resume the rise from 154.77 to 166.67 resistance. However, firm break of 161.57 will indicate near term reversal, and turn bias back to the downside.
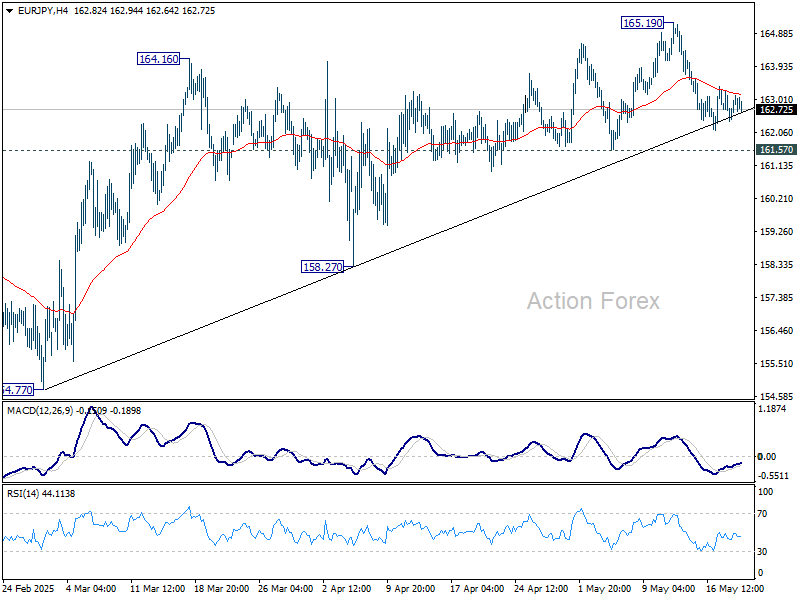
In the bigger picture, price actions from 175.41 are seen as correction to rally from 114.42 (2020 low). Strong support should be seen from 38.2% retracement of 114.42 to 175.41 at 152.11 to contain downside. However, sustained break of 152.11 will bring deeper fall even still as a correction.
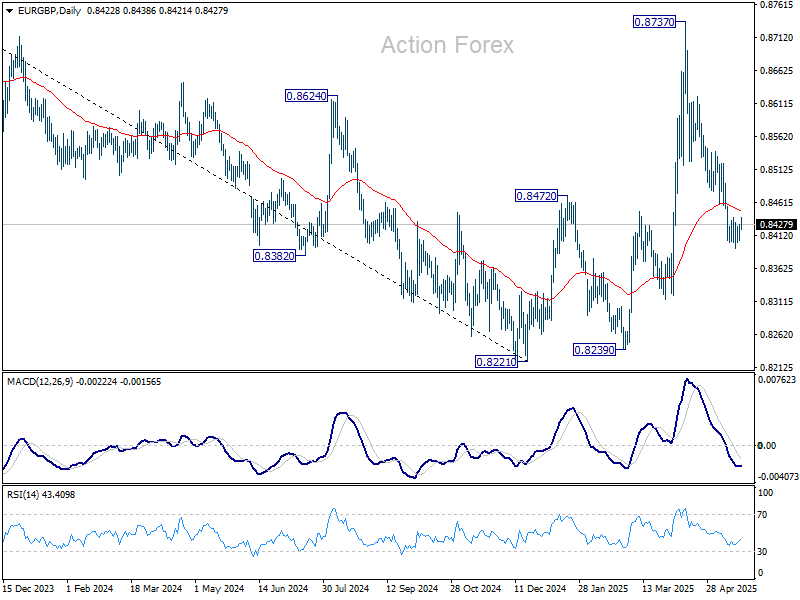
EUR/GBP Daily Outlook
Daily Pivots: (S1) 0.8399; (P) 0.8414; (R1) 0.8442; More...
Intraday bias in EUR/GBP is turned neutral as recovery from 0.8392 extends. More consolidations could be seen but further decline remains in favor as long as 0.8539 resistance holds. Below 0.8392 will resume the fall from 0.8737 to 0.8221/8239 support zone.
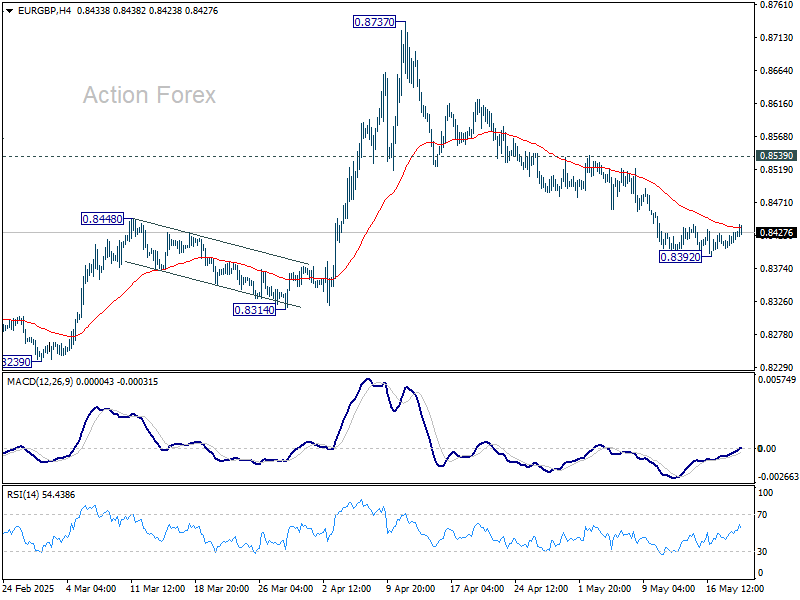
In the bigger picture, current development suggests that price actions from 0.8221 medium term bottom are merely forming a corrective pattern. However, there is no clear momentum to break through 0.8201 key support (2022 low) yet. Hence, range trading is expected between 0.8221/8737 for now.