
Sample Category Title
S&P 500 Technical Analysis: Six-Day Winning Streak Ends, Bullish Momentum Remains Intact
- S&P 500 saw its six-day winning streak end amidst rising US yields and concerns over Trump's tax cut proposals and US debt.
- The "Magnificent 7" stocks are currently underperforming but could potentially drive a larger S&P 500 recovery in the second half of 2025.
- Technical analysis indicates bullish momentum for the S&P 500, although a recent pullback suggests potential for a bearish correction.
The S&P 500 struggled today as US yields rose and markets await a crucial vote in Washington DC over US President Trump's tax cut proposals.
Trump visited Capitol Hill on Tuesday to urge Republican lawmakers to agree on a bill that would extend the 2017 tax cuts from his first term, among other measures.
Investors are concerned that this bill could increase the U.S. budget deficit faster than expected.
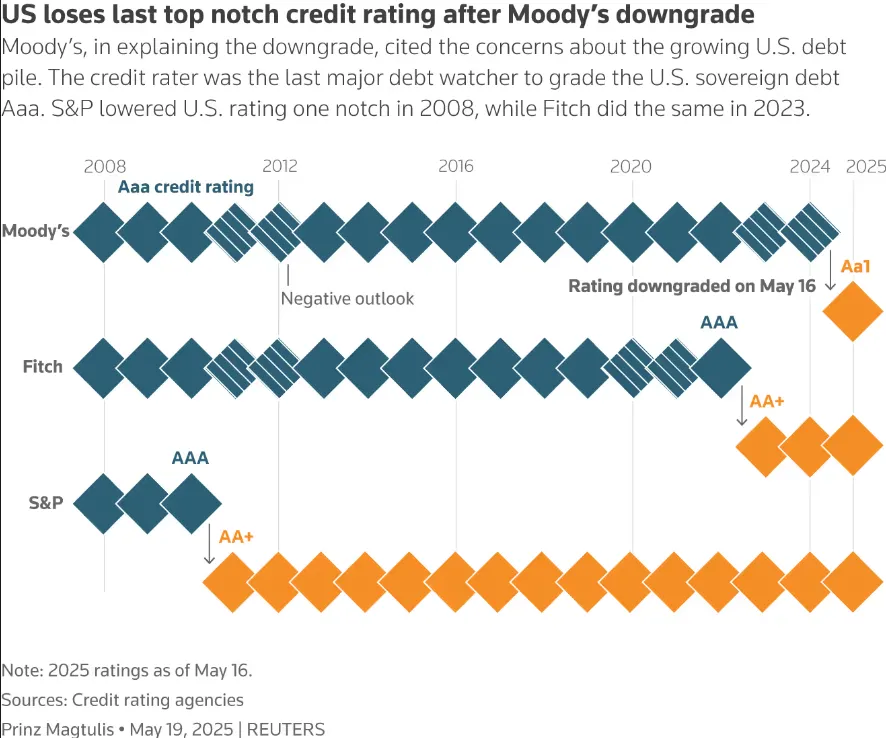
On Friday, Moody's Investors Service downgraded the U.S. credit rating, adding to worries about the country's growing debt.
Source: LSEG
Markets do appear to have shrugged off the Moody’s downgrade with yesterday's rally hinting at such.
Markets are also waiting on comments from Federal Reserve officials scheduled for later today as uncertainty around US monetary policy decisions continue to linger.
The S&P 500 is on a six-day winning streak but for the year thus far the magnificent 7 stocks have underperformed. As markets eye a bigger recovery, will the ‘mag 7’ stocks be the catalyst?
Magnificent 7 2025 Performance YTD
The magnificent 7 stocks still have some catching up to do in comparison to the rest of the index. This is actually a welcome change given last year's concern that the Mag 7 had been the driving force of the rally over the last 24 months or so.
The change in market dynamics has seen market participants spread their exposure around this year and pivot to other sectors.
The interesting question though, is if the Mag 7 stocks post a good recovery in the second half of 2025 will this drag the S&P to fresh all-time highs? Now obviously this would depend on a lot of variables but it does require a closer look.
A recent Bloomberg survey revealed Wall Street strategists have mixed views regarding the end of year target for the S&P 500. According to the survey, the median S&P 500 year-end target is 5,900 for 2025, but the forecasts range widely from 5,200 to 7,007, reflecting significant divergent market views.
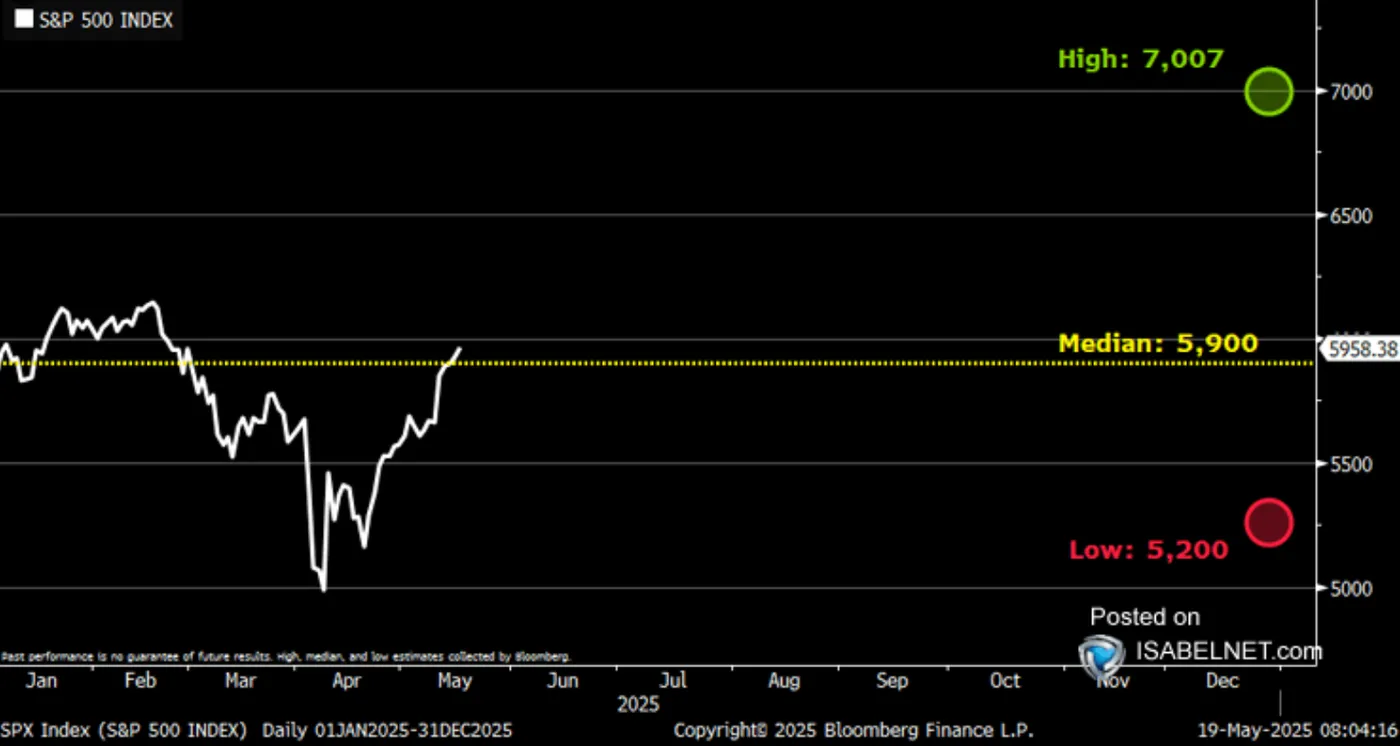
Source: IsabelNet, Bloomberg
This is a definite possibility but there are a host of variables that are in play. These estimates could change pretty drastically as the year progresses, we have already seen some drastic changes to global forecasts on a host of asset classes in 2025. This rollercoaster is one I expect may continue.
Technical Analysis - S&P 500
From a technical standpoint, the S&P 500 on the weekly timeframe enjoyed a bullish week last week.
The new week has started somewhat more cautiously but bulls still appear to be holding the upper hand.
The period-14 RSI reinforces this as it remains above the neutral 50 handle which suggests bullish momentum remains intact.
Tuesday daily candle close did however snap a six-day winning streak with the S&P closing as an imperfect hanging man candlestick. This is usually a sign of a bearish correction which may concern bulls looking at intraday moves.
S&P 500 Weekly Chart, May 20, 2025
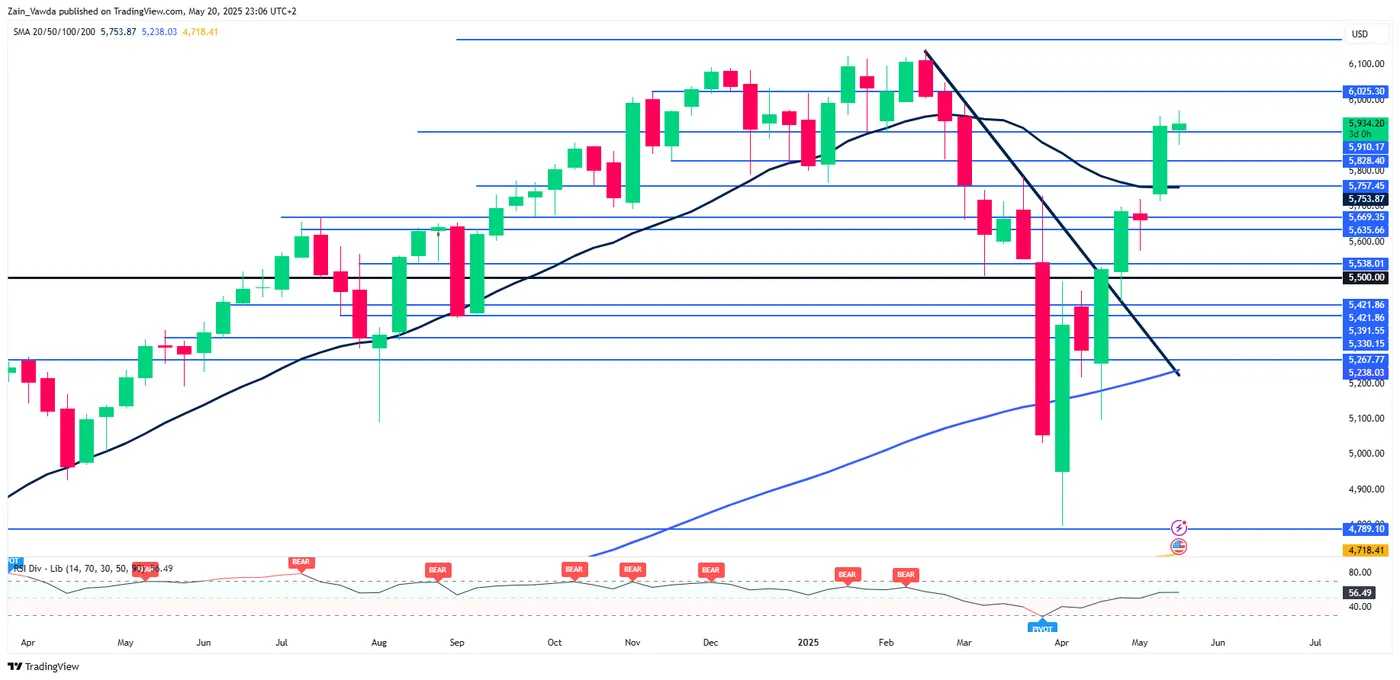
Source: TradingView (click to enlarge)
Dropping down to a four-hour chart (H4), the S&P 500 index has been staircasing its way higher since bottoming out on April 7, 2025.
More recent price action shows that bulls remain in control following a series of higher highs and higher lows.
However Tuesday's session did see a significant pullback toward support at 5910 before bouncing higher once more.
For now, the bullish structure remains intact with a four-hour candle close below the 5883 handle needed to invalidate the bullish momentum.
Until then the chances of another higher high remains strong but this will obviously hinge on market sentiment remaining positive.
S&P 500 Four-Hour Chart, May 20, 2025
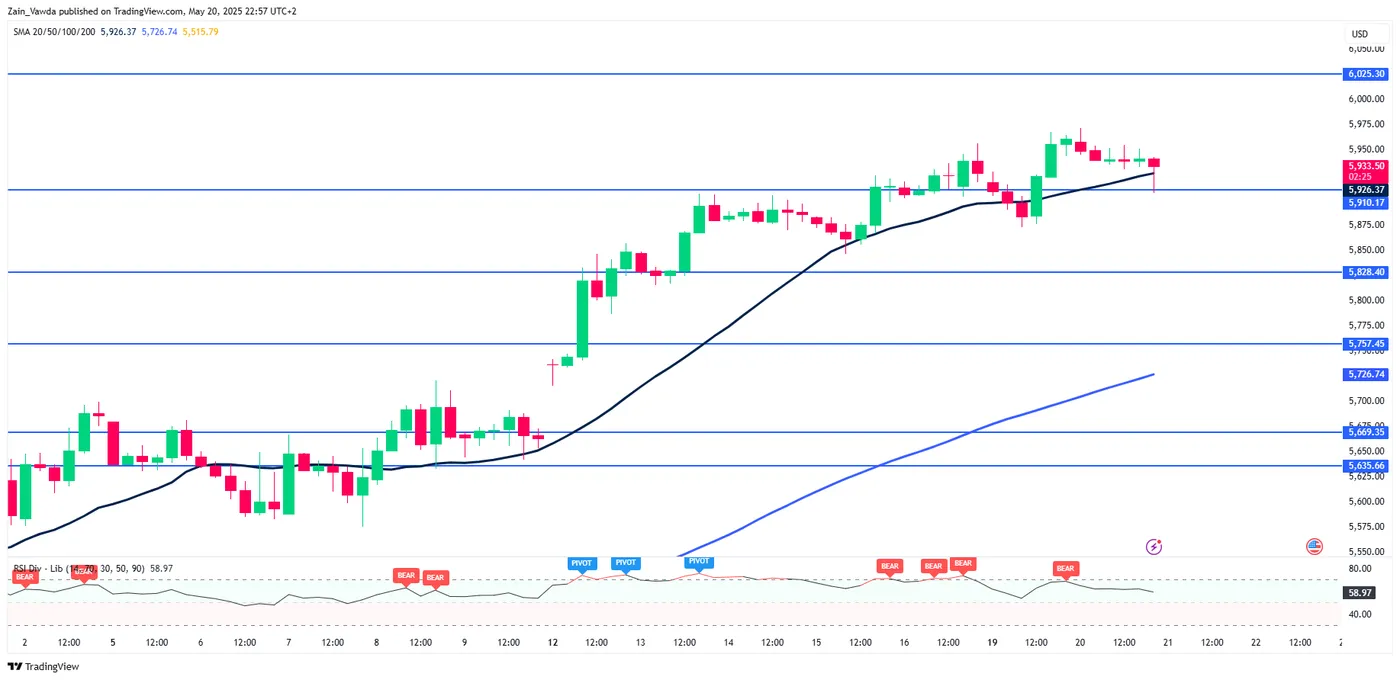
Source: TradingView (click to enlarge)
Support
- 5910
- 5883
- 5828
Resistance
- 5971
- 6000
- 6025
Silver Price Forecast: XAG/USD Jumps on Renewed Safe-Haven Demand
Currently trading at around ~33.0865 per troy ounce, silver trades higher in today’s session on a weaker dollar and renewed safe-haven demand.
XAG/USD: Key Takeaways
- With the dollar continuing to weaken, XAG/USD trades ~2.25% higher today, trading above $33 for the first time since May 6th.
- The recent downgrade of the United States’ credit rating has boosted safe-haven demand, with questions asked over escalating US national debt and rising interest rate costs.
- Increased US rate cut bets are also benefiting silver pricing, with markets increasingly anticipating two interest rate cuts in 2025.
XAG/USD: Silver gains on U.S. debt downgrade
With the market having time to digest Moody’s report from Friday, investor confidence has made way for renewed safe-haven demand, ultimately benefiting precious metal pricing.
Cited at $36 trillion by Moody’s, the outstanding budget deficit has proven a cause for concern for American investors, with weakness in public finances weighing negatively on the dollar and US bond markets.
In the face of this, Trump continues to seek congressional approval of his proposed “big, beautiful” tax bill, representing the latest Trump administration proposal. With seemingly no end to radical policy changes, markets are understandably somewhat mixed about the future of the US economy, with traditional safe-haven assets reporting increased inflows.
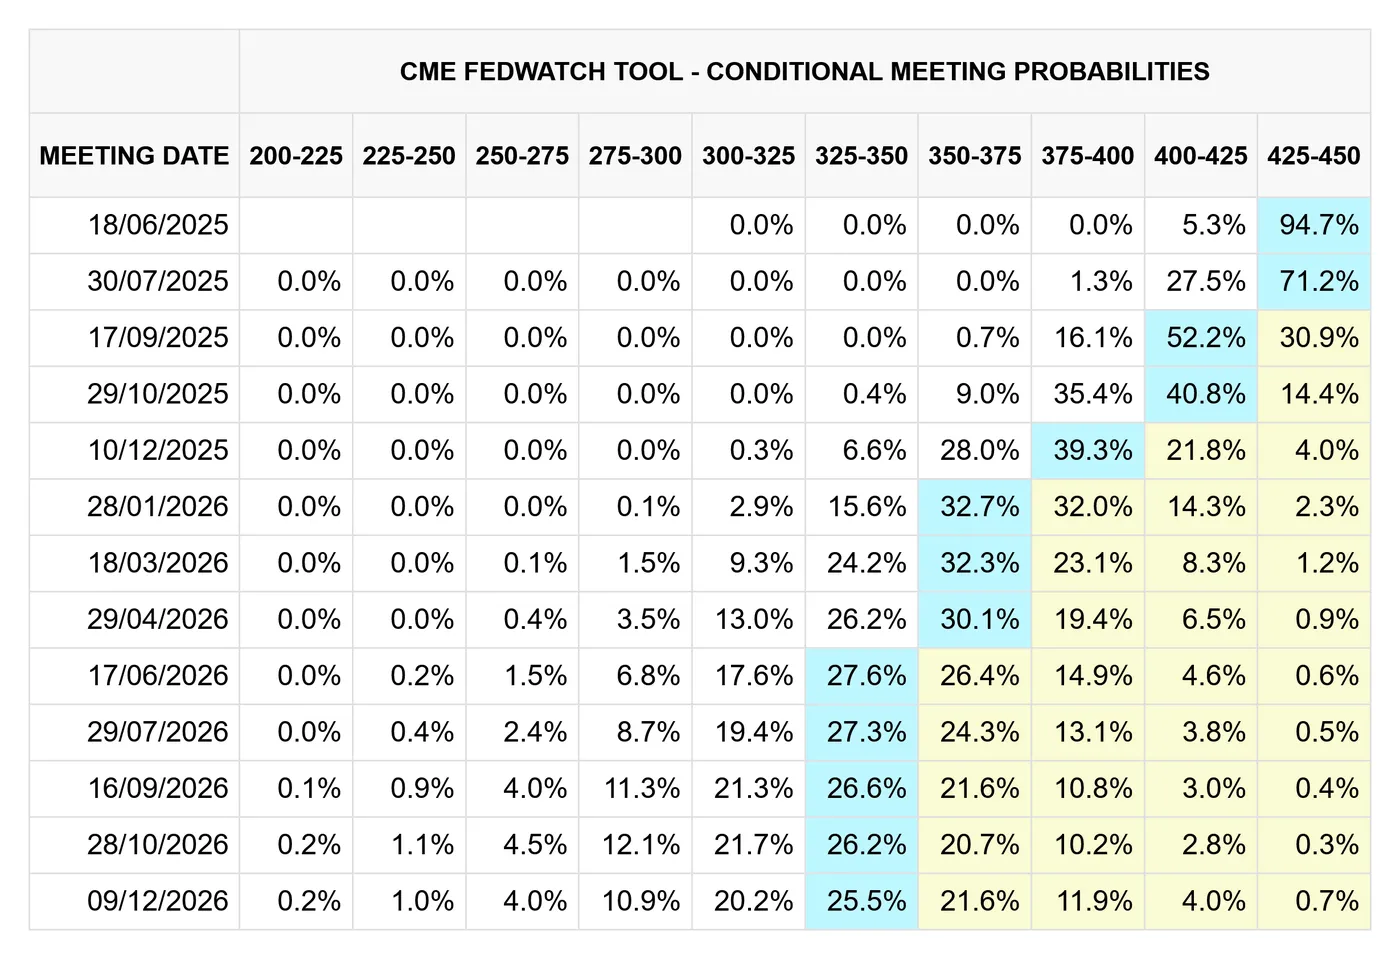
CME FedWatch, CME Group 20/05/2024
XAG/USD: Dollar weakness extends silver rally
Snapping a 4-week winning streak and now on pace for its worst week since early April, the U.S. dollar (DXY) continues to weaken amid evolving monetary policy expectations and general market uncertainty on the US economy.
Choosing to maintain rates in their most recent meeting, recent commentary from the Federal Reserve has markets increasingly anticipating two rates in 2025, coupled with data showing inflation is cooling faster than expected.
This will be welcome news for President Trump, who recently clarified his preference for lower interest rates.
As a non-yielding asset, a more hawkish Federal Reserve is likely to benefit stores of wealth such as silver, with the opportunity cost of holding precious metals becoming comparatively lower.
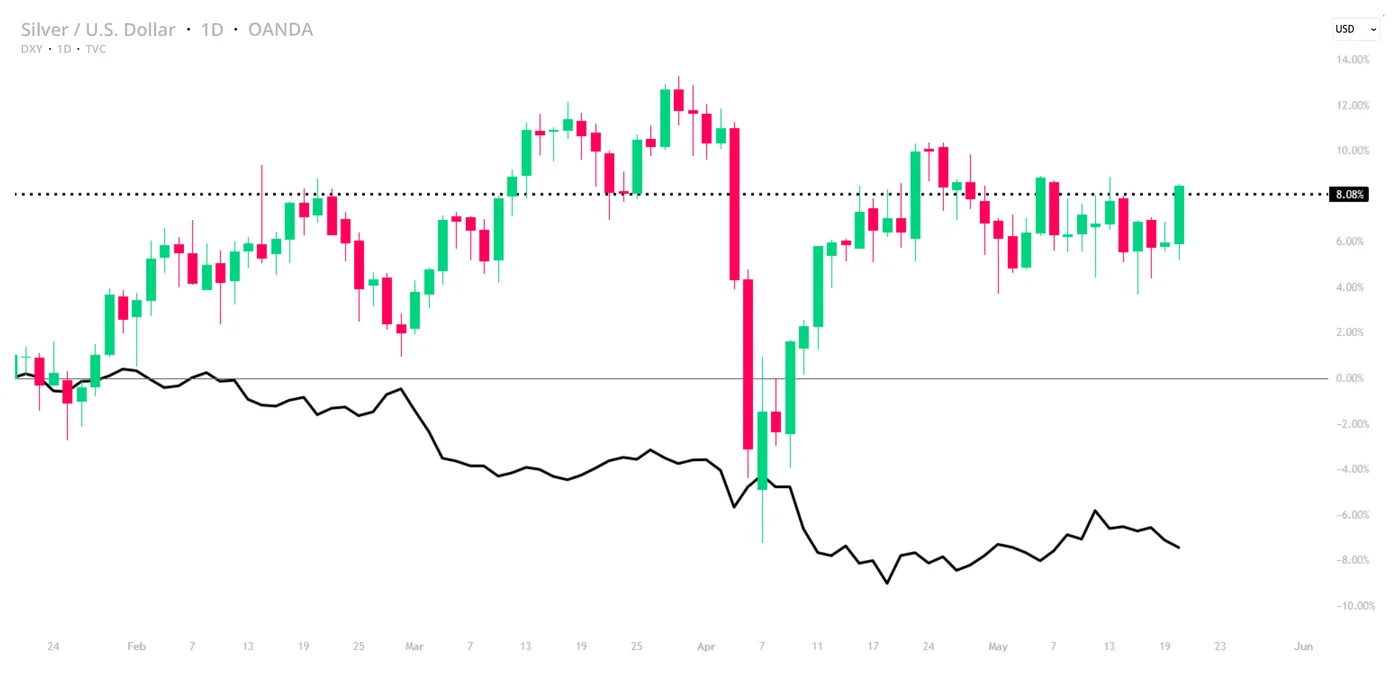
A chart showing the recent price action of XAGUSD & DXY. OANDA, TVC, TradingView, 20/05/2024
XAG/USD technical analysis
- Acting as a significant resistance level, silver broke above $33 for the first time since May 6th in today’s session, paving the way for further upside. If the rally is to continue, bulls will likely target ~33.18832.
- Current readings suggest a growing trend strength when using the 14-period ADX on the daily timeframe. Trading at a ~5.30% discount from all-time highs, further upside remains viable.
Platinum Wave Analysis
Platinum: ⬆️ Buy
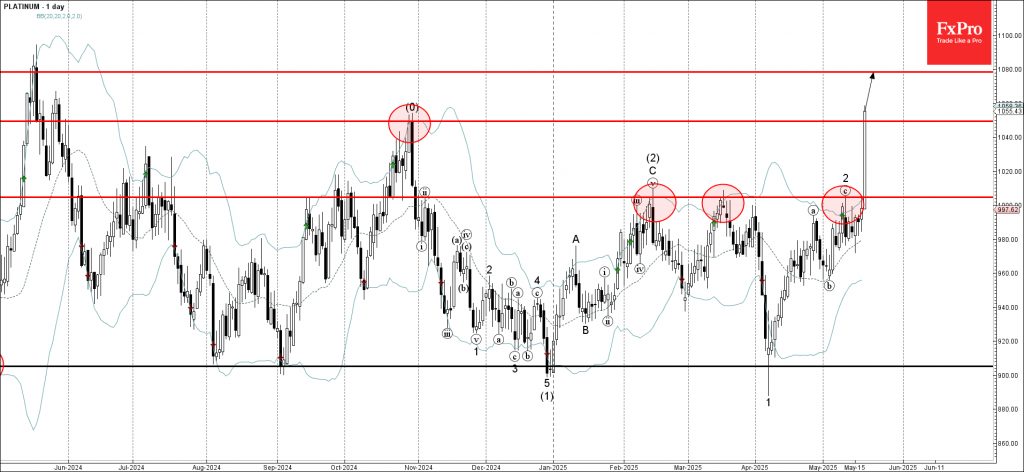
- Platinum broke the resistance level 1005.00
- Likely to rise to resistance level 1080.00
Platinum recently broke the resistance level 1005.00, former monthly high from February and March, as can be seen from the daily Platinum chart below.
The breakout of the resistance level 1005.00 increased the bullish pressure on Platinum.
Having just broken above the key resistance level 1050.00 (former monthly high from October), we can expect Platinum to rise to the next resistance level 1080.00.
EURUSD Wave Analysis
EURUSD: ⬆️ Buy
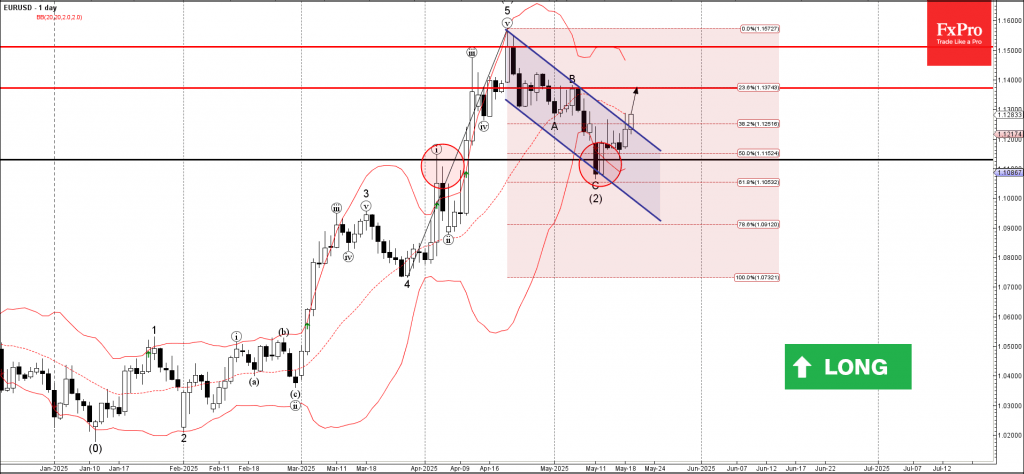
- EURUSD broke daily down channel
- Likely to rise to resistance level 1.1370
EURUSD currency pair continues to rise inside the minor impulse wave (3), which started earlier from the strong support level 1.1130 intersecting with the support trendline of the daily down channel from April.
The support level 1.1130 was strengthened by the 50% Fibonacci correction of the sharp upward impulse 5 from March.
Given the clear daily uptrend, EURUSD currency pair can be expected to rise to the next resistance level 1.1370 (which stopped the previous correction B).
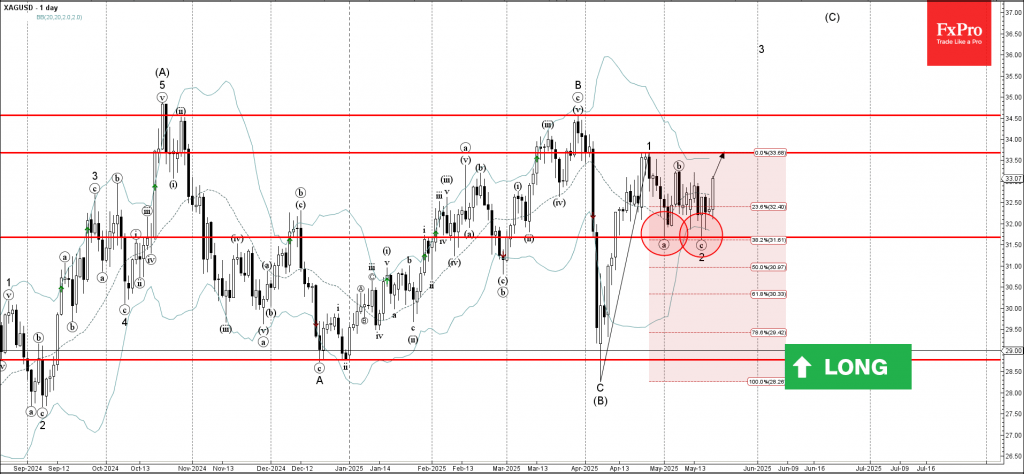
Silver Wave Analysis
Silver: ⬆️ Buy
- Silver reversed from support level 31.70
- Likely to rise to resistance level 33.50
Silver recently reversed from the pivotal support level 31.70 (which stopped the previous minor wave a at the end of April, as can be seen from the daily Silver chart below).
The support level 31.70 was further strengthened by the lower daily Bollinger Band and by the 38.2% Fibonacci correction of the upward impulse 1 from April.
Silver can be expected to rise to the next resistance level 33.50 (which stopped the previous minor impulse wave 1).
Canada’s Inflation Eases, Canadian Dollar Edges Lower
The Canadian dollar continues to have a quiet week. In the North American session, USD/CAD is trading at 1.3920, down 0.21% on the day.
Canadian CPI eases to 1.7%, core CPI higher
Canada released the April inflation report, which indicated that headline and core inflation were moving in opposite directions. Headline CPI dropped sharply to 1.7% y/y, down from 2.3% but shy of the market estimate of 1.6%. This was the lowest annual inflation rate in seven months. The sharp drop was driven by the end of the consumer carbon tax, with gasoline prices dropping 18% lower compared to April 2024.
Core inflation accelerated in April, with two key indicators rising to an average of 3.15%, compared to 2.85% in March. This was above the market estimate of 2.9%.
OAU-PRS-236-MarketPulse-variant2-Square
Will BoC cut rates in June?
The money markets have responded to the inflation data, lowering the probability of a rate cut at the June 4 meeting to 48%, down from 65% prior to the inflation release.
The Bank of Canada has been aggressive in its easing cycle, trimming rates seven straight times from June 2024 until April, when it held rates. The cash rate is currently at 2.75% but the BoC is hesitant to lower in the midst of the uncertainty over the US trade tariffs, which have led to sharp swings in the stock markets.
There are no US events on the calendar and the markets will be all ears as a host of FOMC members make public statements today. Investors will be looking for insights into the Fed's rate path. The Fed is widely expected to hold rates in June and may cut as little as twice in the second half of the year. That could change, depending on inflation, the US labor market and Trump's tariffs.
USD/CAD Technical
- USD/CAD is testing support at 1.3936. Below, there is support at 1.3911
- There is resistance at 1.3952 and 1.3977
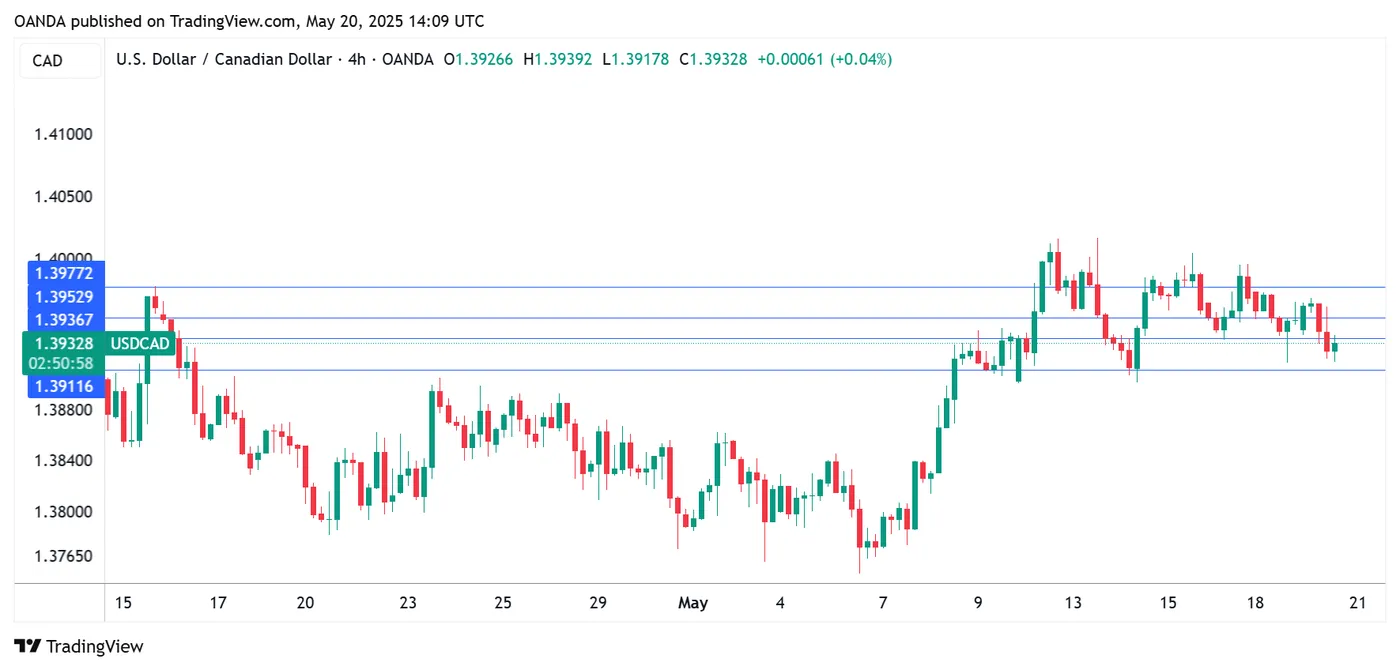
USDCAD 4-Hour Chart, May 20, 2025
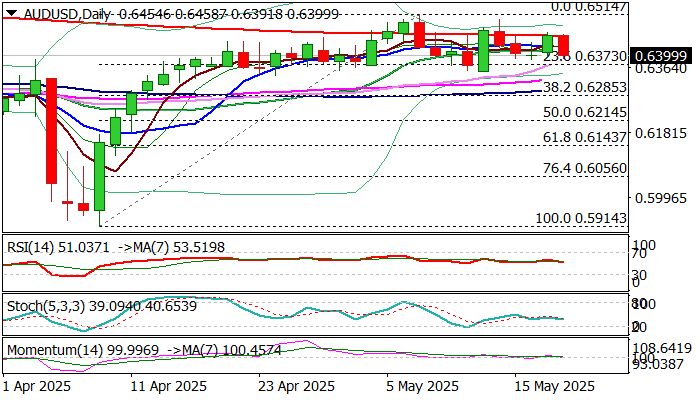
AUD/USD: Drops After RBA Rate Cut But Remains Within Broader Consolidation Range
AUDUSD fell on Tuesday after the Reserve Bank of Australia cut interest rate by 25 basis points, in a widely expected decision.
Fresh weakness has fully reversed Monday advance and heading into the lower part of the recent 0.6350/0.6500 congestion, as the pair holds within a broader range in extended consolidation under new 2025 high (0.6514).
Weaker US dollar continues to fuel its Australian counterpart, which implies that negative impact of RBA’s rate cut on Aussie, might be limited.
Situation on daily chart shows that larger uptrend from 0.5914 (2025 low, posted on Apr 9) is in consolidative phase and expected to remain in play while the price stays above consolidation floor.
Technical picture is still positive overall, although with fading bullish momentum and 200DMA (0.6454) marking significant barrier after several attempts failed to register clear break higher.
Cautious playing within the range is currently preferred scenario, with focus on reaction on key levels – 0.6350 on the downside or 0.6454/0.6500 at the upside, which would provide clearer direction signals.
Res: 0.6454; 0.6500; 0.6514; 0.6550.
Sup: 0.6373; 0.6350; 0.6300; 0.6285.
DAX40 and FTSE100 Outperform the S&P500, Rejecting Economists’ Pessimism
Tariff wars have increased the legitimacy of stimulus measures in Europe and Asia. Since the start of the year, the ECB and Bank of England have been aggressively cutting rates against the Fed’s continued rate hikes. The People’s Bank of China made a small, 0.1 percentage point cut on Tuesday morning. Earlier this year, Germany announced an $800 billion package of support for the economy, abandoning a tight budget framework, contrasting with the mood for budget deficit reduction in the United States.
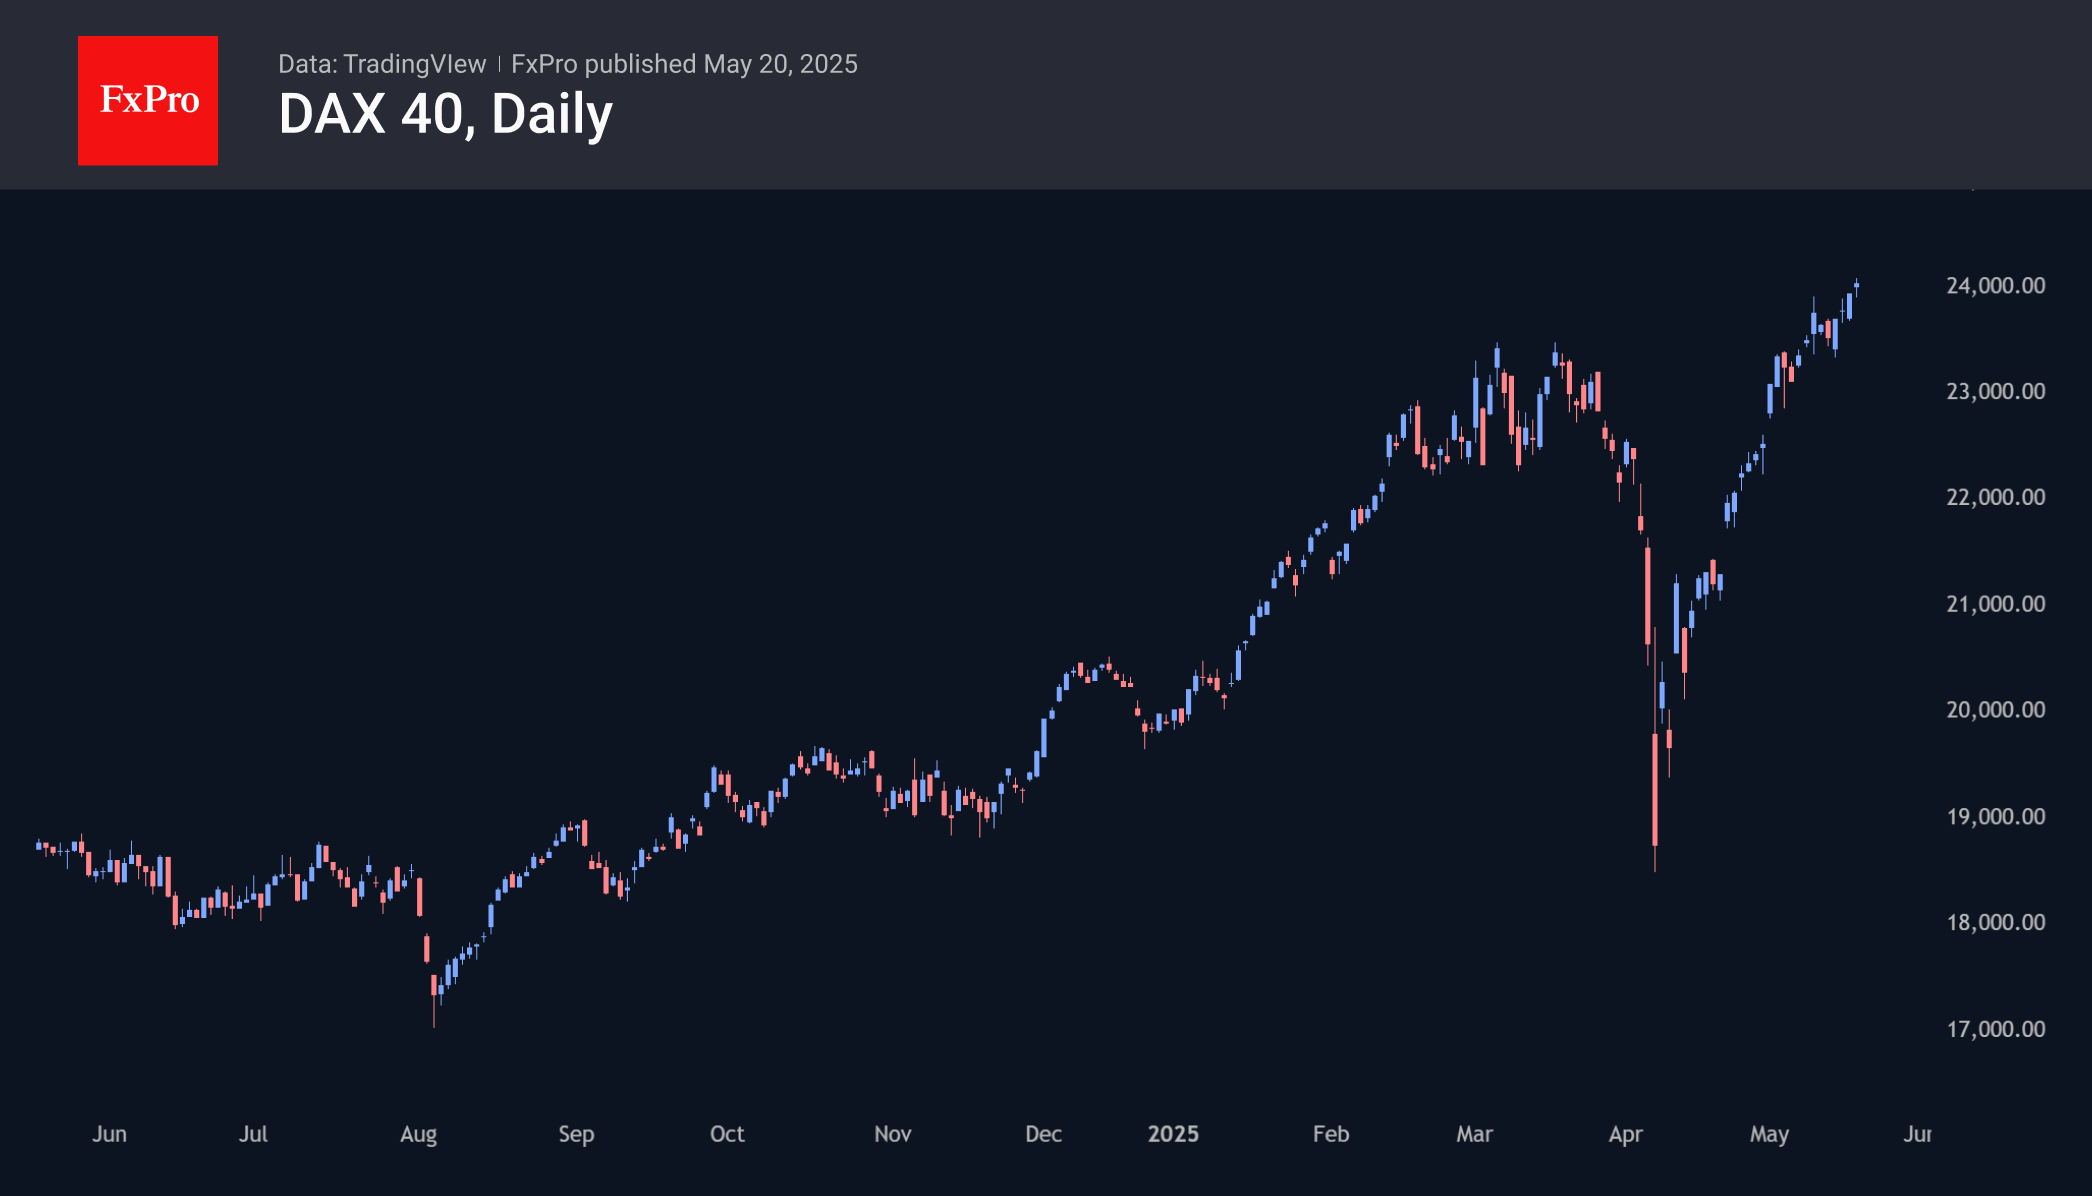
Germany’s DAX40 hit all-time highs on Monday. The German market is feeling the envy of its peers, trading in the 24000 area, nearly 28% above the early April lows. The FTSE100 is less than 2% off its peaks set in early March. This has been achieved, contrary to the more than 8% strengthening of the pound and euro against the dollar since the start of the year and is indicative of the strength of Europe’s markets against the US. This is a higher rate of growth in the case of the DAX and a stronger recovery in the case of the FTSE.
Stimulus measures from Europe and China are working like a rising tide, boosting the overall level of equities. Should the US enter the stimulus race through Fed policy easing, this would spur the S&P 500 and Nasdaq 100 higher, but it would be just as objectively positive for Europe and Asia.
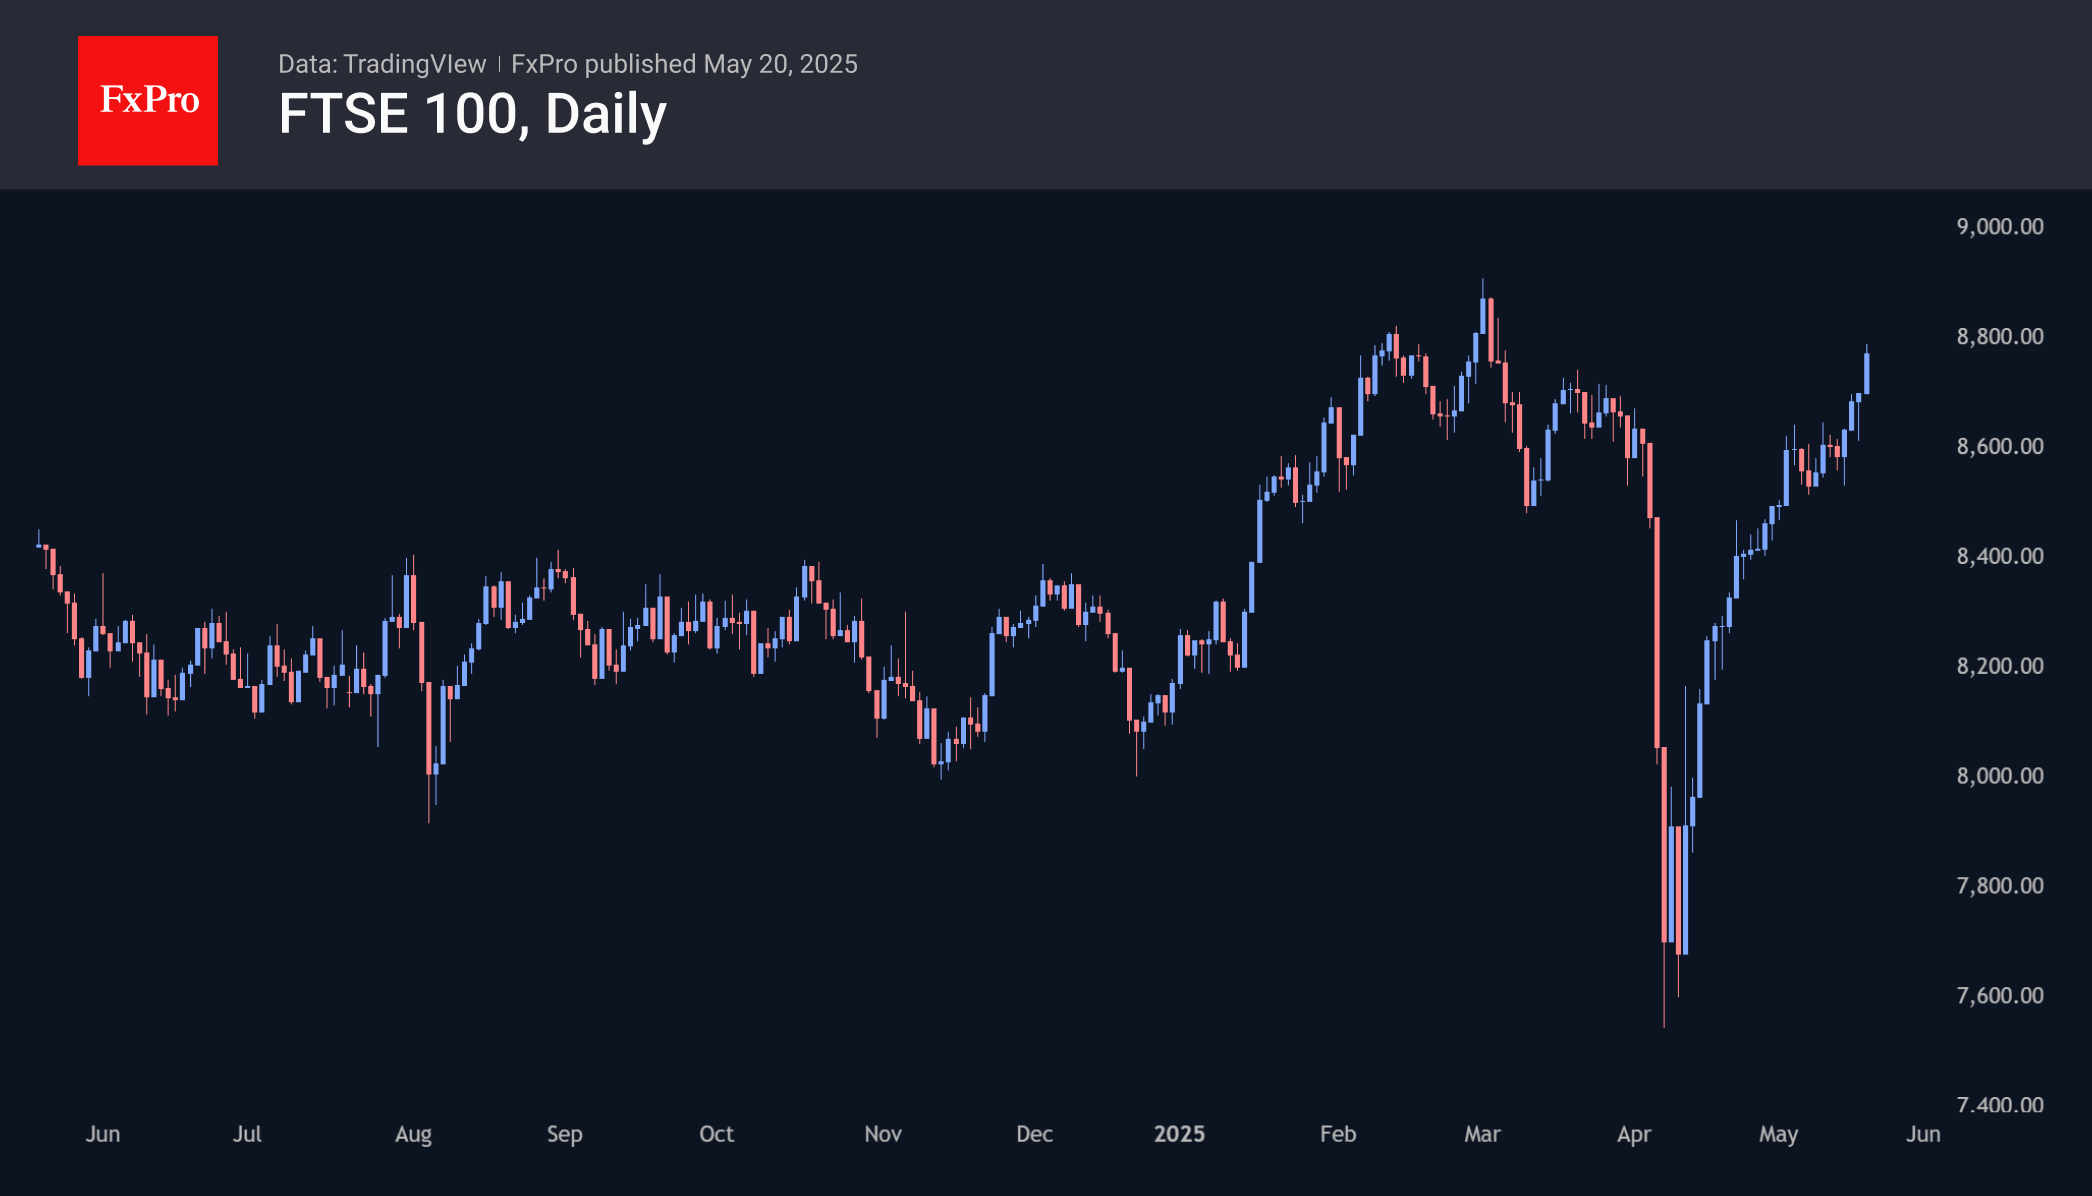
The market dynamics in Germany and the UK starkly contrast with the sentiment and outlook of economists in light of the trade wars. It is not uncommon to see markets one step ahead of the economic consensus, but that makes it no less interesting to see if markets can thrive against forecasters’ pessimism.
Australian Dollar Slides after RBA’s Dovish Rate Cut
The Australian dollar has posted sharp losses on Tuesday, following the Reserve Bank's decision to lower interest rates. Early in the North American session, AUD/USD is trading at 0.6395, down 0.95% on the day.
RBA lowers rates to 3.85%
The Reserve Bank of Australia has lowered its cash rate from 4.15% to 3.85%. The decision was widely expected but the Australian dollar is down sharply as the RBA expressed concern about the impact of tariffs on Australia's economy.
Today's cut was the second this year, as the RBA has been lagging behind other major central banks in lowering rates. Today's decision was driven by two factors. First, core CPI eased to 2.9% in April. This was significant as it marked the first time in two years that underlying inflation has fallen back within the RBA's target range of 1%-3%.
Secondly, the outlook for the global economy has worsened due to the US tariffs and counter-tariffs. President Trump's tariff policy has been erratic, as reflected in the US slapping 145% tariffs on China, only to reduce them to 30% for a 90-day period.
The RBA statement highlighted both of these factors in its decision to lower rates. The statement noted that the outlook for inflation, growth and employment in Australia had been downgraded due to the US tariffs. Governor Michele Bullock bluntly stated that the global situation was "unpredictable" and a "complete rollercoaster".
The RBA will be carefully monitoring Trump's tariff policy, especially with China, as Australia is hugely dependent on its exports sector and further escalations in the global trade war would damage the economy.
There are no US events on the calendar but we'll hear from a host of FOMC members today, which could provide some insights into the Fed's rate path. The Fed is widely expected to hold rates in June and may cut as little as twice in the second half of the year. That could change, depending on inflation, the US labor market and Trump's tariffs.
AUD/USD Technical
- AUD/USD has pushed below support at 0.6440 and 0.6415. Below, there is support at 0.6373
- There is resistance at 0.6482 and 0.6507
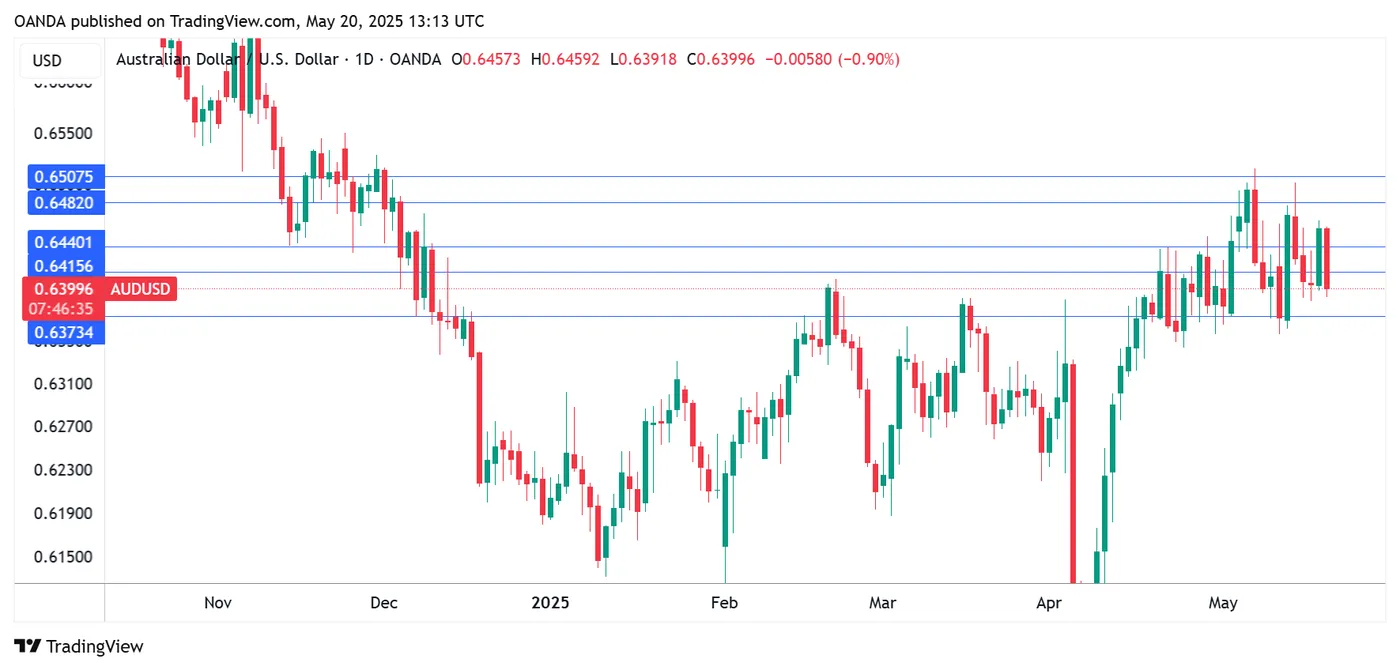
AUD/USD 1-Day Chart, May 20, 2025