
Sample Category Title
EUR/USD Daily Outlook
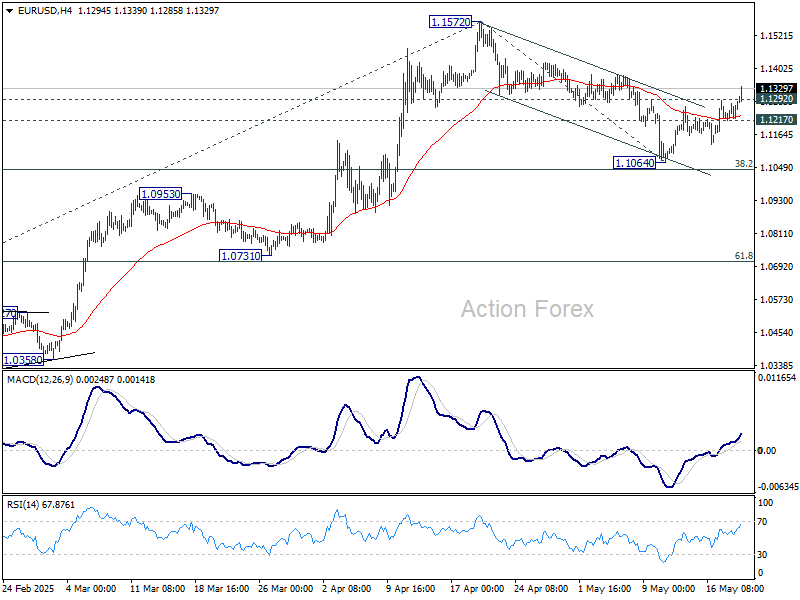
Daily Pivots: (S1) 1.1239; (P) 1.1263; (R1) 1.1307; More...
EUR/USD's break of 1.1292 resistance suggest that correction from 1.1572 has completed at 1.1064 already. Intraday bias is back on the upside for retesting 1.1572 high first. Firm break there will resume larger up trend. Next near term target will be 61.8% projection of 1.0176 to 1.1572 from 1.1064 at 1.1927. On the downside, break of 1.1217 minor support will delay the bullish case and turn intraday bias neutral again.
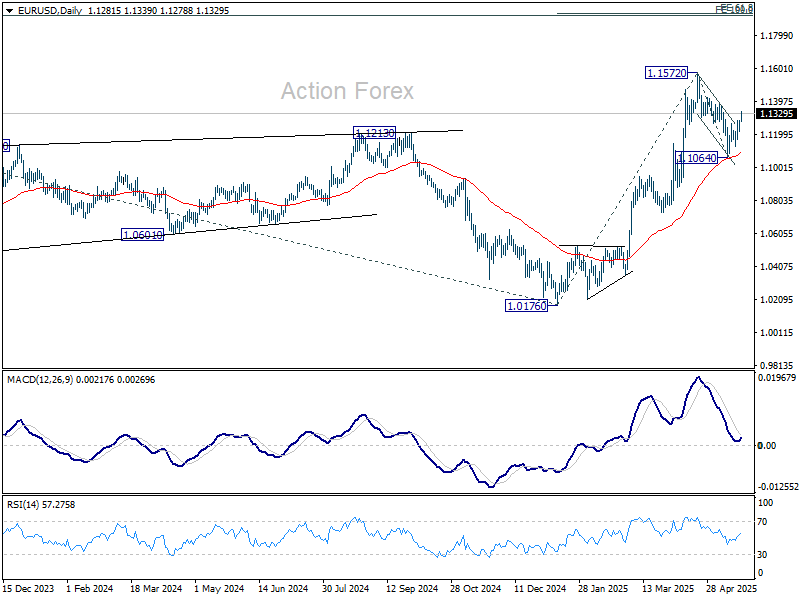
In the bigger picture, rise from 0.9534 long term bottom could be correcting the multi-decade downtrend or the start of a long term up trend. In either case, further rise should be seen to 100% projection of 0.9534 to 1.1274 from 1.0176 at 1.1916. This will now remain the favored case as long as 55 W EMA (now at 1.0818) holds.
GBP/USD Daily Outlook
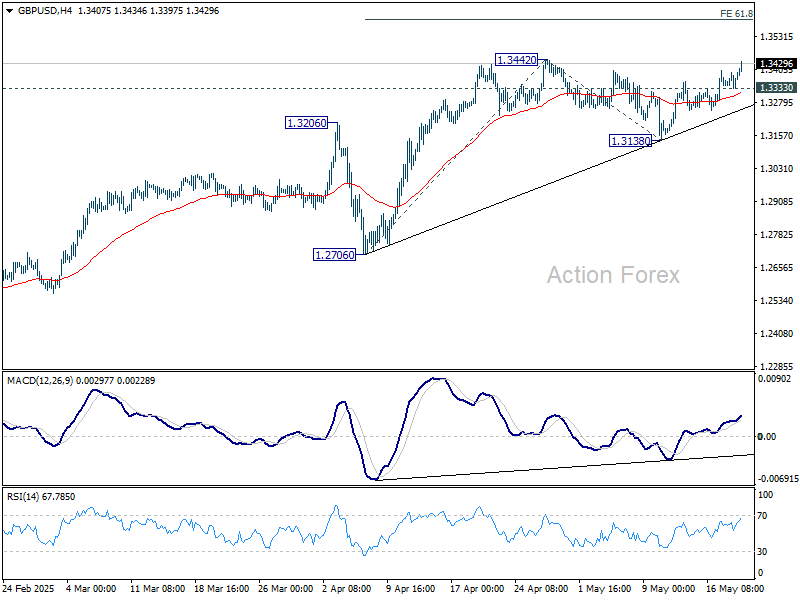
Daily Pivots: (S1) 1.3354; (P) 1.3375; (R1) 1.3414; More...
Intraday bias in GBP/USD remains on the upside. Decisive break of 1.3433/42 key resistance zone will confirm larger up trend resumption. Next near term target will be 61.8% projection of 1.2706 to 1.3442 from 1.3138 at 1.3593, and then 100% projection at 1.1.3874. On the downside, below 1.3333 minor support will delay the bullish case and turn intraday bias neutral first.
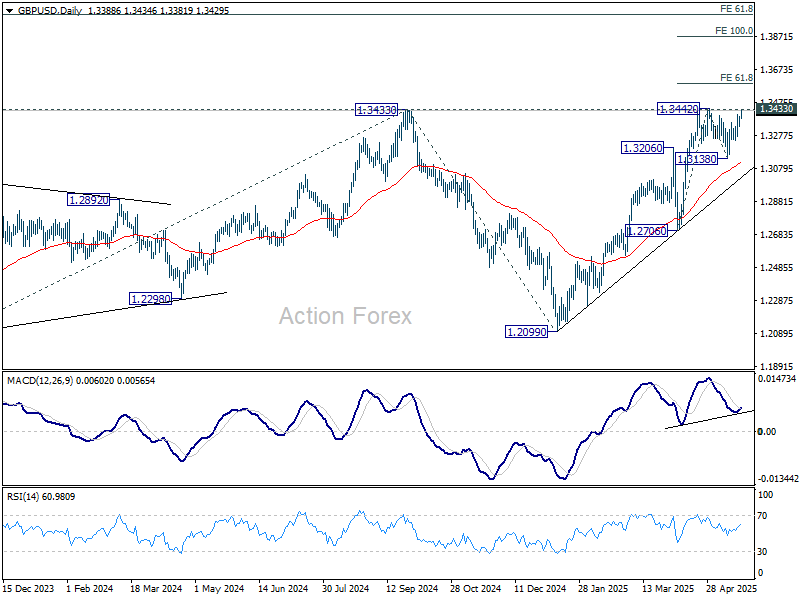
In the bigger picture, up trend from 1.3051 (2022 low) is still in progress. Decisive break of 1.3433 (2024 high) will confirm resumption. Next medium term target is 61.8% projection of 1.0351 to 1.3433 from 1.2099 at 1.4004. Nevertheless, sustained trading below 55 D EMA (now at 1.3124) will delay the bullish case and bring more consolidations first.
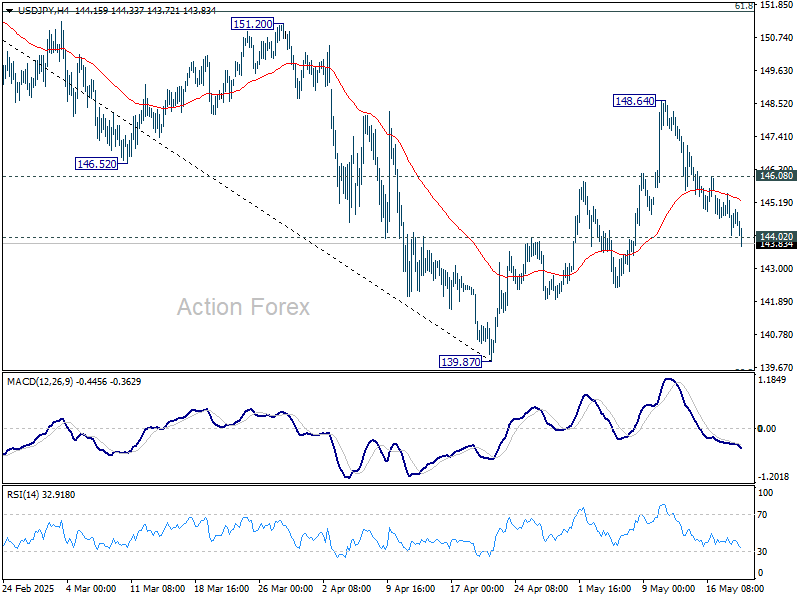
USD/JPY Daily Outlook
Daily Pivots: (S1) 143.89; (P) 144.70; (R1) 145.31; More...
USD/JPY's break of 144.02 support now argues that rebound from 139.87 has completed as a correction to 148.64. Intraday bias is back on the downside for retesting 139.87 support. For now, risk will stay on the downside as long as 146.08 minor resistance holds, in case of recovery.
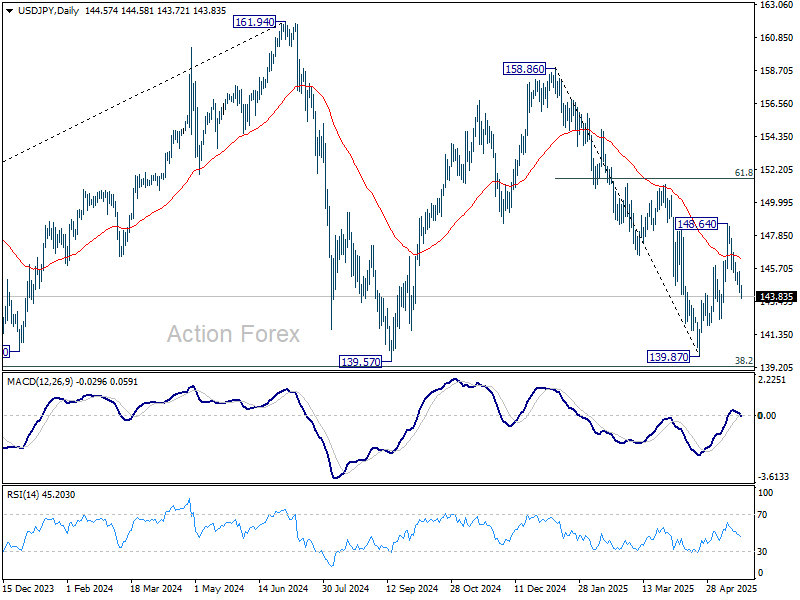
In the bigger picture, price actions from 161.94 are seen as a corrective pattern to rise from 102.58 (2021 low), with fall from 158.86 as the third leg. Strong support should be seen from 38.2% retracement of 102.58 to 161.94 at 139.26 to bring rebound. However, sustained break of 139.26 would open up deeper medium term decline to 61.8% retracement at 125.25.
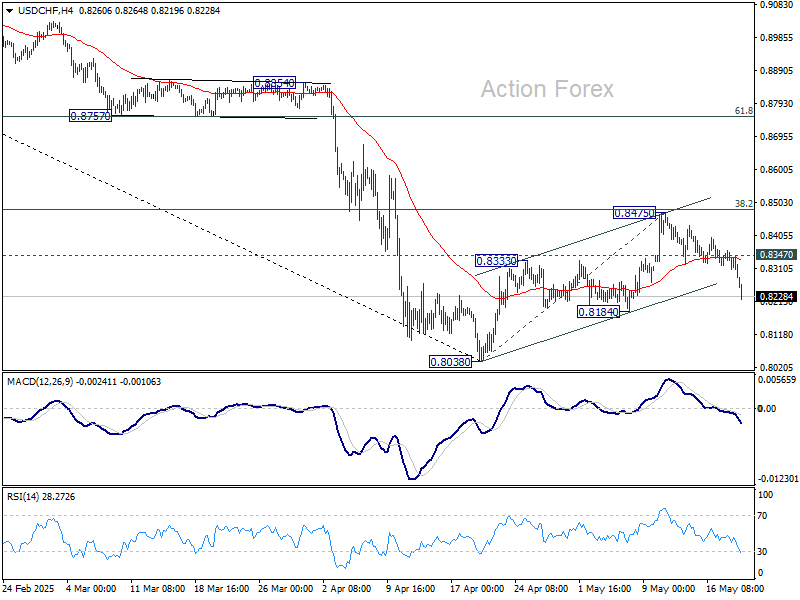
USD/CHF Daily Outlook
Daily Pivots: (S1) 0.8256; (P) 0.8309; (R1) 0.8337; More….
USD/CHF's downside accelerations suggests that corrective recovery from 0.8038 has already completed with three waves up to 0.8475. Intraday bias is back on the downside, and break of 0.8184 support will solidify this bearish case. Further break of 0.8038 will resume larger down trend to 61.8% projection of 0.9200 to 0.8038 from 0.8475 at 0.7757 next. On the upside, above 0.8347 minor resistance will delay the bearish case and turn intraday bias neutral again first.
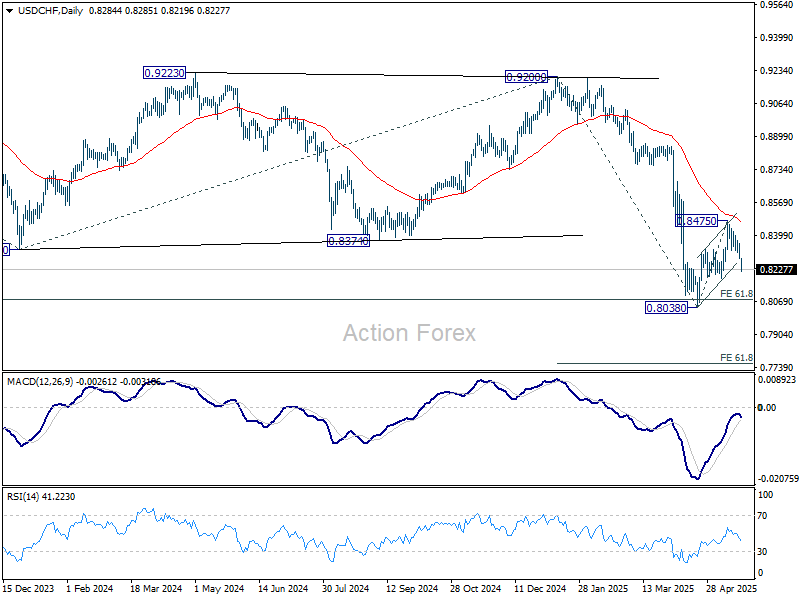
In the bigger picture, long term down trend from 1.0342 (2017 high) is still in progress and met 61.8% projection of 1.0146 (2022 high) to 0.8332 from 0.9200 at 0.8079 already. In any case, outlook will stay bearish as long as 55 W EMA (now at 0.8765) holds. Sustained break of 0.8079 will target 100% projection at 0.7382.
Dollar Selloff Accelerates on Fiscal, Trade, and FX Policy Risks
Dollar came under broad selling pressure in Asian session, with fresh technical signals suggesting that the near-term recovery has already run its course. Also, the selloff appears to be gathering pace on a range of fundamental concerns.
One focus is on Capitol Hill, where the House of Representatives is expected to vote on a multitrillion-dollar spending and tax package backed by US President Donald Trump. The bill is projected by nonpartisan analysts to add US 3 to 5 Trillion to the national debt, further exacerbating fiscal sustainability concerns in the wake of the Moody’s downgrade last Friday.
Simultaneously, ongoing trade negotiations with major partners — including the EU, Japan, and China — have hit apparent roadblocks, reintroducing geopolitical friction into already cautious markets.
Adding to Dollar’s vulnerability is the backdrop of the G7 finance ministers’ meeting underway in Canada. With concerns that US officials may be quietly welcoming a weaker Dollar to cushion trade headwinds and debt concerns, any perceived shift in post-meeting communiqué could further undermine confidence in the greenback.
In the currency markets, risk-off tone is building up. Swiss Franc leads as the strongest performer this week so far, followed by Euro and Yen. The Dollar is the weakest, with Loonie and Aussie close behind. Sterling and Kiwi are hovering in the middle.
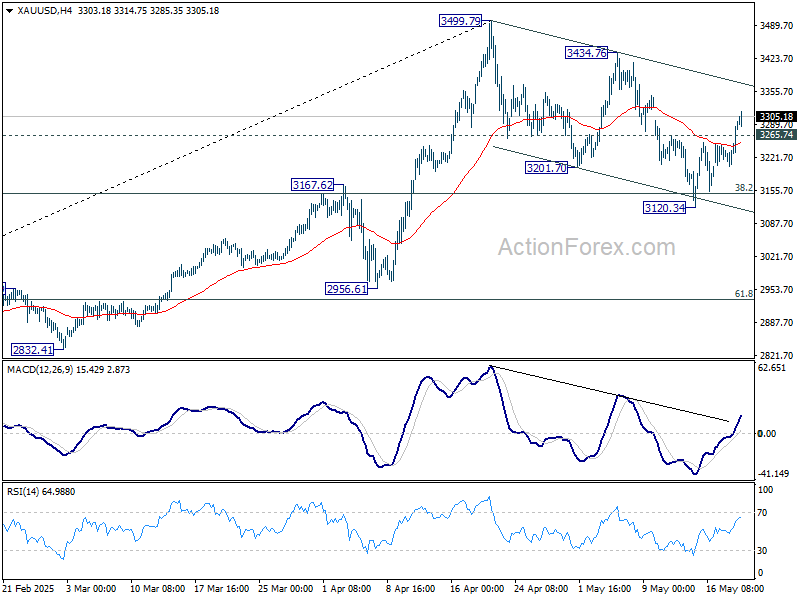
Technically, Gold's rally accelerates along with the selloff in the greenback. The break of 3265.74 resistance solidifies the case that correction from 3499.79 has completed with three waves down to 3120.34. Further rise is expected as long as 55 4H EMA (now at 3215.81) holds. Retest of 3434.76/3499.79 resistance zone should be seen next.
In Asia, at the time of writing, Nikkei is down -0.21%. Hong Kong HSI is up 0.50%. China Shanghai SSE is up 0.39%. Singapore Strait Times is down -0.31%. Japan 10-year JGB yield is up 0.006 at 1.529. Overnight, DOW fell -0.27%. S&P 500 fell -0.39%. NASDAQ fell -0.38%. 10-year yield rose 0.006 to 4.481.
Looking ahead, UK CPI is the main focus in European session. Later in the day, Canada will release new housing price index.
Fed's Musalem warns tariffs still a threat despite US-China truce
St. Louis Fed President Alberto Musalem cautioned that even with the 90-day trade truce between the US and China, the current level of tariffs could still have “significant” short-term effects on the economy.
In a speech overnight, he warned that tariffs are likely to "dampen economic activity" and further weaken the labor market. At the same time, tariffs could raise inflation both directly, through higher import prices, and indirectly, by triggering broader cost increases in domestic goods and services.
Musalem outlined two potential monetary policy responses depending on how persistent the inflationary effects of tariffs prove to be.
If the price impacts are temporary and inflation remains controlled, then it may be appropriate for the Fed to “look through” the short-term inflation spike and consider easing policy to cushion the labor market.
However, if inflation proves stickier and starts to unanchor long-term expectations, Musalem argued that restoring price stability should take precedence, even at the cost of weaker growth and higher unemployment.
“History tells us that restoring price stability is more costly for the public... if inflation expectations are not well anchored,” Musalem said.
Fed's Bostic: Tariff impact to surface as front-running shielding fades
Atlanta Fed President Raphael Bostic warned that the economic effects of recent tariffs may be set to emerge more visibly, as businesses begin to exhaust their earlier stockpiling and "front-running" strategies.
Speaking on the sidelines of a conference, Bostic said that “a lot of the tariff impact to date has actually not shown up in the numbers yet,” but the strategies used to insulate against cost shocks — such as building up inventories — “are starting to run their course.”
As these buffers fade, Bostic expects that changes in prices could follow soon, offering a clearer view of how tariffs will impact both inflation and consumer behavior. “We’re about to see some changes in prices, and then we're going to learn how consumers are going to respond to that,” he noted.
Given the heightened uncertainty, Bostic maintained a cautious tone on policy. “We should wait and see where the economy is going before we do anything definitive,” he said.
Japan’s US-bound exports fall -1.8% yoy as tariffs and strong Yen Bite
.Japan’s export growth slowed to just 2.0% yoy in April, marking the weakest pace since October 2024.
Notably, shipments to the US fell -1.8% yoy — the first decline in four months — as demand for automobiles, steel, and ships weakened. Exports of automobiles alone dropped -4.8% yoy by value, impacted by a stronger Yen and reduced demand for high-end models.
The decline coincides with the imposition of 25% US tariffs on Japanese auto, steel, and aluminum exports, alongside the 10% blanket levy applied to most trade partners under the current US trade regime.
Trade with Asia remained more resilient, with exports rising 6.0% yoy. However, shipments to China dipped -0.6% yoy.
On the import side, Japan saw a -2.2% yoy contraction, resulting in a trade deficit of JPY -115.8B.
Seasonally adjusted figures show a -2.7% mom drop in exports and a -1.4% mom drop in imports, with the adjusted trade deficit widening to JPY -409B.
Australia’s leading index falls to 0.2%, growth pulse fades
Australia’s Westpac Leading Index slowed from 0.5% to 0.2% in April, signaling a loss in growth momentum.
According to Westpac, the above-trend growth seen earlier this year has "all but disappeared," primarily due to rising global trade uncertainty and weaker commodity prices.
While these external pressures dominate, domestic factors such as a slowing labor market and only modest support from interest rate cuts are also contributing to the loss of momentum.
The overall picture suggests a stalling in the already tepid recovery, with GDP growth expected to reach just 1.9% by the end of 2025, well below historical averages.
Following RBA's recent 25bps rate cut to 3.85%, Westpac expects a cautious pause at the next policy meeting on July 7–8. The central bank is likely to await further clarity from the Q2 inflation data due at the end of July before considering additional easing.
USD/CHF Daily Outlook
Daily Pivots: (S1) 0.8256; (P) 0.8309; (R1) 0.8337; More….
USD/CHF's downside accelerations suggests that corrective recovery from 0.8038 has already completed with three waves up to 0.8475. Intraday bias is back on the downside, and break of 0.8184 support will solidify this bearish case. Further break of 0.8038 will resume larger down trend to 61.8% projection of 0.9200 to 0.8038 from 0.8475 at 0.7757 next. On the upside, above 0.8347 minor resistance will delay the bearish case and turn intraday bias neutral again first.
In the bigger picture, long term down trend from 1.0342 (2017 high) is still in progress and met 61.8% projection of 1.0146 (2022 high) to 0.8332 from 0.9200 at 0.8079 already. In any case, outlook will stay bearish as long as 55 W EMA (now at 0.8765) holds. Sustained break of 0.8079 will target 100% projection at 0.7382.
Australia’s leading index falls to 0.2%, growth pulse fades
Australia’s Westpac Leading Index slowed from 0.5% to 0.2% in April, signaling a loss in growth momentum.
According to Westpac, the above-trend growth seen earlier this year has "all but disappeared," primarily due to rising global trade uncertainty and weaker commodity prices.
While these external pressures dominate, domestic factors such as a slowing labor market and only modest support from interest rate cuts are also contributing to the loss of momentum.
The overall picture suggests a stalling in the already tepid recovery, with GDP growth expected to reach just 1.9% by the end of 2025, well below historical averages.
Following RBA's recent 25bps rate cut to 3.85%, Westpac expects a cautious pause at the next policy meeting on July 7–8. The central bank is likely to await further clarity from the Q2 inflation data due at the end of July before considering additional easing.
Japan’s US-bound exports fall -1.8% yoy as tariffs and strong Yen Bite
.Japan’s export growth slowed to just 2.0% yoy in April, marking the weakest pace since October 2024.
Notably, shipments to the US fell -1.8% yoy — the first decline in four months — as demand for automobiles, steel, and ships weakened. Exports of automobiles alone dropped -4.8% yoy by value, impacted by a stronger Yen and reduced demand for high-end models.
The decline coincides with the imposition of 25% US tariffs on Japanese auto, steel, and aluminum exports, alongside the 10% blanket levy applied to most trade partners under the current US trade regime.
Trade with Asia remained more resilient, with exports rising 6.0% yoy. However, shipments to China dipped -0.6% yoy.
On the import side, Japan saw a -2.2% yoy contraction, resulting in a trade deficit of JPY -115.8B.
Seasonally adjusted figures show a -2.7% mom drop in exports and a -1.4% mom drop in imports, with the adjusted trade deficit widening to JPY -409B.
Fed’s Bostic: Tariff impact to surface as front-running shielding fades
Atlanta Fed President Raphael Bostic warned that the economic effects of recent tariffs may be set to emerge more visibly, as businesses begin to exhaust their earlier stockpiling and "front-running" strategies.
Speaking on the sidelines of a conference, Bostic said that “a lot of the tariff impact to date has actually not shown up in the numbers yet,” but the strategies used to insulate against cost shocks — such as building up inventories — “are starting to run their course.”
As these buffers fade, Bostic expects that changes in prices could follow soon, offering a clearer view of how tariffs will impact both inflation and consumer behavior. “We’re about to see some changes in prices, and then we're going to learn how consumers are going to respond to that,” he noted.
Given the heightened uncertainty, Bostic maintained a cautious tone on policy. “We should wait and see where the economy is going before we do anything definitive,” he said.
Fed’s Musalem warns tariffs still a threat despite US-China truce
St. Louis Fed President Alberto Musalem cautioned that even with the 90-day trade truce between the US and China, the current level of tariffs could still have “significant” short-term effects on the economy.
In a speech overnight, he warned that tariffs are likely to "dampen economic activity" and further weaken the labor market. At the same time, tariffs could raise inflation both directly, through higher import prices, and indirectly, by triggering broader cost increases in domestic goods and services.
Musalem outlined two potential monetary policy responses depending on how persistent the inflationary effects of tariffs prove to be.
If the price impacts are temporary and inflation remains controlled, then it may be appropriate for the Fed to “look through” the short-term inflation spike and consider easing policy to cushion the labor market.
However, if inflation proves stickier and starts to unanchor long-term expectations, Musalem argued that restoring price stability should take precedence, even at the cost of weaker growth and higher unemployment.
“History tells us that restoring price stability is more costly for the public... if inflation expectations are not well anchored,” Musalem said.
Gold Eyes New Upside — Fresh Increase on the Horizon?
Key Highlights
- Gold found support near $3,120 and started a fresh increase.
- It cleared a key bearish trend line with resistance at $3,220 on the 4-hour chart.
- EUR/USD is moving higher above the 1.1250 resistance zone.
- WTI Crude Oil prices recovered and climbed above the $63.00 level.
Gold Price Technical Analysis
Gold prices remained supported above $3,120. The price formed a base and started a fresh increase above the $3,180 and $3,200 resistance levels.
The 4-hour chart of XAU/USD indicates that the price cleared a key bearish trend line with resistance at $3,220. There was a clear move above the 50% Fib retracement level of the downward move from the $3,437 swing high to the $3,120 low.
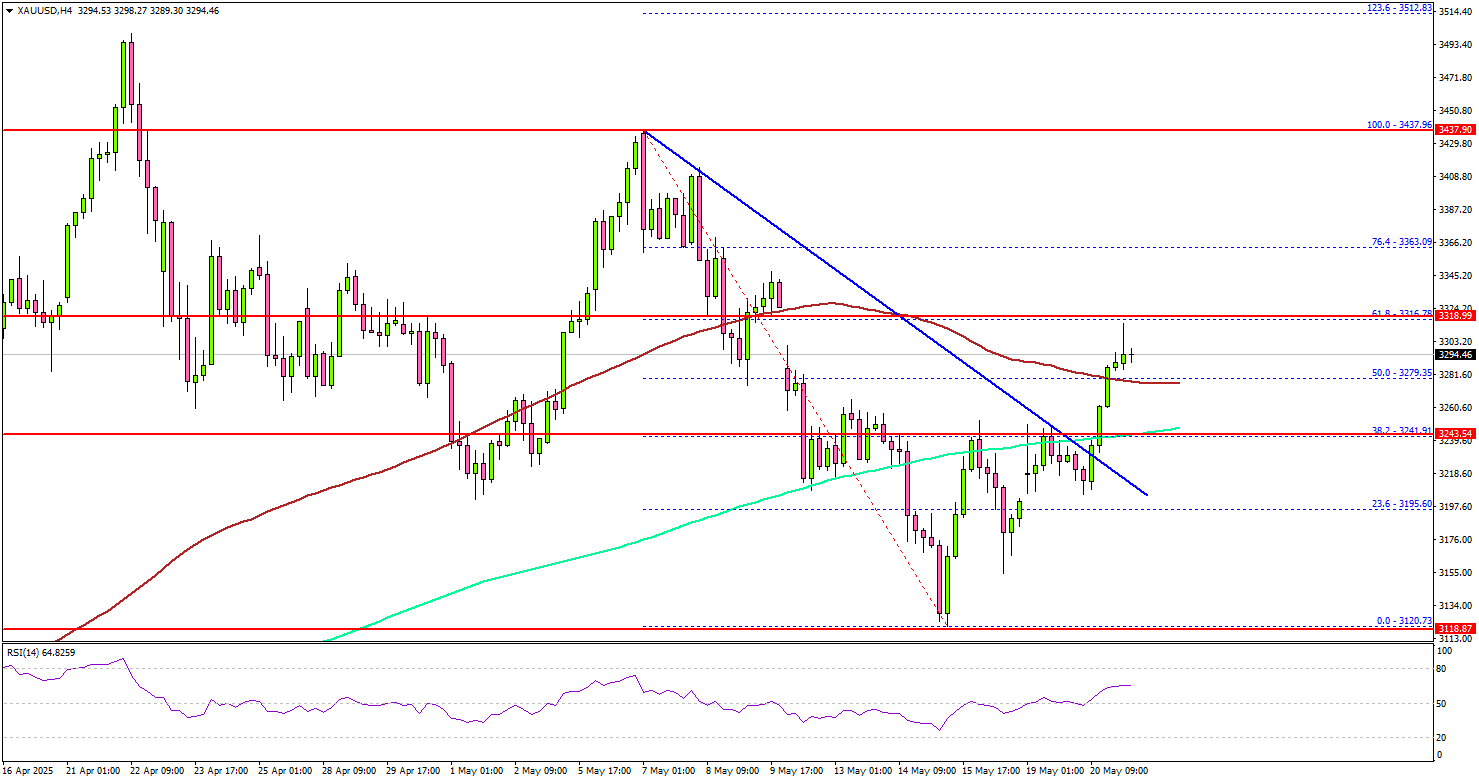
The price settled above the $3,270 level, the 200 Simple Moving Average (green, 4 hours), and the 100 Simple Moving Average (red, 4 hours). On the upside, immediate resistance is near the $3,315 level and the 61.8% Fib retracement level of the downward move from the $3,437 swing high to the $3,120 low.
The next major resistance sits near the $3,365 level. A clear move above the $3,365 resistance could open the doors for more upsides. The next major resistance could be $3,380, above which the price could rally toward the milestone level of $3,400.
On the downside, initial support is near the $3,280 level. The first key support is near $3,250. The next major support is near the $3,240 level. The main support is now $3,220. A downside break below the $3,220 support might call for more downsides. The next major support is near the $3,150 level.
Looking at EUR/USD, the pair started a decent upward move and might soon aim for a fresh increase if it clears the 1.1320 resistance.
Economic Releases to Watch Today
- ECB's Lane speech.
- Fed's Barkin speech.