
Sample Category Title
USD/CHF Daily Outlook
Daily Pivots: (S1) 0.8211; (P) 0.8251; (R1) 0.8251; More….
Intraday bias in USD/CHF remains on the downside at this point. Break of 0.8184 support will solidify the case that correction from 0.8038 has completed at 0.8475. Further break of 0.8038 will resume larger down trend to 61.8% projection of 0.9200 to 0.8038 from 0.8475 at 0.7757 next. On the upside, above 0.8347 minor resistance will delay the bearish case and turn intraday bias neutral again first.
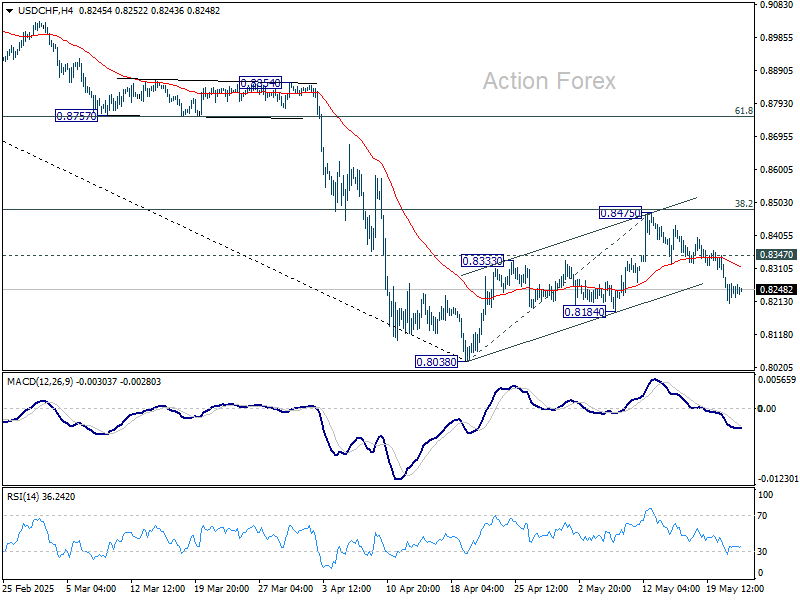
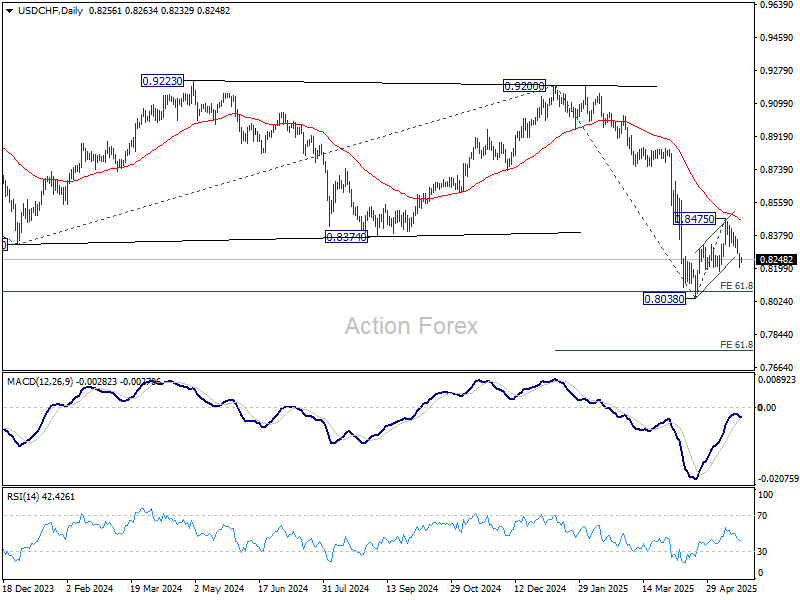
In the bigger picture, long term down trend from 1.0342 (2017 high) is still in progress and met 61.8% projection of 1.0146 (2022 high) to 0.8332 from 0.9200 at 0.8079 already. In any case, outlook will stay bearish as long as 55 W EMA (now at 0.8765) holds. Sustained break of 0.8079 will target 100% projection at 0.7382.
GBP/USD Daily Outlook
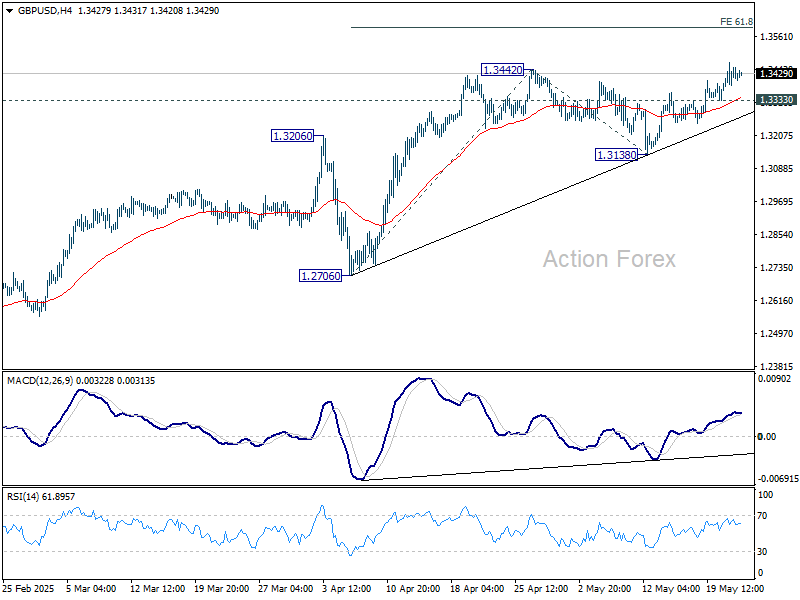
Daily Pivots: (S1) 1.3371; (P) 1.3420; (R1) 1.3469; More...
Intraday bias in GBP/USD remains on the upside at this point. Decisive break of 1.3433/42 key resistance zone will confirm larger up trend resumption. Next near term target will be 61.8% projection of 1.2706 to 1.3442 from 1.3138 at 1.3593, and then 100% projection at 1.1.3874. On the downside, below 1.3333 minor support will delay the bullish case and turn intraday bias neutral first.
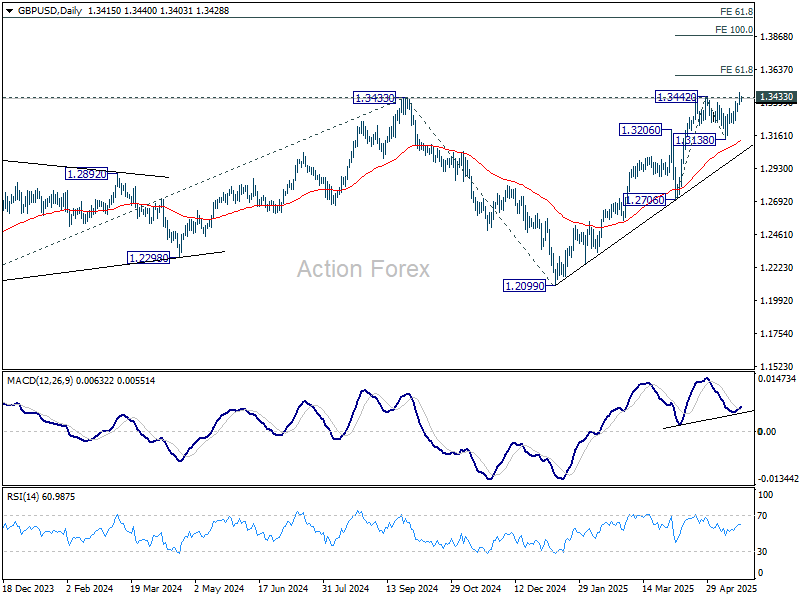
In the bigger picture, up trend from 1.3051 (2022 low) is still in progress. Decisive break of 1.3433 (2024 high) will confirm resumption. Next medium term target is 61.8% projection of 1.0351 to 1.3433 from 1.2099 at 1.4004. Nevertheless, sustained trading below 55 D EMA (now at 1.3124) will delay the bullish case and bring more consolidations first.
EUR/USD Daily Outlook
Daily Pivots: (S1) 1.1286; (P) 1.1324; (R1) 1.1369; More...
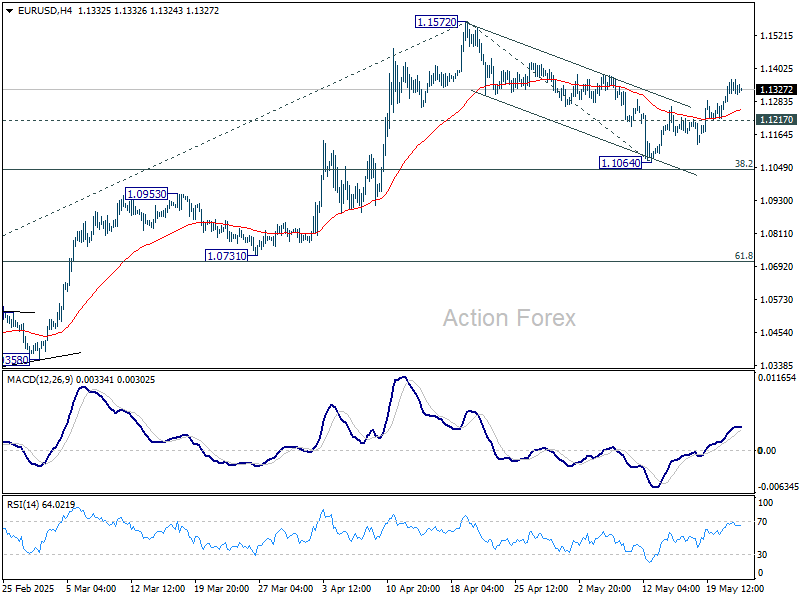
EUR/USD's rally from 1.1064 is in progress and intraday bias stays on the upside. Correction from 1.1572 could have completed at 1.1064 already. Further rise should be seen to retest 1.1572 high first. Firm break there will resume larger up trend. Next near term target will be 61.8% projection of 1.0176 to 1.1572 from 1.1064 at 1.1927. On the downside, break of 1.1217 minor support will delay the bullish case and turn intraday bias neutral again.
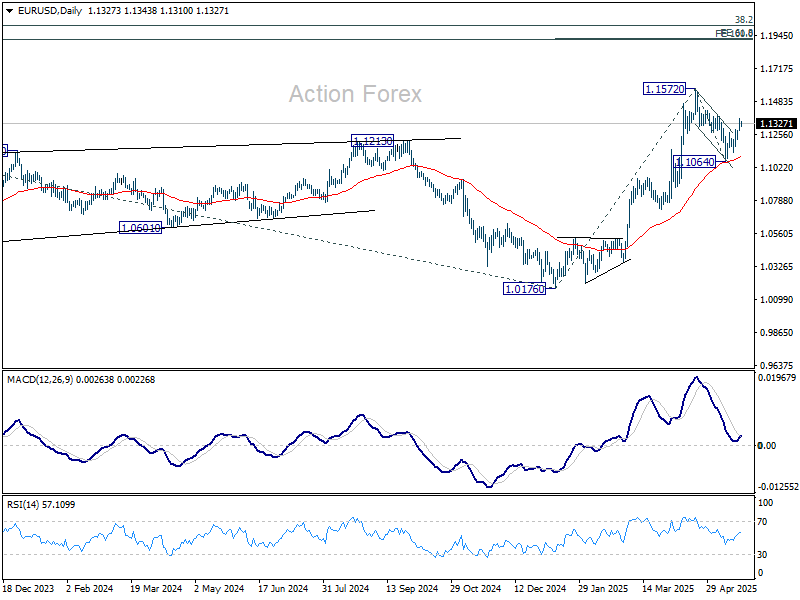
In the bigger picture, rise from 0.9534 long term bottom could be correcting the multi-decade downtrend or the start of a long term up trend. In either case, further rise should be seen to 100% projection of 0.9534 to 1.1274 from 1.0176 at 1.1916. This will now remain the favored case as long as 55 W EMA (now at 1.0818) holds.
US Deficit Jitters Roil Markets as Yields Surge, Dollar Sinks, Bitcoin Hits Record
The dominant driver in global markets at the moment is rising concern over the US fiscal deficit. 30-year yield surged toward 5.1% overnight, its highest level since October 2023. 10-year yield also breached the 4.6% mark for the first time in months. Equity markets responded accordingly, with major US indexes closing sharply lower. Gold has broken above 3330, supported additionally by geopolitical uncertainty. Bitcoin hit a new all-time high. Both reflected risk-hedging demand and a search for alternatives.
In the currency markets, Dollar is suffering, now the worst performer among majors for the week. Meanwhile, commodity currencies like Aussie, Kiwi, and Loonie are struggling near the bottom of the FX board, a reflection of broader risk aversion. Yen leads the pack, joined by Swiss Franc and Euro, as investors seek safety outside the US. Sterling is trading in the middle.
This spike in long-dated yields has sent a clear signal: investors are becoming increasingly uneasy about the US's worsening debt profile and its implications for long-term stability. A poorly received 20-year bond auction only amplified these fears, fueling speculation that appetite for US debt is waning just as supply pressures are set to increase.
On the trade front, tensions remain high. Japan’s Finance Minister Katsunobu Kato labeled recent US tariffs as “regrettable” and reiterated Tokyo's position that no trade deal would be worthwhile unless automobile duties are scrapped. At the G7 meeting in Banff, Kato and US Treasury Secretary Scott Bessent agreed that the dollar-yen exchange rate should reflect market fundamentals. However, the lack of concrete progress raises doubts over any near-term breakthrough in US-Japan trade talks.
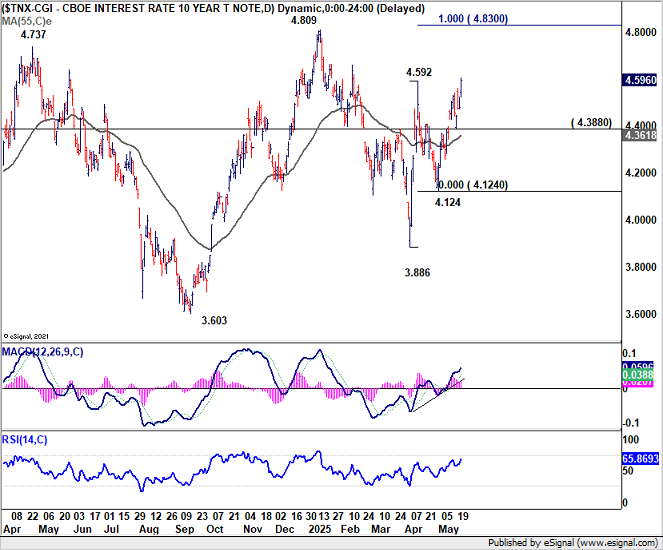
Technically, US 10-year yield's break of 4.592 resistance confirms resumption of whole rally from 3.886. Near term outlook will stay bullish as long as 4.388 support holds. Further rally should be seen to 100% projection of 3.886 to 4.592 from 4.124 at 4.830. Further selloff in US treasuries could keep US stocks and Dollar pressured.
In Asia, at the time of writing, Nikkei is down -0.94%. Hong Kong HSI is down -1.05%. China Shanghai SSE is down -0.13%. Singapore Strait Times is down -0.42%. Japan 10-year JGB yield is up 0.031 at 1.552. Overnight, DOW fell -1.91%. S&P 500 fell -1.61%. NASDAQ fell -1.41%. 10-year yield rose 0.115 to 4.596.
Looking ahead, Eurozone PMI flash, Germany Ifo business climate, and UK PMI flash will be the main focus in European session. ECB will also release monetary policy meeting accounts. Later in the day, US jobless claims and PMI flash will be the main feature.
BoJ's Noguchi: Must tread carefully with step-by-step policy normalization
BoJ board member Asahi Noguchi emphasized the importance of a "measured, step-by-step" pace in raising interest rates, stressing the need to carefully assess the economic impact of each hike before proceeding further.
Noguchi also addressed the upcoming interim review of BoJ’s bond tapering strategy, indicating that he sees no need for any major adjustments to the current plan, which runs through March 2026.
He noted that the central bank should approach its long-term reduction in the balance sheet with flexibility, taking the time needed to ensure stability while maintaining the capacity to respond to "sudden market swings".
Any emergency increase in bond purchases, he noted, would be strictly conditional and "only be implemented during times of severe market disruption."
Japan’s PMI composite falls to 49.8, private sector contracts again
Japan’s private sector activity fell back into contraction in May, with PMI Composite declining from 51.2 to 49.8. Manufacturing output edged higher from 48.7 to 49.0, but remained below the neutral 50 mark. The services sector, however, lost more momentum, with its PMI falling from 52.4 to 50.8.
The decline in composite output reflects weakening domestic and external demand, as new business volumes fell for the first time in nearly a year.
S&P Global’s Annabel Fiddes noted that elevated uncertainty around trade policy and foreign demand weighed heavily on business confidence, which sank to its second-lowest level since the pandemic's onset.
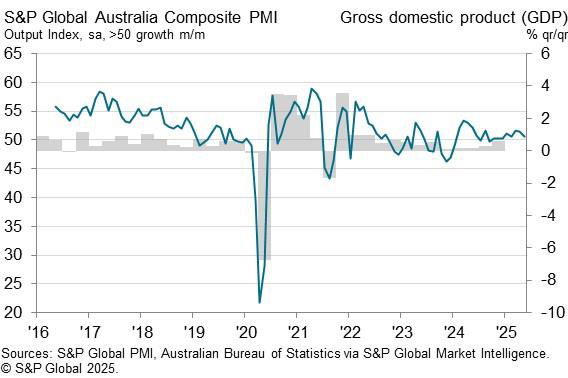
Australia’s PMI Composite slips to 50.6; firms cite election drag on demand
Australia’s private sector showed signs of slowing in May, with PMI Composite falling from 51.0 to a 3-month low of 50.6. Manufacturing index held steady at 51.7. But services weakened from 51.0 to 50.5, its lowest level in six months.
According to S&P Global’s Andrew Harker, the sluggishness may be tied in part to election-related uncertainty, which "contributed to slower growth of new orders". Still, firms remained cautiously optimistic, continuing to hire at a "solid pace". With the political noise expected to ease, attention will turn to whether demand picks up in the months ahead.
EUR/USD Daily Outlook
Daily Pivots: (S1) 1.1286; (P) 1.1324; (R1) 1.1369; More...
EUR/USD's rally from 1.1064 is in progress and intraday bias stays on the upside. Correction from 1.1572 could have completed at 1.1064 already. Further rise should be seen to retest 1.1572 high first. Firm break there will resume larger up trend. Next near term target will be 61.8% projection of 1.0176 to 1.1572 from 1.1064 at 1.1927. On the downside, break of 1.1217 minor support will delay the bullish case and turn intraday bias neutral again.
In the bigger picture, rise from 0.9534 long term bottom could be correcting the multi-decade downtrend or the start of a long term up trend. In either case, further rise should be seen to 100% projection of 0.9534 to 1.1274 from 1.0176 at 1.1916. This will now remain the favored case as long as 55 W EMA (now at 1.0818) holds.
BoJ’s Noguchi: Must tread carefully with step-by-step policy normalization
BoJ board member Asahi Noguchi emphasized the importance of a "measured, step-by-step" pace in raising interest rates, stressing the need to carefully assess the economic impact of each hike before proceeding further.
Noguchi also addressed the upcoming interim review of BoJ’s bond tapering strategy, indicating that he sees no need for any major adjustments to the current plan, which runs through March 2026.
He noted that the central bank should approach its long-term reduction in the balance sheet with flexibility, taking the time needed to ensure stability while maintaining the capacity to respond to "sudden market swings".
Any emergency increase in bond purchases, he noted, would be strictly conditional and "only be implemented during times of severe market disruption."
Japan’s PMI composite falls to 49.8, private sector contracts again
Japan’s private sector activity fell back into contraction in May, with PMI Composite declining from 51.2 to 49.8. Manufacturing output edged higher from 48.7 to 49.0, but remained below the neutral 50 mark. The services sector, however, lost more momentum, with its PMI falling from 52.4 to 50.8.
The decline in composite output reflects weakening domestic and external demand, as new business volumes fell for the first time in nearly a year.
S&P Global’s Annabel Fiddes noted that elevated uncertainty around trade policy and foreign demand weighed heavily on business confidence, which sank to its second-lowest level since the pandemic's onset.
Australia’s PMI Composite slips to 50.6; firms cite election drag on demand
Australia’s private sector showed signs of slowing in May, with PMI Composite falling from 51.0 to a 3-month low of 50.6. Manufacturing index held steady at 51.7. But services weakened from 51.0 to 50.5, its lowest level in six months.
According to S&P Global’s Andrew Harker, the sluggishness may be tied in part to election-related uncertainty, which "contributed to slower growth of new orders". Still, firms remained cautiously optimistic, continuing to hire at a "solid pace". With the political noise expected to ease, attention will turn to whether demand picks up in the months ahead.
WTI Crude Oil Stalls — Pullbacks Likely to Find Strong Support
Key Highlights
- WTI Crude Oil prices started a decent increase above the $61.50 level.
- A key rising channel is forming with support at $61.40 on the 4-hour chart.
- Gold prices managed to climb above the $3,240 resistance.
- EUR/USD is recovering and might aim for a move above the 1.1380 resistance zone.
WTI Crude Oil Price Technical Analysis
WTI Crude Oil price found support at $58.50 and recovered against the US Dollar. There was a move above the $60.00 and $60.50 resistance levels.
Looking at the 4-hour chart of XTI/USD, the price settled above the $61.20 level, the 100 simple moving average (red, 4-hour), and the 200 simple moving average (green, 4-hour).
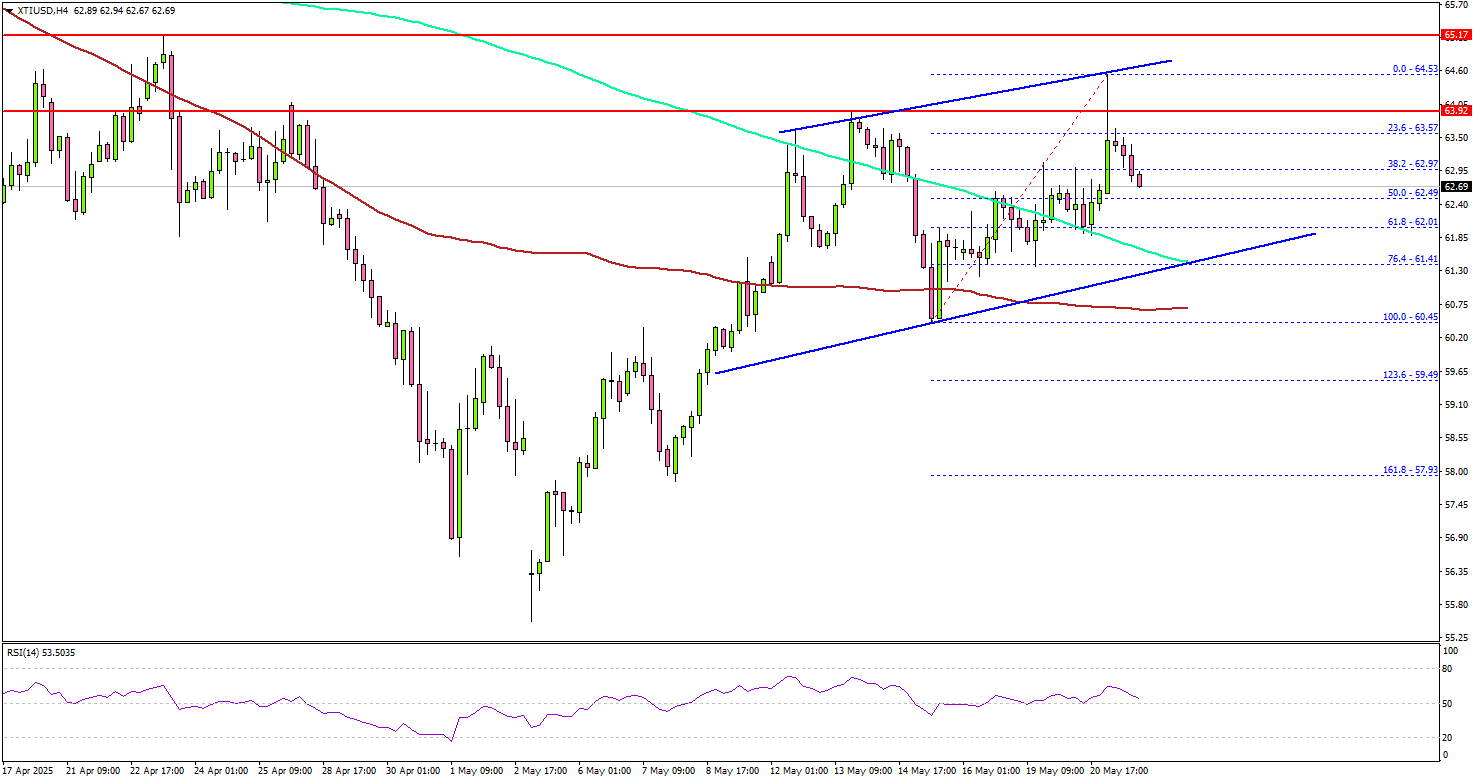
The bulls even pushed the price above $64.00 before the bears appeared. It seems like the price struggled near the $64.50 resistance zone. There was a pullback below the 38.2% Fib retracement level of the upward move from the $60.45 swing low to the $64.53 high.
On the downside, the first major support sits near the $61.40 zone. There is also a key rising channel forming with support at $61.40 on the same chart.
A daily close below $61.40 could open the doors for a larger decline. The next major support is $60.50 and the 100 simple moving average (red, 4-hour). Any more losses might send oil prices toward $58.00 in the coming days.
On the upside, the price is facing hurdles near the $64.00 level. The first key resistance sits near the $64.50 level. The main hurdle is now near the $65.00 zone, above which the price may perhaps accelerate higher. In the stated case, it could even visit the $66.50 resistance. Any more gains might call for a test of the $68.00 resistance zone in the near term.
Looking at Gold, there was a fresh increase above $3,240, but the bears might remain active near the $3,350 level.
Economic Releases to Watch Today
- US Initial Jobless Claims - Forecast 230K, versus 229K previous.
- US Existing Home Sales for April 2025 (MoM) - Forecast +0.1%, versus -5.9% previous.
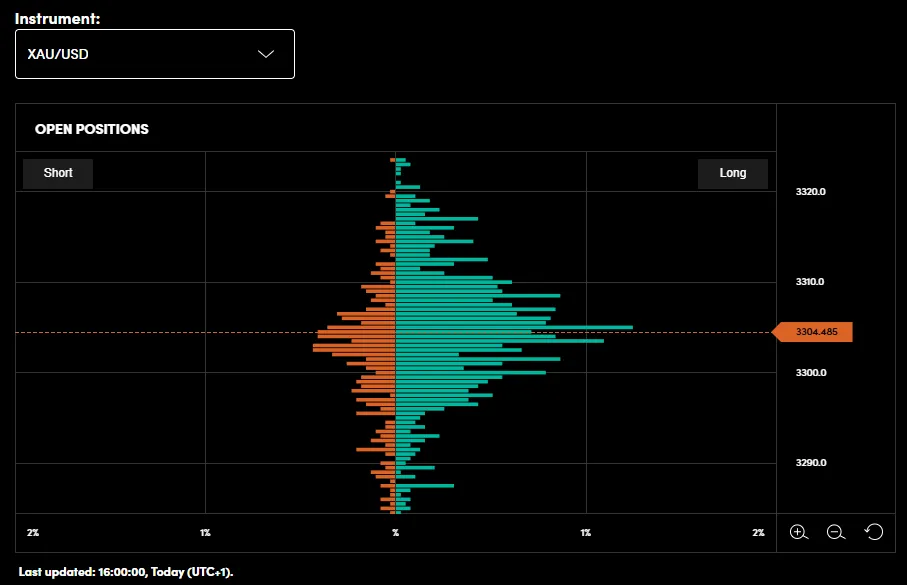
Gold Price Analysis: Will XAU/USD Hold $3300 Support?
- Gold (XAU/USD) is testing the $3300 support level amid US Dollar weakness and geopolitical tensions.
- OANDA's position book indicates many buy orders around $3300-3310, suggesting market participants are expecting further gains.
- Lack of High-Impact US Data weighs on the USD and Aids Gold.
Gold prices have reclaimed the $3300/oz handle but there are growing signs of exhaustion as the precious metal looks to consolidate gains.
The rally has been spurred on by US Dollar weakness while haven demand returned overnight as Israel-Iran tensions escalated.
US Tax Bill Uncertainty
The Republicans negotiated through the night on Wednesday over a bill that’s expected to include compromises on the state and local tax deduction and spending cuts. House Speaker Johnson announced this morning that they came to a $40,000 SALT deduction cap agreement. This uncertainty did add to Gold's appeal yesterday and aided haven demand.
Renewed Haven Demand Spurs on Rally
Israel is preparing a possible strike on Iranian nuclear facilities, multiple U.S. officials told CNN in a Tuesday report. Haven demand benefitted overnight as concerns rose over a potential wider conflict in the Middle East as a result.
Tensions appear to be on a knife edge following the report, as negotiations between the US and Israel rumble on. Officials told CNN that it’s not yet certain whether or not Israel will decide to ultimately act on its plans, adding that Israeli leaders are likely watching for how the U.S.-Iran deal evolves. The National Security Council, the Israeli Prime Minister’s office, and the Israeli Embassy in Washington did not confirm the reports when asked by CNN and Reuters.
If tension remains then Gold could continue to find support. Any indication that this may not come to fruition could have the opposite impact on Gold and see any safe haven buying temporarily come to a halt.
Gold prices continue to be the best gauge for market sentiment with the precious metal remaining extremely sensitive to any changes. This is likely to continue for now as a host of risks remain but they are slowly moving to the background.
Lack of US Data
The lack of US data is another area where the precious metal has benefited as it has resulted in a weaker US Dollar. The last few weeks has seen the US Dollar receive some support when data has been positive.
Last week's US Data however actually aided the precious metal as growth concerns returned to the fore. Thai sparked the rate conversation once more with Fed policymakers signaling caution as global growth appears to be coming under threat.
OANDA Order and Position Book
Looking at the OANDA position book and you can clearly see below the amount of buy positions open around the 3300-3310 handle. A sign that market participants are expecting further upside.
The Open Position chart provides data from the perspective of the open positions of OANDA clients globally. Depending on the price level on the chart, you can see the distribution of long and short positions held, the profitability (unrealized P&L), and the proportion of total longs and shorts across all price levels.
By seeing how OANDA’s client orders and net positions are distributed across price levels, users have an additional tool that helps analyse potential support and resistance levels at various price points.
https://proptrader.oanda.com/en/lab-education/tools/order-book-position-book-tool/
Source: OANDA Labs
Technical Analysis - Gold (XAU/USD)
From a technical analysis standpoint, gold has printed two bearish four-hour candles in a row. There is also a potential evening star candlestick pattern which hints at further downside.
Looking at the candles though, the previous four-hour candle left a massive downside wick and failed to close below the 3300 handle. This is a sign of the buying pressure still evident in Gold markets.
If the 3300 handle holds firm, a move beyond the daily high at 3320 appears likely.
A four-hour candle close below the 3300 handle would be a sign of caution for market participants. It will not however invalidate the bullish structure with a four-hour candle close below the swing low at 3212 needed for such a development to take place.
In short, while bulls remain in control there is a possibility of a deeper retracement if the 3300 handle gives way.
Gold (XAU/USD) Daily Chart, May 21, 2025
Source: TradingView (click to enlarge)
Bitcoin Races Towards New All-Time Highs – Crypto Update
BTC is less than $1,000 from its all-time highs! Bitcoin and other cryptos appreciated quite well since April 2025, from a rebound in risk assets. Fears from US tariffs were at their peak as President Trump started to put down the microphone and discuss with other foreign politicians. The US dollar as been lagging, giving a further boost to cryptos.
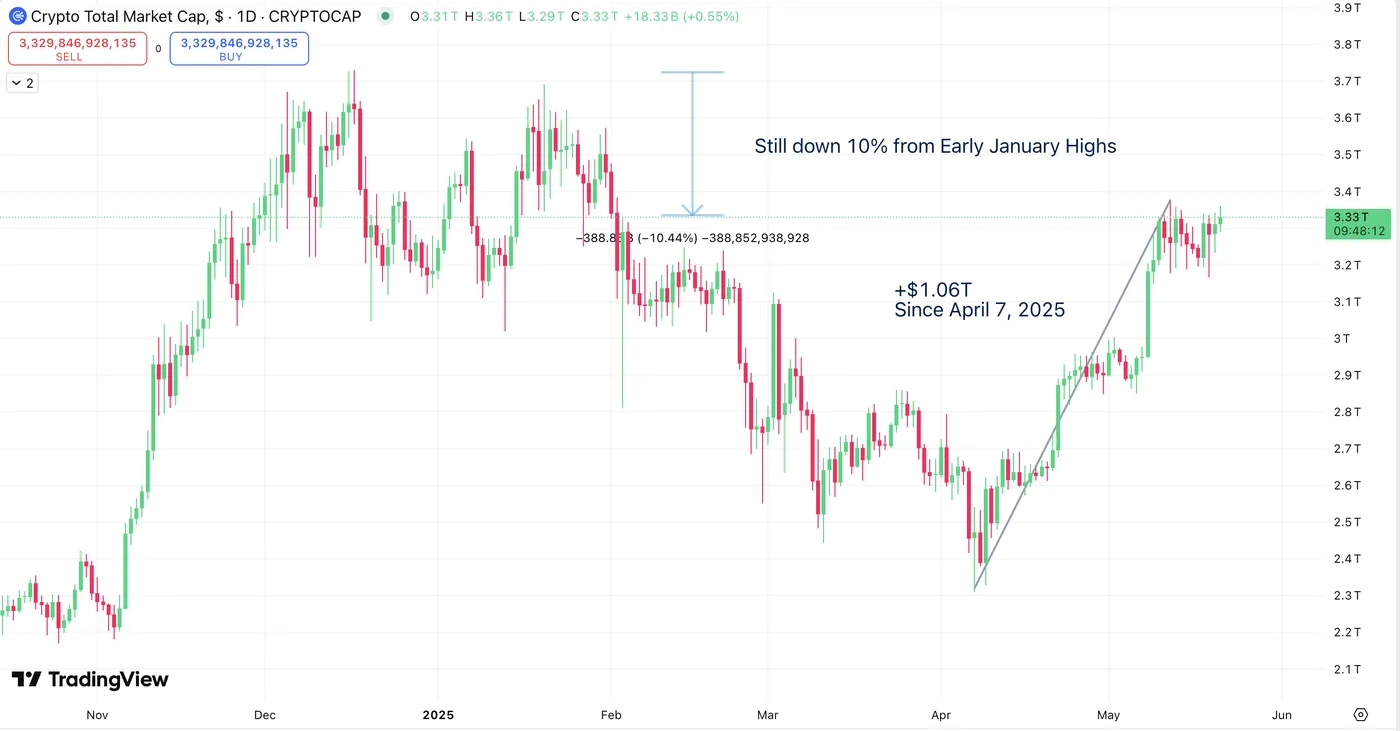
Total Crypto Market Cap since 2024
Crypto Total Market Cap, November 2024 to 21 May, 2025 - Source: TradingView
Bitcoin is coming really close to its all-time highs, right now at $109,200 and its all time-high is at $109,618. Up a staggering 46.5% since April 7th lows, BTC has enjoyed from a risk-on appetite in markets.
Gold for example has been correcting since, off its highs and stock indices around the world have also made all-time highs.
There has been a particularly strong inflow of fresh money into Crypto ETFs, in names like IBIT and FBTC.
ETH appreciated from this inflow also, up at its peak 95% compared to its trough on the 7th of April.
SOL, which went to a high of $295 retraced all the way back to 97$ and experienced a rise similar to Ethereum.
XRP, which did not experience such a drop, recovered 52% from its April lows, is showing signs of consolidation towards a breakout.
Observe technical levels for BTC further in the article.
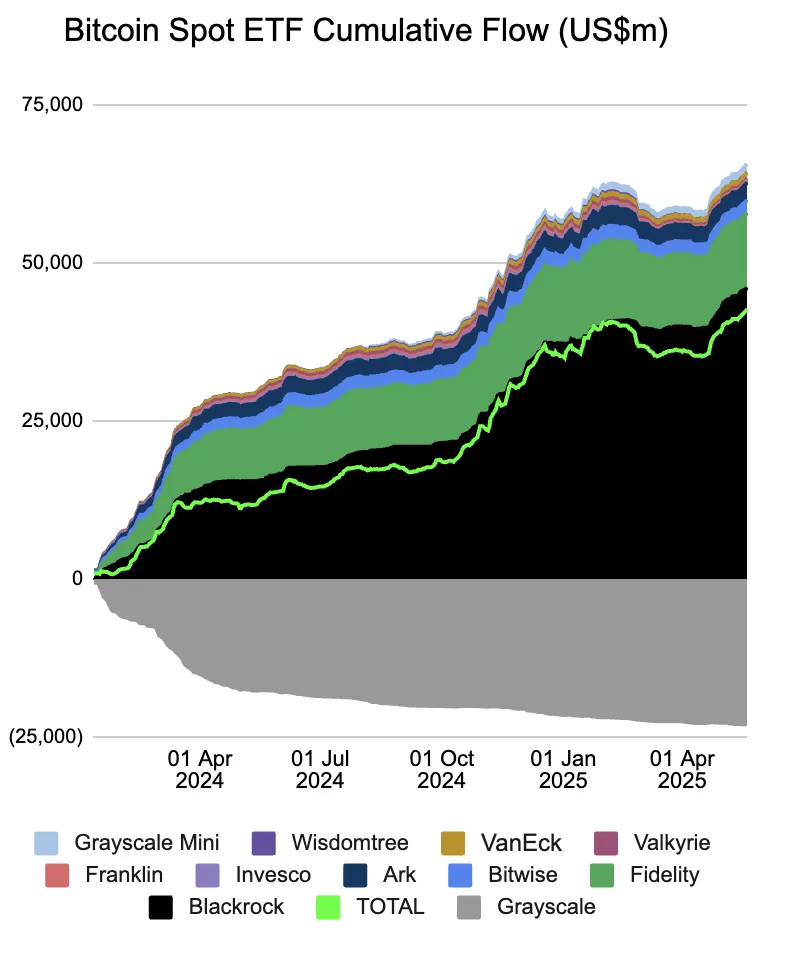
Crypto ETF Inflows chart. Source: Farside.com
BTC Technical Analysis
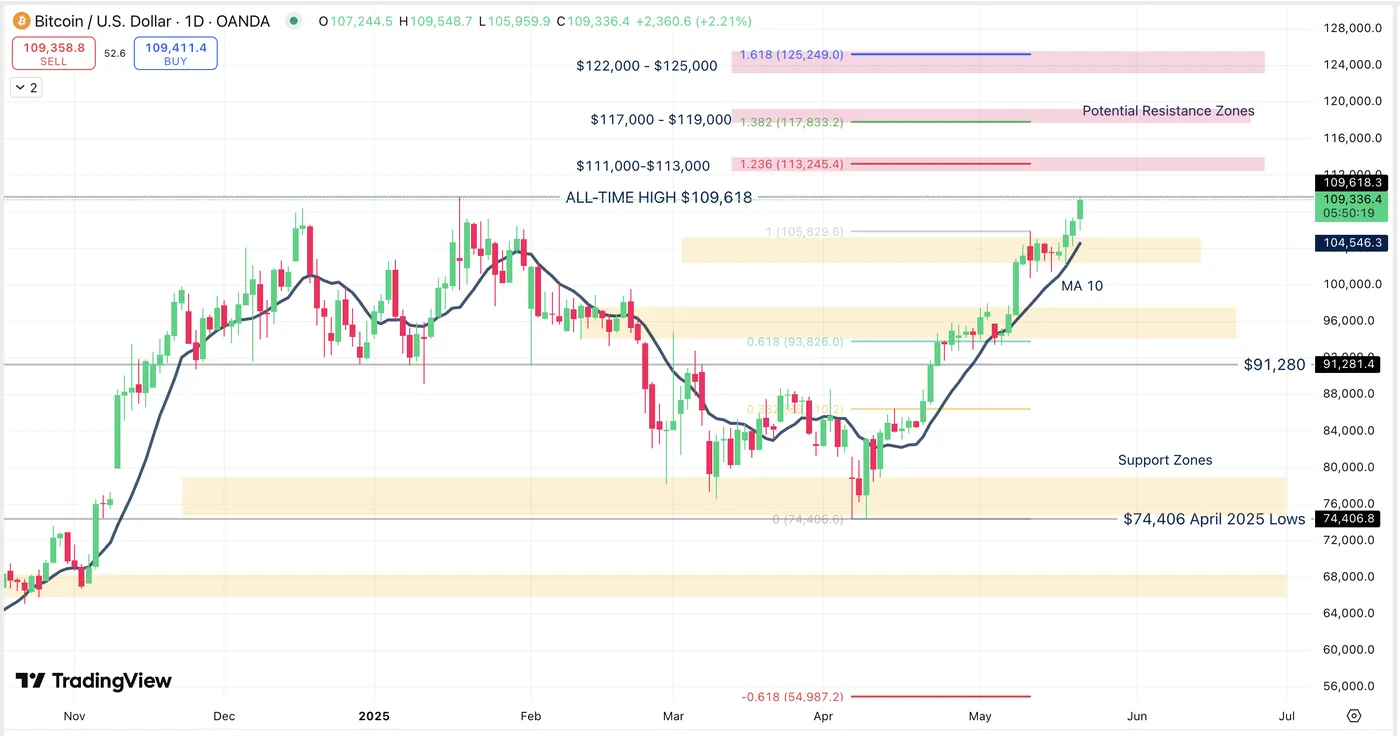
BTC/USD Daily Chart, 21 May, 2025. Source: TradingView
BTC is real close to its all-time high! Track the Daily MA 10 which follows closely rebounds in prices.
Fibonacci projections indicate potential resistance levels on a breakout at:
- $111,000-$113,000
- $117,000 - $119,000
- $122,000 - $125,000
Support Zones are:
- $100,000 - $105,000
- $93,000 - $96,500
- $83,000 - $87,000
- $74,400 - $77,000
Overview on the Crypto Market Today is Green!
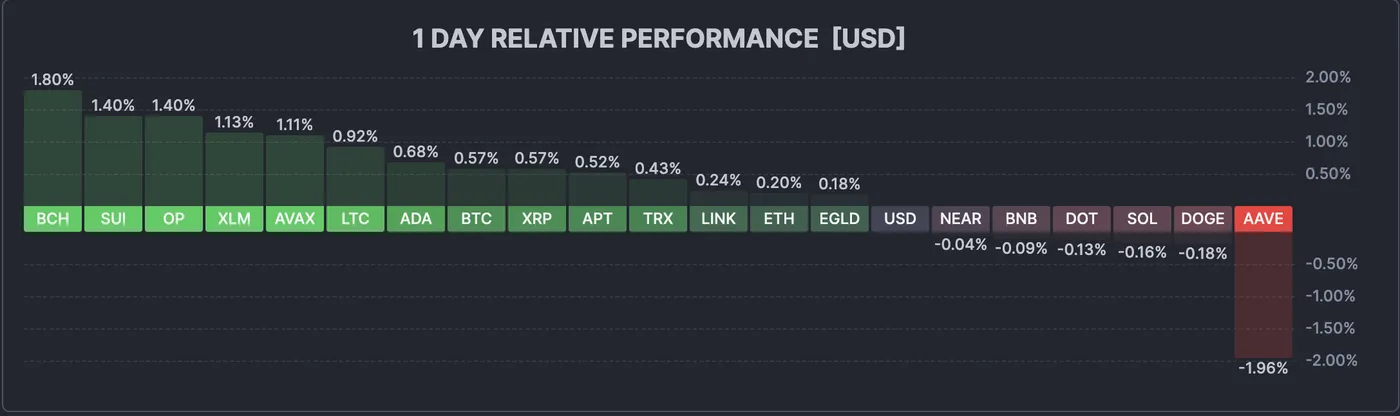
Crypto Overview, May 21, 2025. Source: Finviz
Safe Trades!