
Sample Category Title
Central Banks Announce Rates Amid Tariff Uncertainty
In focus today
The Bank of England is expected to cut the Bank Rate to 4.25%. Inflation has surprised to the downside over the past months and combined with elevated uncertainty and downside risks to growth from the trade war, we expect the MPC to deliver slightly dovish commentary. Read more in our Bank of England Preview, 2 May.
Norges Bank is expected to stay on hold at 4.50%, We do not expect NB to give any clear signals as to whether the rate outlook has changed since March, when they signalled the first cut in September. Focus will be on how they have adjusted their risk assessment around the global trade war and if they will be more concerned with the growth risk.
The Riksbank is expected to stay on hold, keeping the interest rate at 2.25% as they remain in a wait-and-see approach for now.
German industrial production and output is set for release this morning. We have already received GDP data that showed the economy climbed 0.2% q/q in Q1 and manufacturing PMI showed rising output, so the industrial production data should not lead to a market reaction. Consensus expects production to rise 1.0% m/m, but the data is likely to come in stronger than that, as data on factory orders released yesterday showed a larger-than-expected rise in March.
Economic and market news
What happened overnight
In the trade war, New York Times reported President Trump is expected to announce a trade deal between the US and the UK today. Trump also hinted at this on social media.
What happened yesterday
In the trade war, China and US agreed to initiate negotiations to de-escalate the trade war, with talks set to begin in Switzerland over the weekend. The first discussion will aim to deescalate the situation and bring tariffs down to a level where trade can resume. We expect that soon they will bring down tariffs to 50-60%, although negotiations will be challenging due to differing negotiation styles. China has the greatest interest in standing firm in the negotiations in the short term as they can react quickly with new stimuli, unlike Trump, who cannot control monetary policy himself - and also being dependent on Congress to get tax cuts through.
In the US, the Fed maintained an unchanged monetary policy keeping rates between 4.25% and 4.50%. Fed Chair Powell expressed no hurry to cut rates. Powell seemed to be suggesting the Fed is not looking to move pre-emptively, even if tariffs would pose a recession risk. There was a clear emphasis on the Fed being in a good place for now, but when asked, Powell did not explicitly close the door for a cut in June. Read more in our Research US - Fed review: Still in a good place, 7 May.
In the euro area, retail sales declined 0.1% m/m in March as expected. Retail sales thus continued the stagnation seen over the past six months. On the one hand, it is negative that retail sales are not rising amid a strong labour market, rising real wages, and lower rates. Although on the other hand, it shows that consumers have not scaled back consumption on the back of the significantly lower consumer confidence observed lately.
In Sweden, preliminary inflation numbers for April came in with CPIF at 2.3% and CPIF ex energy at 3.1%. The data was close to both expectations and the Riksbank's forecasts and will keep the Riksbank in a wait-and-see mode.
In Poland, the central bank opted for a 50bp cut, taking the key rate to 5.25%. Barely a month ago, Governor Glapinski stated that there was no room for cuts until late 2025. We will have to await today's press briefing for comments on the matter.
In Czechia, the central bank lowered the two-week repo rate by 25bp to 3.5%.
Equities: Equities finished higher yesterday following some fluctuating trading, particularly during the US session, where markets oscillated between gains and losses. It is worth noting however, that intraday movements and volatility continue to decline, with the VIX also closing lower. Hence, investors are increasingly accepting the noise from the US trade war. Cyclical stocks marginally outperformed defensives, and small caps outperformed large caps for the fourth consecutive day. In the US yesterday, Dow +0.7%, S&P 500 +0.4%, Nasdaq +0.3%, Russell 2000 +0.3%.
This morning, most Asian markets are trading in positive territory, and both European and especially US equity futures are pointing higher following comments from Donald Trump, who suggested he may announce a major trade deal at a press conference today - potentially with the UK.
FI&FX: There was a decent rally in both European government bonds as well as US Treasuries, where the curves flattened from the long end. Hence, the comments from the Federal Reserve did not change much for the market as they are on hold as expected. The Federal Reserve points to higher inflation from taxes, but also slowing demand given the significant uncertainty. In the currency market the dollar strengthened modestly versus both EUR and the JPY. This morning, we have seen a modest rise in US treasury yield in Asian trading and modest moves in the USD vs. both EUR and JPY. Today, we have central bank meetings in UK, Sweden and Norway.
GBP/USD Daily Outlook
Daily Pivots: (S1) 1.3254; (P) 1.3318; (R1) 1.3357; More...
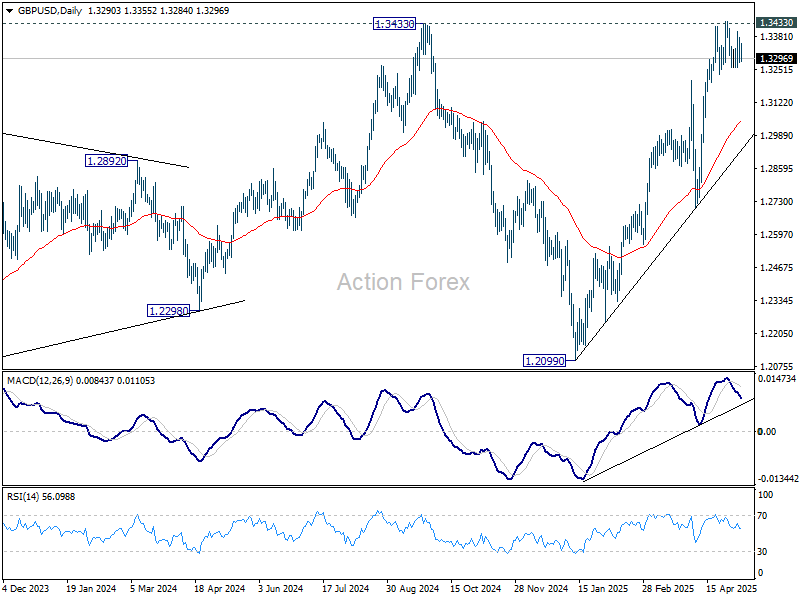
Range trading continues in GBP/USD and intraday bias remains neutral at this point. On the downside, firm break of 1.3232 support will indicate short term topping and rejection by 1.3433 key resistance. Intraday bias will be back on the downside for deeper pullback to 55 D EMA (now at 1.3051) and possibly below. On the upside, decisive break of 1.3433 key resistance will confirm larger up trend resumption.
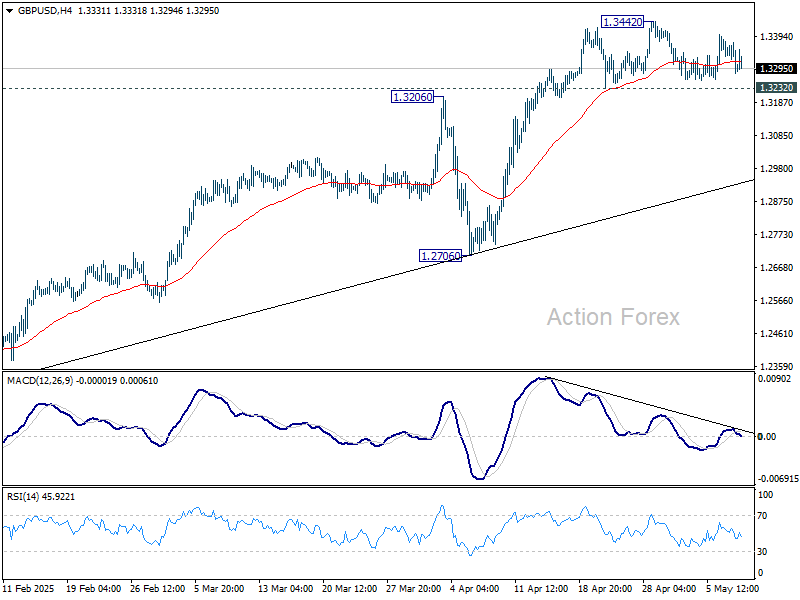
In the bigger picture, price actions from 1.3433 are seen as a corrective pattern to the up trend from 1.3051 (2022 low). Rise from 1.2099 could either be resuming the up trend, or the second leg of a consolidation pattern. Overall, GBP/USD should target 1.4248 key resistance (2021 high) on decisive break of 1.3433 at a later stage.
Sterling in Focus as BoE Decision and US-UK Trade Deal Speculation Loom
Trading in the forex markets remains subdued. Fed’s policy announcement overnight triggered minimal market reaction, as it delivered a widely expected hold at 4.25–4.50%. While Fed acknowledged that risks of both higher unemployment and higher inflation have increased, Chair Jerome Powell made it clear that rate cuts are not imminent.
“It’s not a situation where we can be preemptive,” Powell emphasized, reinforcing Fed’s data-dependent stance amid ongoing uncertainty from US tariff policies and their impacts.
As attention shifts away from Fed, focus turns squarely to the UK, where the BoE is expected to cut rates by 25 bps. Beyond the cut itself, traders will be parsing the vote split and updated economic projections for signals on the pace of future easing.
Adding a geopolitical dimension to the day’s event risk, there are growing market whispers that a US-UK trade deal will be announced. US President Donald Trump hinted in social media at a "MAJOR TRADE DEAL" to be announced today. While no country was named, sources cited by The Guardian said the deal involves the UK.
If formalized, it would be the first bilateral agreement by the current US administration since its sweeping tariff actions last month. A deal with Britain is seen as relatively straightforward, especially compared to more contentious and prolonged negotiations expected with the EU and China. For markets, such a development could inject fresh direction into an otherwise stagnant environment.
In terms of weekly performance, Yen continues to lead, followed by the Pound and Swiss Franc. On the other end, the Loonie is the weakest, followed by Aussie and Dollar. Euro and Kiwi sit in the middle. However, it should be emphasized that the overall mood remains indecisive, with major pairs and crosses largely trapped within last week's ranges.
In Asia, at the time of writing, Nikkei is up 0.53%. Hong Kong HSI is up 0.62%. China Shanghai SSE is up 0.21%. Singapore Strait Times is down -0.26%. Japan 10-year JGB yield is up 0.023 at 1.324. Overnight, DOW rose 0.70%. S&P 500 rose 0.43%. NASDAQ rose 0.27%. 10-year yield fell -0.033 to 4.275.
Looking ahead, BoE rate decision is the main focus in European session. Later in the day, US will release jobless claims and non-farm productivity.
BoE to cut, watch vote split and forecasts for dovish signals
BoE is widely expected to deliver a 25 bps rate cut today, bringing the Bank Rate down to 4.25%. Governor Andrew Bailey and fellow policymakers have consistently emphasized a cautious approach to cutting rates, and that tone is expected to persist amid lingering uncertainties.
Most economists surveyed by Reuters anticipated BoE will stick to a quarterly pace of easing, suggesting Bank Rate ends the year at 3.75%. However, market participants are slightly more dovish. Traders are now fully pricing in three more cuts by the end of 2025, projecting a rate of 3.50% at year-end.
There might be some hints on how dovish BoE is leaning to, from today's vote split and updated economic projections. In particular, focus will fall on whether known dove Swati Dhingra would push for a larger 50bps reduction, and whether there are material downgrades to both growth and inflation forecasts.
From a market perspective, EUR/GBP will be closely watched for signals on investor sentiment following the decision.
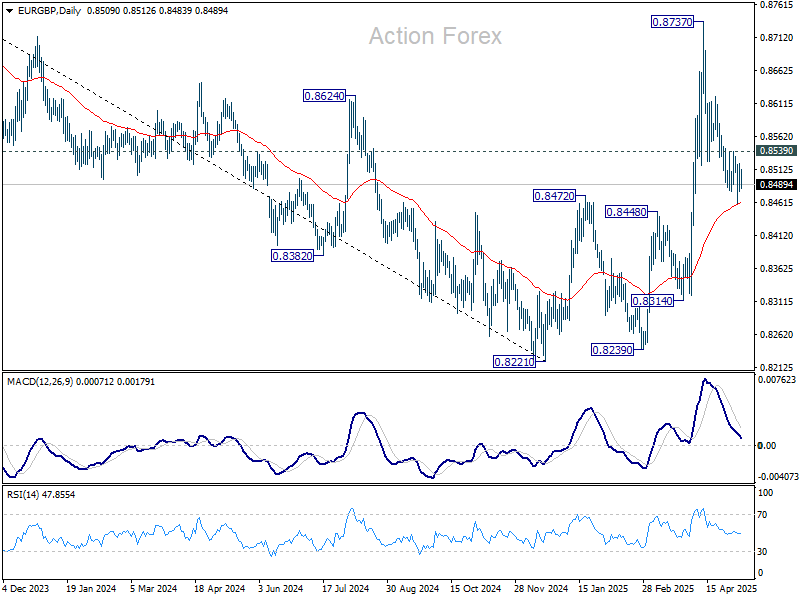
EUR/GBP is currently testing support at 55 D EMA (now at 0.8460). Strong rebound from current level would keep rally from 0.8239 alive. A break above 0.8539 resistance should confirm that fall from 0.8737, while deep, has completed as a correction. Retest of 0.8737 should be seen next.
On the flip side, sustained break below the 55 D EMA would raise the risk of near-term bearish reversal, and open the path back toward the 0.8221/0.8239 support zone.
RBNZ flags global growth risks as tariffs echo COVID-era disruptions
RBNZ Governor Christian Hawkesby warned today that rising global tariffs are having a clear and negative impact on global economic activity, prompting the central bank to revise down its projections for global growth.
Speaking to a parliamentary committee, Hawkesby called the effects of the tariff wave “unambiguously” harmful. He added that while New Zealand’s exposure to a 10% US tariff on exports poses challenges, the softer New Zealand Dollar may help cushion some of the blow. Nonetheless, weaker demand from key trading partners is now a growing concern for the country’s outlook.
Hawkesby drew a stark comparison between the supply-side disruptions caused by current tariffs and those seen during the COVID-19 pandemic, stressing that both are capable of delivering long-lasting economic distortions.
“We know from our experience, from the COVID experience, that supply side impacts are significant, and that are long-lasting and can create real challenges,” he said.
He added that the situation remains fluid, with considerable uncertainty about how the structural dynamics of the global economy will adjust to this new trade regime.
BoJ minutes: Caught between global uncertainty and domestic price pressures
Minutes from BoJ’s March meeting revealed growing concern among policymakers over the external risks posed by US tariff policies.
One member warned that downside risks from these policies had “rapidly heightened” and could significantly harm Japan’s real economy, suggesting BoJ should "be particularly cautious when considering the timing for the next rate hike."
However, not all board members advocated for a cautious stance. Another member stressed that even amid heightened uncertainty, BoJ should not automatically default to a cautious stance, stating that BOJ "might face a situation where it should act decisively".
A third voice on the board emphasized the importance of incorporating inflation expectations, upside risks to prices, and progress in wage growth into BoJ’s policy deliberations. Domestic developments could still justify tightening if conditions shift meaningfully.
Separately, BoJ Governor Kazuo Ueda reinforced this message in his remarks to parliament today, acknowledging that while food price volatility, particularly for rice, remains elevated, these pressures would ease over time.
Nonetheless, Ueda emphasized the importance of monitoring price developments closely, given the elevated uncertainty in the global economic environment.
GBP/USD Daily Outlook
Daily Pivots: (S1) 1.3254; (P) 1.3318; (R1) 1.3357; More...
Range trading continues in GBP/USD and intraday bias remains neutral at this point. On the downside, firm break of 1.3232 support will indicate short term topping and rejection by 1.3433 key resistance. Intraday bias will be back on the downside for deeper pullback to 55 D EMA (now at 1.3051) and possibly below. On the upside, decisive break of 1.3433 key resistance will confirm larger up trend resumption.
In the bigger picture, price actions from 1.3433 are seen as a corrective pattern to the up trend from 1.3051 (2022 low). Rise from 1.2099 could either be resuming the up trend, or the second leg of a consolidation pattern. Overall, GBP/USD should target 1.4248 key resistance (2021 high) on decisive break of 1.3433 at a later stage.
BoE to cut, watch vote split and forecasts for dovish signals
BoE is widely expected to deliver a 25 bps rate cut today, bringing the Bank Rate down to 4.25%. Governor Andrew Bailey and fellow policymakers have consistently emphasized a cautious approach to cutting rates, and that tone is expected to persist amid lingering uncertainties.
Most economists surveyed by Reuters anticipated BoE will stick to a quarterly pace of easing, suggesting Bank Rate ends the year at 3.75%. However, market participants are slightly more dovish. Traders are now fully pricing in three more cuts by the end of 2025, projecting a rate of 3.50% at year-end.
There might be some hints on how dovish BoE is leaning to, from today's vote split and updated economic projections. In particular, focus will fall on whether known dove Swati Dhingra would push for a larger 50bps reduction, and whether there are material downgrades to both growth and inflation forecasts.
From a market perspective, EUR/GBP will be closely watched for signals on investor sentiment following the decision.
EUR/GBP is currently testing support at 55 D EMA (now at 0.8460). Strong rebound from current level would keep rally from 0.8239 alive. A break above 0.8539 resistance should confirm that fall from 0.8737, while deep, has completed as a correction. Retest of 0.8737 should be seen next.
On the flip side, sustained break below the 55 D EMA would raise the risk of near-term bearish reversal, and open the path back toward the 0.8221/0.8239 support zone.

BoJ minutes: Caught between global uncertainty and domestic price pressures
Minutes from BoJ’s March meeting revealed growing concern among policymakers over the external risks posed by US tariff policies.
One member warned that downside risks from these policies had “rapidly heightened” and could significantly harm Japan’s real economy, suggesting BoJ should "be particularly cautious when considering the timing for the next rate hike."
However, not all board members advocated for a cautious stance. Another member stressed that even amid heightened uncertainty, BoJ should not automatically default to a cautious stance, stating that BOJ "might face a situation where it should act decisively".
A third voice on the board emphasized the importance of incorporating inflation expectations, upside risks to prices, and progress in wage growth into BoJ’s policy deliberations. Domestic developments could still justify tightening if conditions shift meaningfully.
Separately, BoJ Governor Kazuo Ueda reinforced this message in his remarks to parliament today, acknowledging that while food price volatility, particularly for rice, remains elevated, these pressures would ease over time.
Nonetheless, Ueda emphasized the importance of monitoring price developments closely, given the elevated uncertainty in the global economic environment.
RBNZ flags global growth risks as tariffs echo COVID-era disruptions
RBNZ Governor Christian Hawkesby warned today that rising global tariffs are having a clear and negative impact on global economic activity, prompting the central bank to revise down its projections for global growth.
Speaking to a parliamentary committee, Hawkesby called the effects of the tariff wave “unambiguously” harmful. He added that while New Zealand’s exposure to a 10% US tariff on exports poses challenges, the softer New Zealand Dollar may help cushion some of the blow. Nonetheless, weaker demand from key trading partners is now a growing concern for the country’s outlook.
Hawkesby drew a stark comparison between the supply-side disruptions caused by current tariffs and those seen during the COVID-19 pandemic, stressing that both are capable of delivering long-lasting economic distortions.
“We know from our experience, from the COVID experience, that supply side impacts are significant, and that are long-lasting and can create real challenges,” he said.
He added that the situation remains fluid, with considerable uncertainty about how the structural dynamics of the global economy will adjust to this new trade regime.
FOMC’s Holding Pattern Continues
Summary
- The widely expected decision by the FOMC to keep rates on hold at today's policy meeting was universally supported by all 12 voting members of the Committee.
- In its post-meeting statement, the FOMC noted that "uncertainty around the economic outlook has increased further" (emphasis ours). The statement included the previously used sentence that "the Committee is attentive to the risks to both sides of its dual mandate" but then added "and judges that the risks of higher unemployment and higher inflation have risen."
- The sharp rise in the effective tariff rate likely will cause both inflation and the unemployment rate to rise in coming months. Hence, there may be some tension in terms of the Fed's dual mandate (i.e., "price stability" and "full employment") in coming months.
- The best course of action for the FOMC may simply be to wait for more clarity about trade policy and its implications for the U.S. economy. Indeed, Chair Powell seemed to indicate as such during his post-meeting press conference.
Tariffs Have Caused Uncertainty to Increase Further
As universally expected, the Federal Open Market Committee (FOMC) decided at the conclusion of its meeting today to keep the target range for the federal funds rate unchanged at 4.25%-4.50%. After cutting rates by 100 bps between September and December of last year, the Committee has now been on hold for three consecutive policy meetings. The decision to keep policy unchanged was unanimously supported by all 12 voting members of the FOMC.
As is typical for the third FOMC gathering of the year, the Federal Reserve did not release a Summary of Economic Projections (SEP), which summarizes the FOMC's macroeconomic forecasts, after the conclusion of today's meeting. So if the Committee wanted to give any guidance as to its intentions going forward, it would need to do so via the post-meeting statement. In that regard, the statement was very much noncommittal. At the time of the last FOMC meeting on March 19, President Trump had not yet announced his "Liberation Day" tariffs, which were widely seen as being higher than expected. The March 19 statement noted that "uncertainty around the economic outlook has increased." Although the president has paused his "reciprocal" tariffs until July, today's statement added "further" to the end of the last sentence. Additionally, statements from the last few FOMC meetings have noted that "the Committee is attentive to the risks to both sides of its dual mandate." Today's statement included that sentence but added "and judges that the risks of higher unemployment and higher inflation have risen."
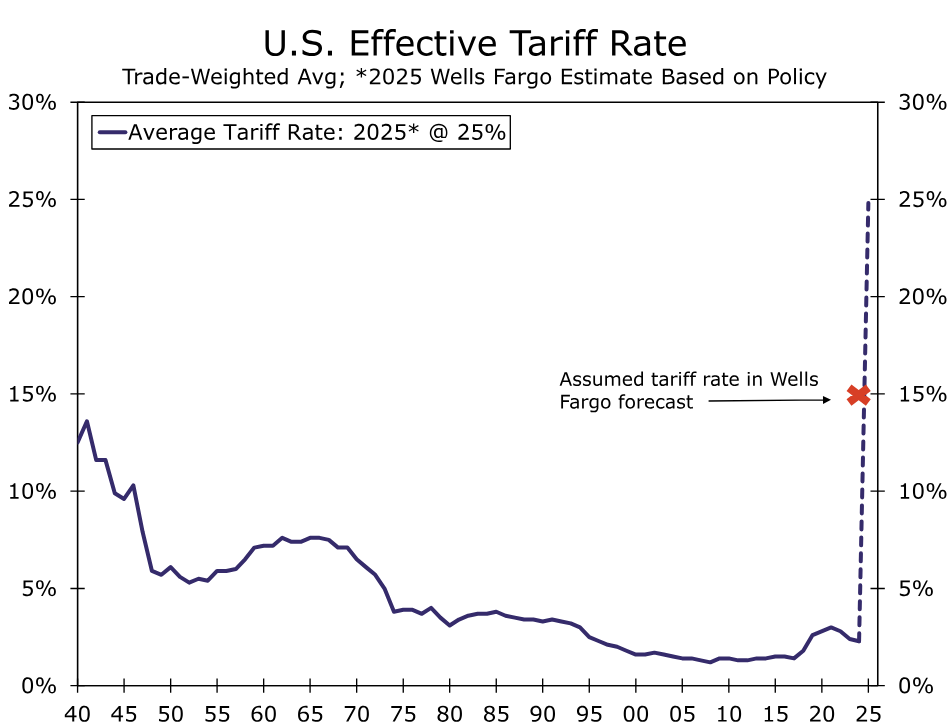
At present, a 10% universal tariff applies to most goods imported from most countries with a 145% tariff applied to most goods from China. We estimate these levies yield an effective tariff rate of roughly 25%, the highest rate in over a century (Figure 1). As we discussed in a report we published soon after "Liberation Day," tariffs of that magnitude would lead to a meaningful rise in inflation and sharp downturn in real GDP later this year. (Unemployment would rise as the economy weakens). We think the effective tariff rate will recede somewhat as the Trump Administration reaches trade deals with some trading partners. But we think a return to the 2% effective tariff rate of 2024 is highly unlikely. For purposes of our last forecast, which we published on April 8 and which can be found here, we assume the effective tariff rate will fall to 15%.
FOMC Likely On Hold Until It Gets More Clarity
Nevertheless, the rise in the effective tariff rate relative to earlier this year likely will cause inflation to move higher and the unemployment rate to increase in coming months. On one hand, the FOMC would want to ease policy as the jobless rate rises. On the other hand, however, rising inflation would induce Fed policymakers to refrain from easing policy, if not tighten it. In other words, there may be some tension in terms of the Fed's dual mandate (i.e., "price stability" and "full employment") in coming months. The best course of action for the FOMC may simply be to wait for more clarity about trade policy and its implications for the U.S. economy. Indeed, Chair Powell reiterated during his press conference that "we don't think we need to be in a hurry to adjust rates." Given the underlying solid nature of the economy, which the FOMC noted in its post-meeting statement, Powell said that "the costs of waiting are fairly low."
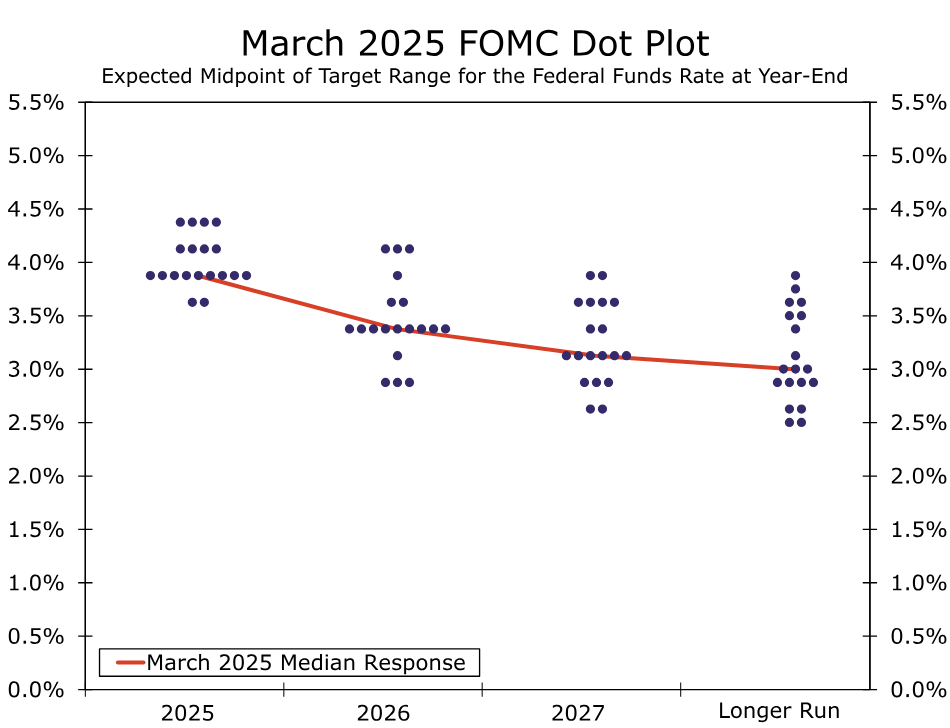
As noted previously, our latest forecast was published about a month ago. That forecast looked for the FOMC to begin an easing cycle with a 25 bps rate cut at its next policy meeting on June 18. We readily acknowledge, however, that the risks to that forecast now seemed skewed toward a later start to our expected easing cycle than June. That forecast also looked for 125 bps of rate cuts by the end of the year, which now appears to be a bit aggressive. We will be publishing a new forecast tomorrow (May 8) in which we still see the FOMC eventually easing policy this year. Furthermore, we think the Committee will cut rates by more than 50 bps, which the median FOMC respondent foresaw in the March "dot plot" (Figure 2). Our new forecast will be sent to email recipients early tomorrow morning (May 8) and posted to our website by the end of the day.
Fed Review: Still in a Good Place
- The Fed maintained its policy rates unchanged in the May meeting, as widely expected. QT continues unchanged also as expected.
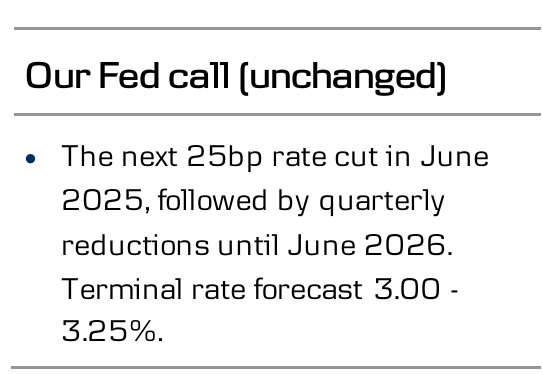
- Powell emphasized that the Fed is in a good place amid the high uncertainty and carefully avoided influencing financial conditions. We still maintain our Fed view unchanged and expect the next rate cut in June.
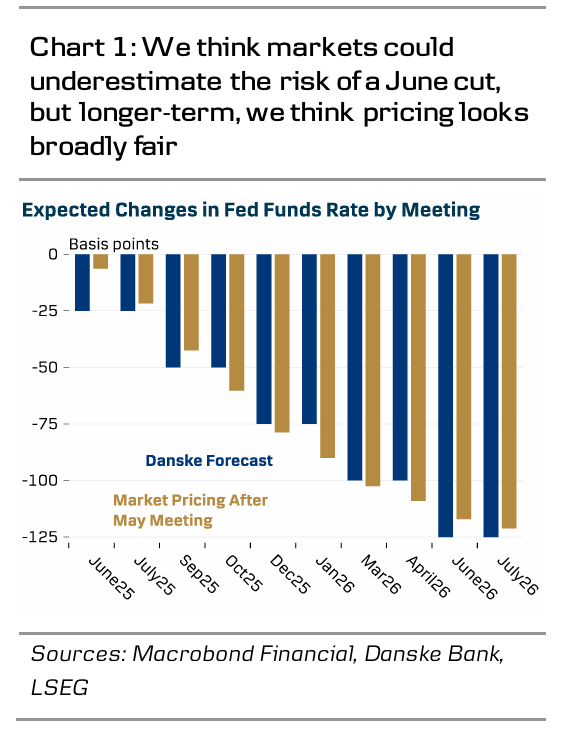
- Market reaction was muted, with UST curve steepening slightly and EUR/USD declining close to the 1.13 level. Markets price in around 5-6bp worth of cuts for the June meeting and a total of 78bp by December.
While it's no news for anyone that uncertainty is high, and that the stagflationary risk outlook poses a challenge for central bankers, Powell affirmed that current policy stance is still well suited for the occasion. The Fed is prepared to act quickly if needed, but the current environment leaves no room for pre-emptive moves.
After the extreme market volatility seen in early April, the recent easing in financial conditions and the latest batch of solid hard data allow the Fed to remain in a wait-and-see mode, as we argued in our preview. Powell's very cautious tone and carefully balanced wording suggest that the policymakers do not intend to provide signals or influence financial conditions before gaining further clarity.
The policy statement received only two, largely cosmetic changes. The Fed acknowledged that despite the decline in net exports (due to front-loading), underlying growth remained solid in Q1. The statement also emphasized that risks of both higher unemployment and inflation have risen, but neither it nor Powell specified which risk is the more pressing concern at the moment.
Markets are pricing only 20-25% probability for a cut in the June meeting, which remains our base case. The rate cut hinges on two factors, clarity on tariffs and how they translate into hard data. On the former, Trump added to the uncertainty just before the rate decision by announcing that he is 'not open to pulling back on the 145% tariffs' even if US and China are set to begin preliminary trade talks over the weekend.
On the latter, we still think risks are skewed towards downside surprises as front-loaded demand fades and goods supply shortages become increasingly common - especially if reaching an agreement on reducing China-tariffs takes longer than expected.
We expect to see majority of the tariff-driven growth slowdown over the course of H2. So even if the Fed opts to remain on hold also in June, we remain confident in our call for three cuts in total for the rest of 2025. We maintain our call for the terminal rate at 3.00-3.25% reached by June 2026. Finally, the Fed made no changes to its QT as expected after the taper announcement in March. Powell did not comment on how the recent turmoil in UST markets might have influenced the committee's thinking on the final stages of QT.
Markets: No news is good news for the USD (for now)
With the Fed’s “lack of urgency”-signal being in line with expectations the market reaction proved very limited. The curve bull-steepened slightly while the USD gained somewhat with EUR/USD falling to the 1.13 level. At this stage lack of news is good news for the greenback with investors likely trimming USD shorts (negative carry) from stretched territory. While we maintain a strategic bearish view on the USD we highlight that our tactical conviction is low and with the asymmetric sensitivity skewed towards USD-bullish news the recent rebound could extend in the coming sessions – naturally subject to news from the Trump administration.
Gold Dips Remain Attractive—Are Bigger Gains Just Around The Corner?
Key Highlights
- Gold found support near $3,200 and started a fresh increase.
- A key bullish trend line is forming with support at $3,285 on the 4-hour chart.
- EUR/USD is still consolidating gains below the 1.1420 resistance zone.
- WTI Crude Oil prices could start another decline below the $57.00 level.
Gold Price Technical Analysis
Gold prices remained supported above $3,200. The price formed a base and started a fresh increase above the $3,240 and $3,250 resistance levels.
The 4-hour chart of XAU/USD indicates that the price settled above the $3,300 level, the 200 Simple Moving Average (green, 4 hours), and the 100 Simple Moving Average (red, 4 hours). There was a clear move above the 61.8% Fib retracement level of the downward move from the $3,500 swing high to the $3,201 low.
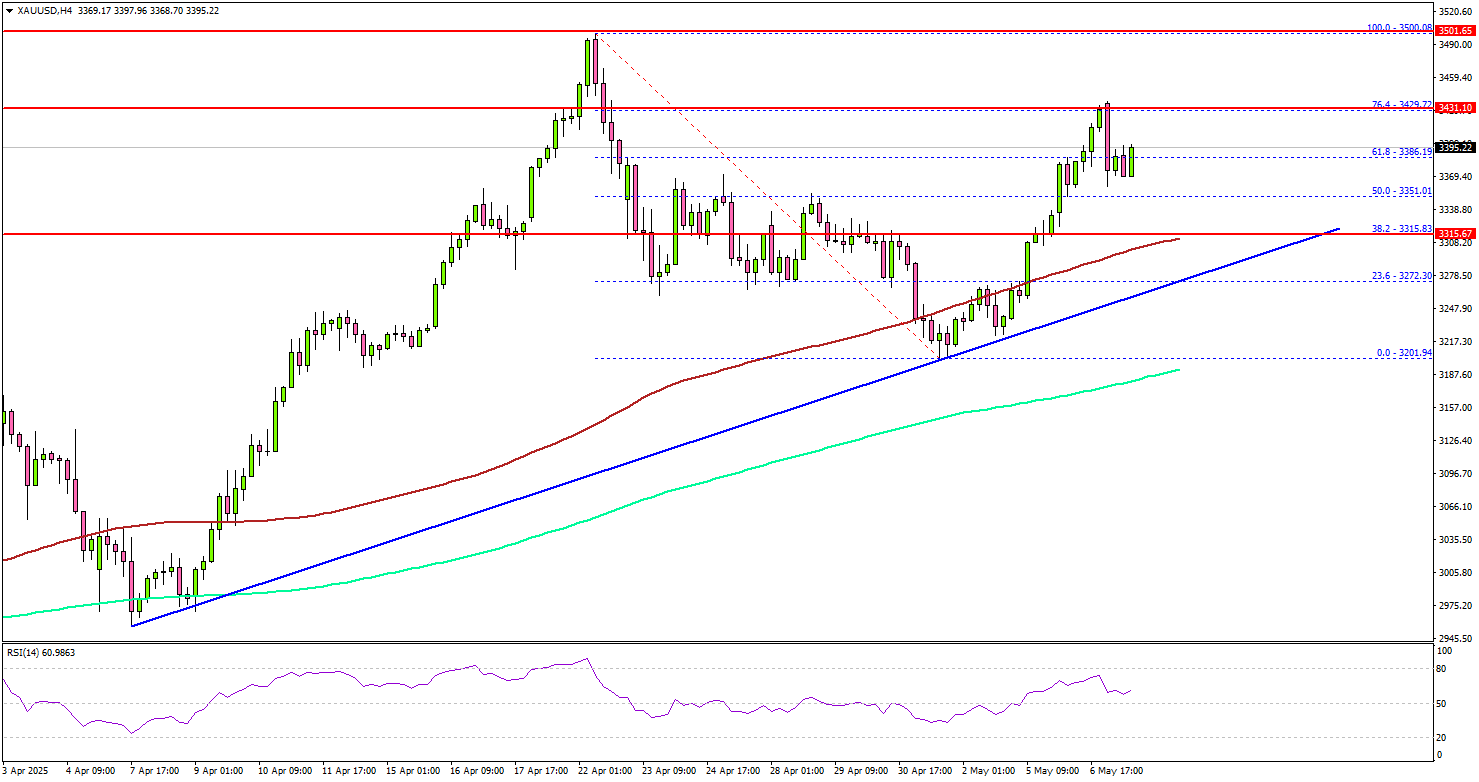
There is also a key bullish trend line forming with support at $3,285 on the same chart. On the upside, immediate resistance is near the $3,430 level and the 76.4% Fib retracement level of the downward move from the $3,500 swing high to the $3,201 low.
The next major resistance sits near the $3,460 level. A clear move above the $3,460 resistance could open the doors for more upsides. The next major resistance could be $3,480, above which the price could rally toward the milestone level of $3,500.
On the downside, initial support is near the $3,350 level. The first key support is near $3,315. The next major support is near the $3,305 level. The main support is now $3,300. A downside break below the $3,300 support might call for more downsides. The next major support is near the $3,200 level.
Looking at EUR/USD, the pair started a consolidation phase and might soon aim for a fresh increase if it clears the 1.1420 resistance.
Economic Releases to Watch Today
- BoE Interest Rate Decision - Forecast 4.25%, versus 4.5% previous.
- US Initial Jobless Claims - Forecast 230K, versus 241K previous.
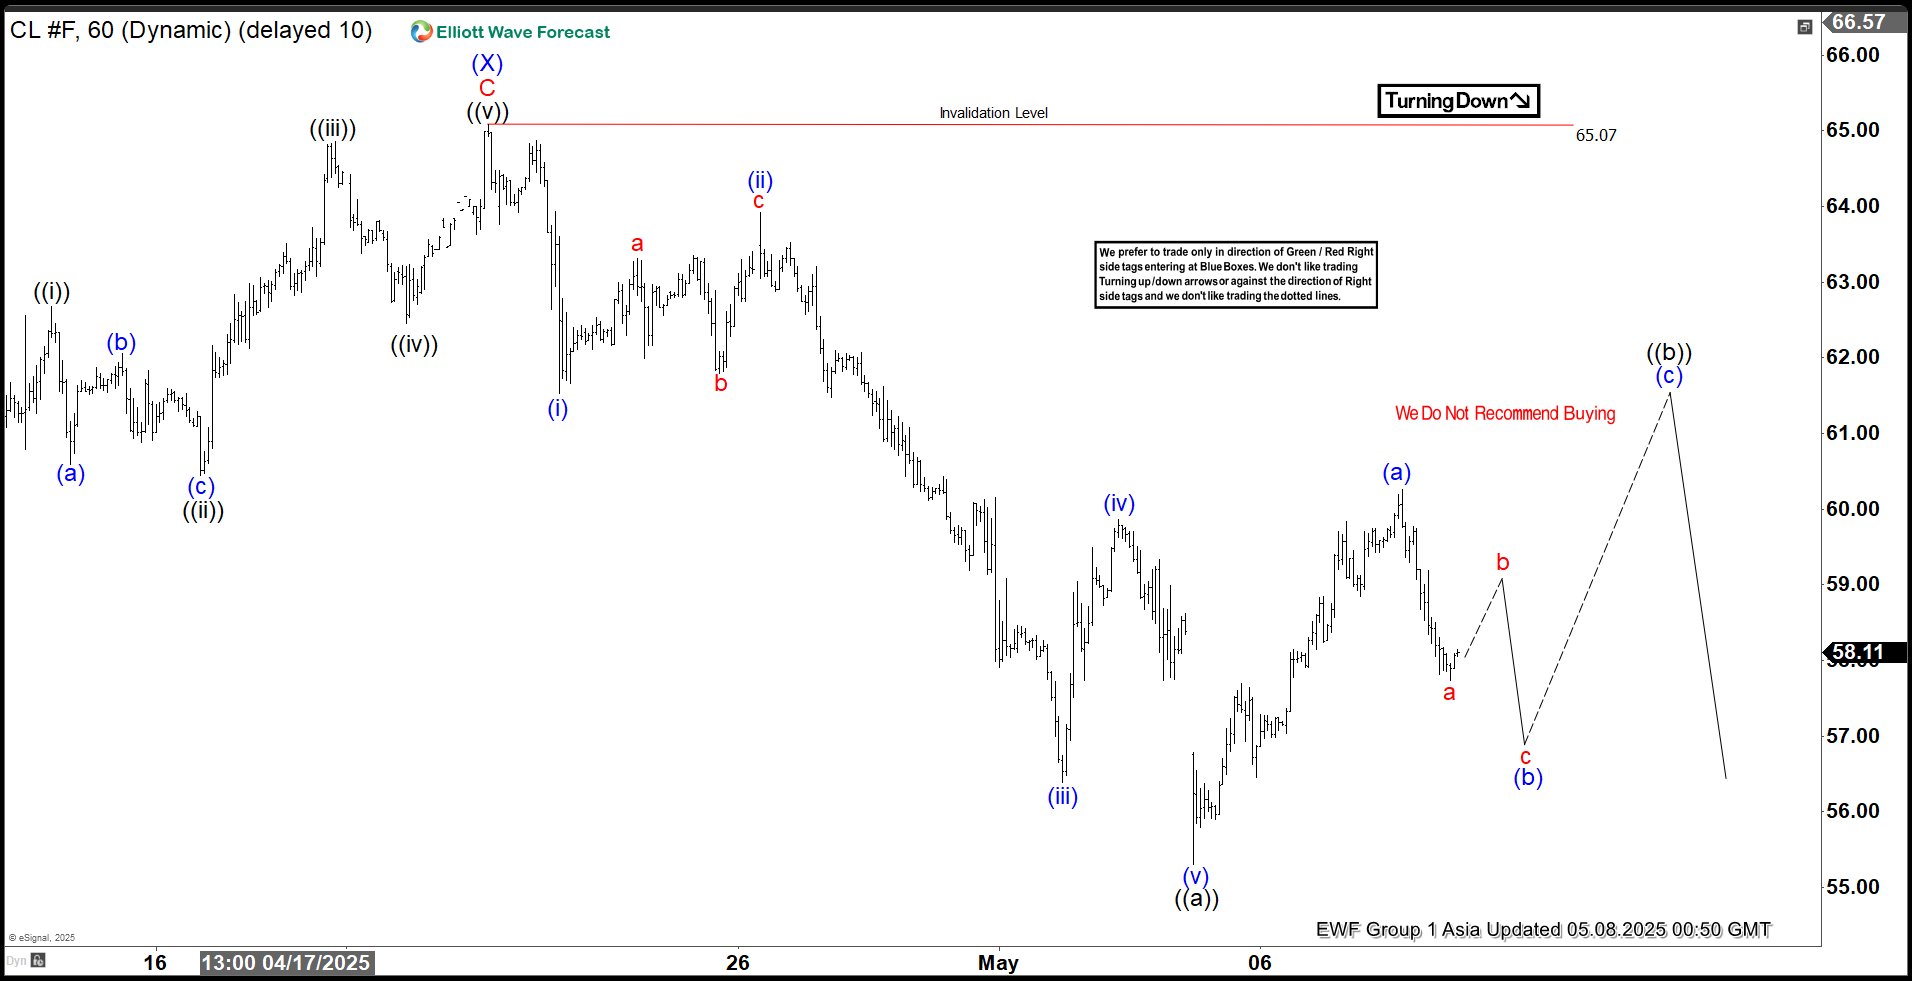
Elliott Wave Perspective: Oil’s (CL) Rally Likely to Stall, Signaling Deeper Losses
The current market cycle for Light Crude Oil (CL), starting from its high on January 15, 2025, is unfolding as a double three Elliott Wave pattern. This technical structure suggests a corrective phase with alternating declines and recoveries. From the peak, the price dropped to 55.12, completing wave (W), followed by a rally to 65.07, marking the end of wave (X). The decline has since resumed in wave (Y), which is breaking down into a WXY pattern, indicating further downside momentum.
Within wave (Y), the initial decline, wave W, is forming as a zigzag. From the wave (X) high, the price fell to 61.53 (wave (i)), then rallied to 63.92 (wave (ii)). The decline continued in wave (iii) to 56.39, followed by a bounce to 59.87 in wave (iv). The final drop in wave (v) reached 55.30, completing wave ((a)) in a higher degree. Currently, wave ((b)) is unfolding as a zigzag, with its first leg, wave (a), reaching 60.26. A pullback in wave (b) is expected soon, followed by a rise in wave (c) to complete wave ((b)).
Looking ahead, as long as the key resistance at 65.07 holds, any rally is likely to fail after 3, 7, or 11 swings, leading to further declines. Traders should watch these levels closely for potential selling opportunities.
Oil 60 Minute Elliott Wave Chart
CL Video Analysis
https://www.youtube.com/watch?v=JERYX14Y-5I