Sample Category Title
BTC/USD Analysis: Is Bitcoin a Safe Haven as Market Cap Hits 2021 Levels?
- Bitcoin's market share hits a 4-year high, sparking debate about its role as a safe haven asset.
- On-chain data and technical analysis suggest $93,000-$95,000 is a critical price range.
- Bitcoin ETFs are seeing increased inflows, particularly BlackRock's IBIT, signaling potential bullish movement.
- Crypto regulation remains complex, with some states like New Hampshire moving forward while others stall.
Bitcoin prices have been consolidating since April 25 just below the 95000 mark with a brief foray higher being met by selling pressure. The world's largest cryptocurrency continues to defy market dynamics as it now accounts for around 65% of the entire crypto market cap, the highest level since 2021.
Bitcoin has enjoyed a rollercoaster ride over the past four months which largely mirrors the overall market dynamic. As usual the naysayers were once again in full voice as price dipped toward the 75000 mark in early April after markets dealt with the shock of US President Donald Trump's universal tariff announcement.
Since then however, Bitcoin has risen to a high of around 97900 a gain of around 30% from the early April lows. This at a time when risk assets have struggled and safe haven assets saw significant inflows. Is this another sign that markets are starting to see the world's largest crypto as a safe haven or diversification hedge against uncertainty? I believe it is, but many may disagree.
Looking ahead though and there are differing takes on where Bitcoin may be headed. I have been looking through some data from GlassNode and there are some interesting takeaways that paint an interesting picture. Let us break these down below.
Glassnode on-chain analytics
According to Glassnode, the current price range between 93000 and 95000 where price found support multiple times between November 2024 and February 2025 may hold the key.
To understand the current market momentum, we can look at how it reacts to key technical and on-chain indicators. When these two align, they give a stronger, clearer signal.
For this analysis, we’re focusing on the 111DMA, a commonly used technical average for measuring Bitcoin momentum, and the Short-Term Holder cost basis, a pricing level that often separates bullish and bearish market trends.
111DMA is at $91.3K, and the Short-Term Holder cost basis is at $93.2K. The price recently moved above both levels and is now trying to stay within this range. This shows a solid upward trend. However, these levels need to be broken and maintained to see further price growth. If the price falls below this zone, it could turn bearish again, leaving investors with significant unrealized losses.
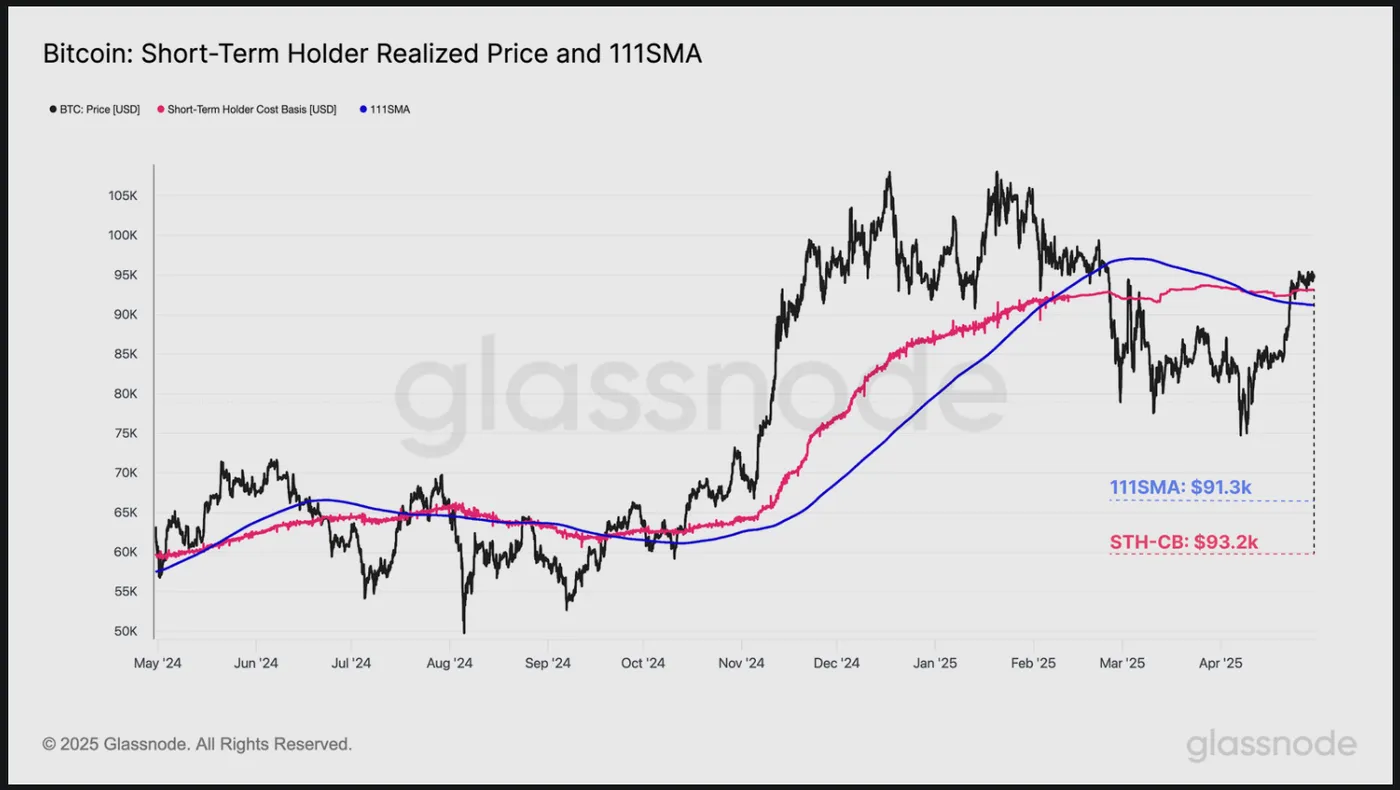
Source: Glassnode
For now price has been holding above these levels with any attempt to break lower being met with significant buying pressure. However, in order for the bulls to take charge a break and consolidation above the 95000 handle will likely be needed.
ETF inflows return
Bitcoin ETFs are enjoying a renaissance of late with BlackRock ishares Bitcoin trust delivering inflows on Friday, May 2 of $674.91 million. No other Bitcoin ETF saw inflows on Friday
However, ETF flows have been strong since mid-April. The last 3 days however have seen flows of around $1.52 billion, a sign that a bullish breakout may be incoming?
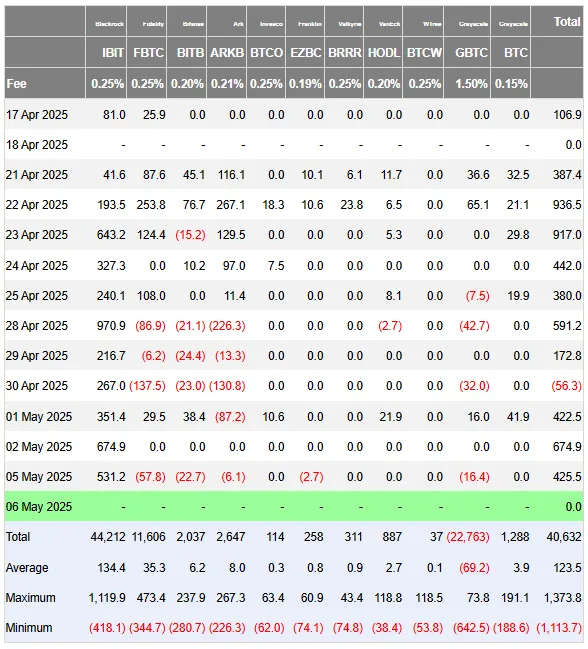
Source: Farside Investors
Another positive for ETF flows around Bitcoin comes from BlackRock once more. BlackRock's iShares Bitcoin Trust (IBIT) has brought in more money this year than the biggest gold-backed ETF.
On May 6, Bloomberg’s Senior ETF analyst Eric Balchunas shared that IBIT is now the sixth-highest fund in the US based on year-to-date inflows.
The data shows that IBIT has attracted over $6.9 billion since January, beating SPDR Gold Shares (GLD), which brought in about $6.5 billion despite a 23% rise in returns.
Is regulation still coming?
Crypto regulation in the US has been a major talking point in 2025. There had been hopes that regulation would finally get the clarity many had been hoping for. So far, there has been a lot of movement at the SEC and on the regulatory front but it appears that every step forward is followed by two steps back.
Bitwise CIO Matt Hougan worries Congress might mess up key crypto regulations at the last moment. The GENIUS Act, once a bipartisan stablecoin win, lost critical support due to concerns about Trump’s role in crypto. This could stall other crypto bills too.
Still, Hougan believes crypto can hit new highs, with bitcoin possibly soaring past $200K, if Congress passes stablecoin and market structure bills. "The next weeks are critical," he said.
"Legislation failure could mean a tough summer for crypto, but success could spark an unstoppable bull run."
A positive announcement did materialize today however, with New Hampshire becoming the first U.S. state to approve a "Strategic Bitcoin Reserve" bill, allowing its treasury to invest in digital assets.
Other states, like Arizona, Illinois, Maryland, Michigan, and Texas, are considering similar laws inspired by a plan from a pro-Bitcoin nonprofit.
On the other hand, Florida has put its bills, House Bill 487 and Senate Bill 550, on hold, stopping plans to allow certain public funds to invest in bitcoin.
All in all a mixed bag and sentiment at present one could say. There does appear to be more optimism than pessimism at this point, so one can only hope that crypto regulation arrives in time and provides a summer crypto boost that many enthusiasts are hoping for.
Technical Analysis - BTC/USD
Bitcoin (BTC/USD) from a technical standpoint has found support at the 93000 handle which has held firm since April 25.
Today's daily candle is on course for a close above the 95000 key level and may close as a hammer candlestick.
This could set the stage for further gains, although it is important to remember that the previous foray above this level was met with significant selling pressure at 97000. The next area of resistance rests at the recent high at 97900 before the 100000 level comes into focus.
As long as the 93000 handle holds the bulls will remain interested.
If the 93000 handle makes way then support may be found at 91804 and the psychological 90000 handle.
Bitcoin (BTC/USD) Daily Chart, May 7, 2025
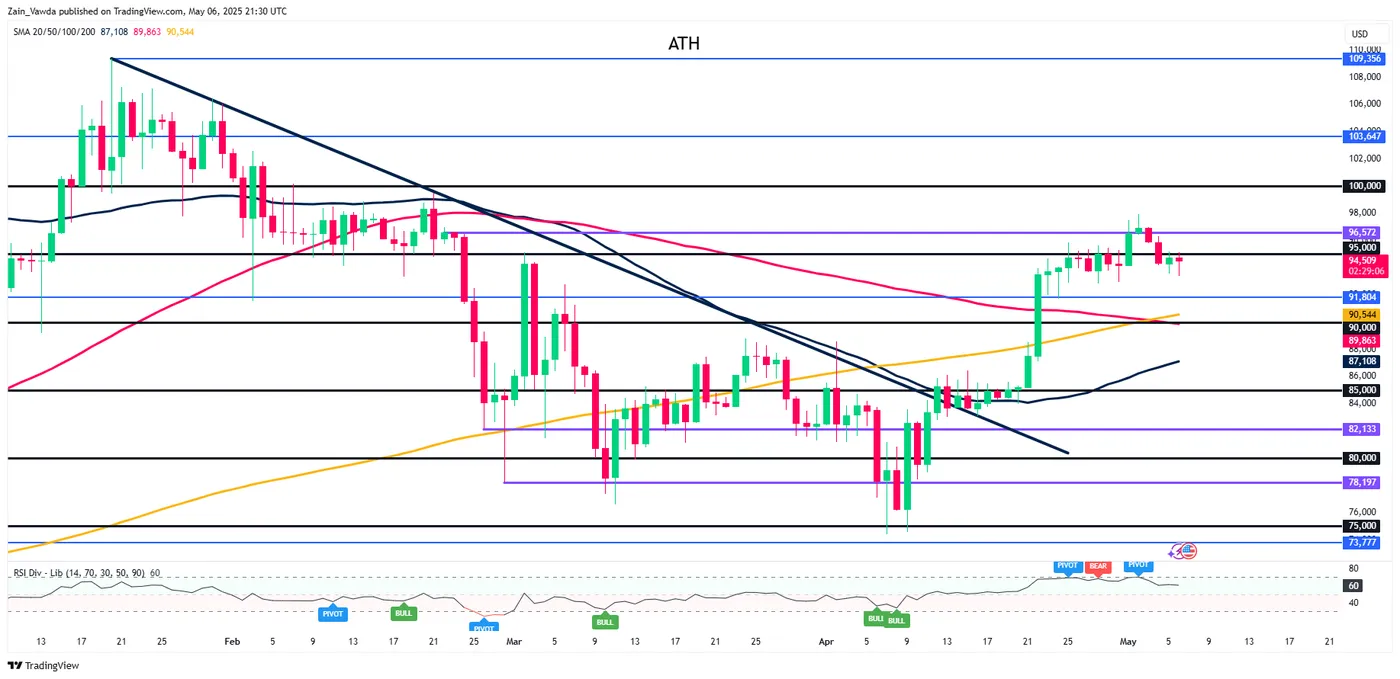
Source: TradingView.com (click to enlarge)
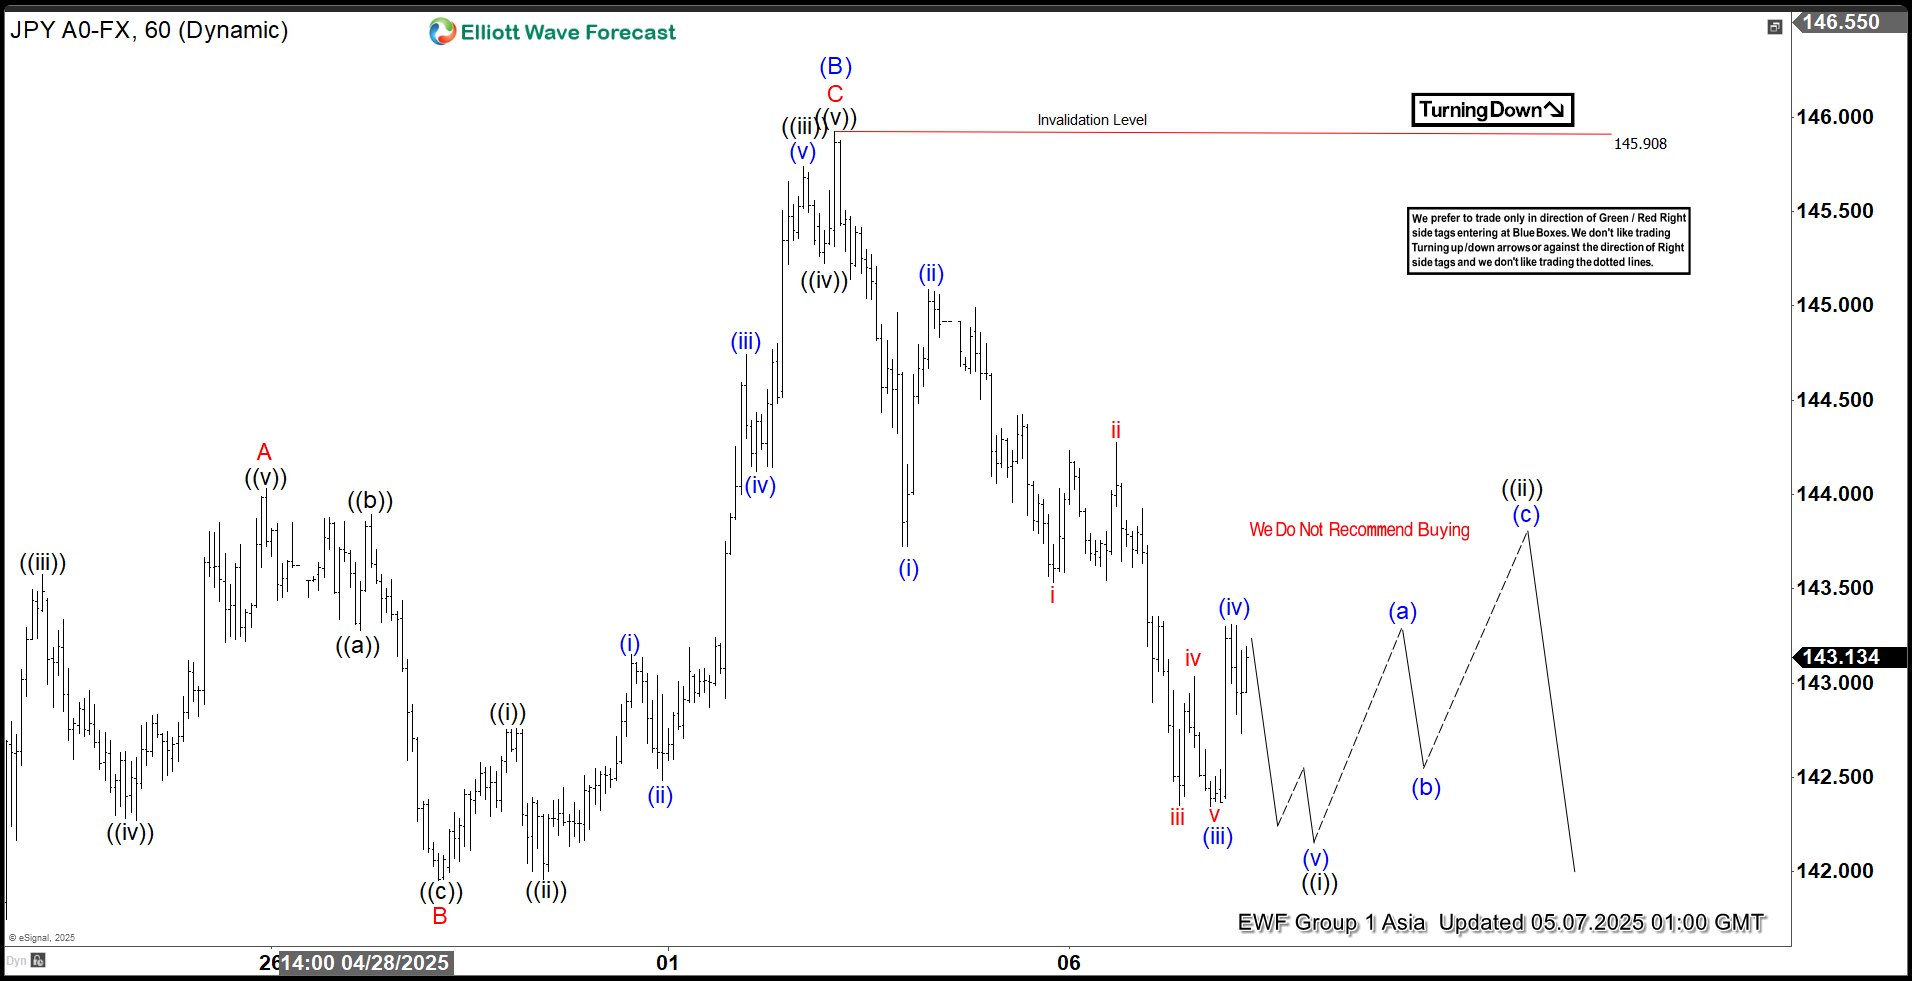
USDJPY Forecast: Elliott Wave Signals Resumption of Bearish Momentum
The USD/JPY currency pair is showing a bearish trend that began on July 3, 2024, and is expected to continue declining toward the 136.50 level. In the short term, the price movement since the March 28, 2025 high is forming a zigzag pattern, according to Elliott Wave analysis.
From the March 28, 2025 high, the decline in wave (A) reached 139.89. This was followed by a corrective wave (B), which also unfolded as a zigzag. Within wave (B), the price rose to 144.03 (wave A), then dipped to 141.95 (wave B). Afterwards, it climbed to 145.90 (wave C), completing wave (B). The pair has since turned lower, starting wave (C).
Wave (C) is currently developing as an impulse pattern in Elliott Wave terms. From the May 2, 2025 high, the price dropped to 143.72 (wave (i)), then rallied to 145.08 (wave (ii)). The decline resumed, reaching 142.34 (wave (iii)). A corrective rally in wave (iv) is believed to have finished at 143.30. The pair is now expected to decline further to complete wave (v). This will finalize wave ((i)) in the larger structure. After this, a corrective rally in wave ((ii)) should occur, partially recovering from the May 2, 2025 high, before the downward trend resumes.
In the near term, as long as the high at 145.90 holds, any upward movements are likely to be limited and fail in a pattern of 3, 7, or 11 swings, leading to further declines.
USDJPY 60 Minute Elliott Wave Chart
USDJPY Video Analysis
https://www.youtube.com/watch?v=HesFdqWZ1wM
XAU/USD Analysis: Chart Indicates Elevated Volatility
The XAU/USD chart shows that the ATR (Average True Range) indicator has reached its highest level in several weeks, signalling increased market volatility.
In addition, trading activity is being fuelled by heightened geopolitical tensions, now including an escalation of the conflict between India and Pakistan.
The price action analysis of the precious metal also provides valuable insight, highlighting the ongoing battle between supply and demand.
Technical Analysis of the XAU/USD Chart
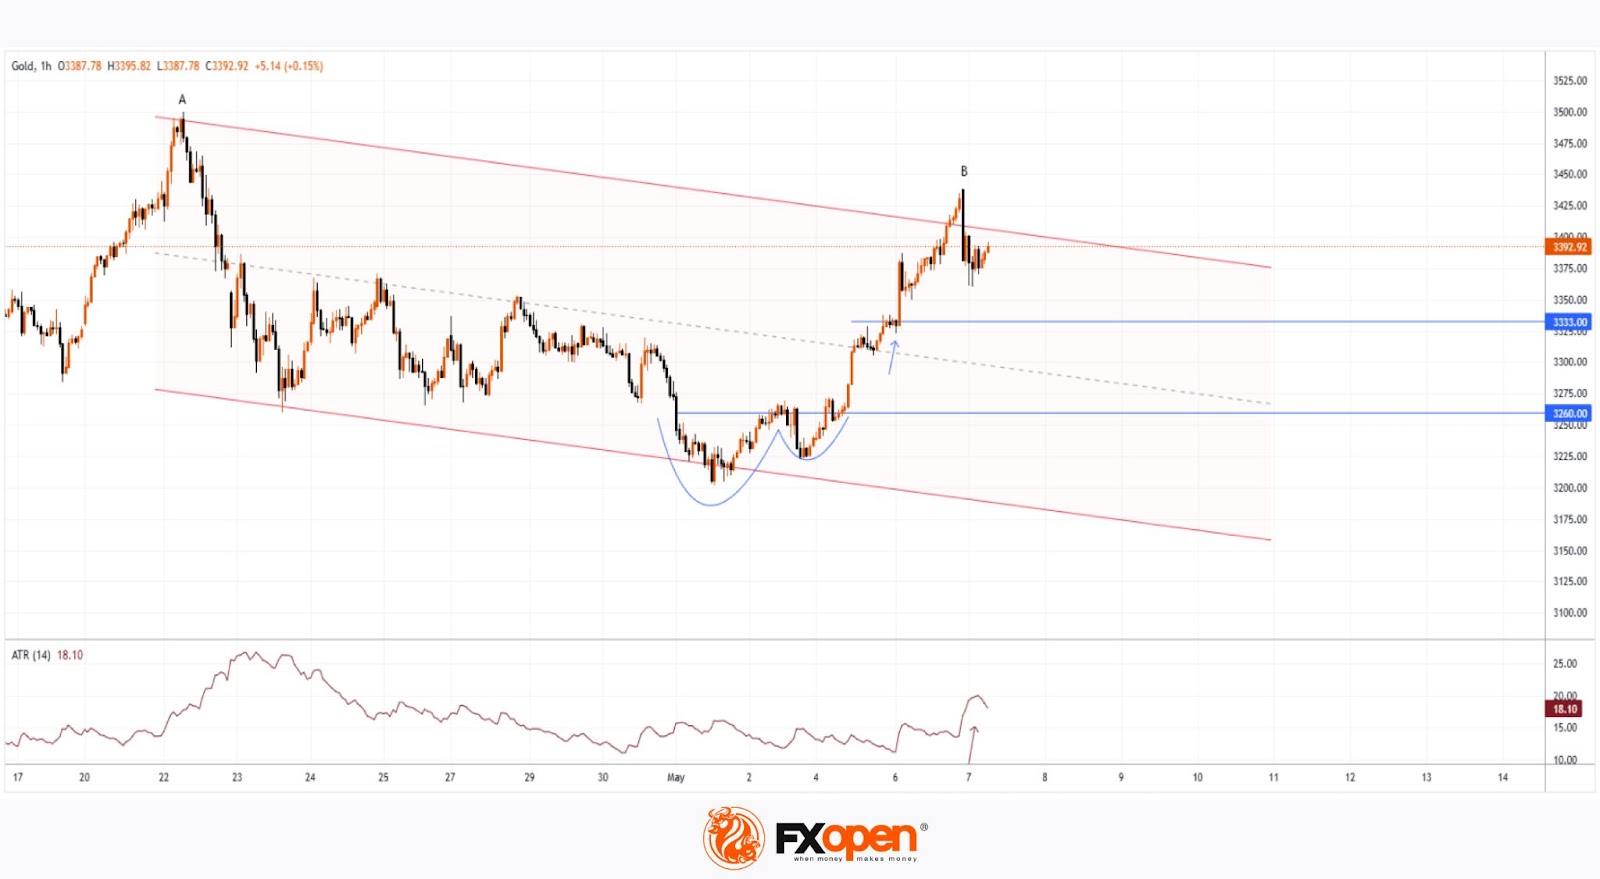
On 23 April, we noted a sharp shift in sentiment after the price of XAU/USD peaked around $3,500.
Gold price fluctuations today suggest continued bearish pressure above $3,400, leading to a downward reversal at peak B, which sits below the previous high at A.
This forms the basis for outlining a descending channel and suggests that bears may attempt to keep the price within its boundaries. On the other hand, the $3,333 level was decisively broken by a wave of buying (shown with a blue arrow), and a bullish “cup and handle” pattern is emerging in the background — it is possible that, as part of the May rally, bulls may try to surpass peak B.
Whatever the outcome, elevated volatility appears likely to persist — especially with the US Federal Reserve’s interest rate decision due today at 21:00 GMT+3, followed by Jerome Powell’s press conference at 21:30.
Start trading commodity CFDs with tight spreads. Open your trading account now or learn more about trading commodity CFDs with FXOpen.
This article represents the opinion of the Companies operating under the FXOpen brand only. It is not to be construed as an offer, solicitation, or recommendation with respect to products and services provided by the Companies operating under the FXOpen brand, nor is it to be considered financial advice.
Initial Risk-On Sentiment, Fuelled by US-China Trade Talks Optimism, May be a Head Fake Rally
Two-way volatility returned to the US stock market, with major indices declining for a second consecutive session during the overnight US trading on 6 May. The pullback was driven by rising concerns over the economic fallout from trade tariffs, as several US companies flagged risks during their earnings conference calls. These warnings added to market unease surrounding global trade tensions.
The S&P 500 fell by 0.8%, while the Nasdaq 100 dropped 0.9%. The Dow Jones Industrial Average and the Russell 2000 declined by 1.0% and 1.1%, respectively.
Adding to the uncertainty, US President Trump indicated a shift in trade policy strategy, stating that tariff levels and concessions would now be determined unilaterally, rather than through traditional negotiation. In response, the European Union warned that it is prepared to impose tariffs on up to US$113 billion of US goods should ongoing trade talks with Washington fail to produce a satisfactory agreement.
Meanwhile, sentiment improved in early Asian trading today, 7 May, following reports that China’s Vice Premier He Lifeng has been appointed as chief trade negotiator. A meeting with US Treasury Secretary Bessent and US Trade Representative Greer has been confirmed for the upcoming weekend (10–11 May) in Switzerland.
This news lifted S&P 500 and Nasdaq 100 E-mini futures by 0.8% during the Asian session. The US dollar also strengthened, particularly against safe-haven currencies like the Japanese yen and Swiss franc, gaining 0.5% at the time of writing.
However, the upcoming US-China discussions are widely seen as preliminary and aimed at easing tensions rather than finalizing a trade deal. As such, the current rally in index futures may be a short-lived “head fake,” rather than the start of a sustained rebound.
Gold (XAU/USD) saw a modest pullback, falling 1.6% in today’s Asian session after rallying nearly 6% over the previous two days. Despite this correction, the short-term uptrend remains intact, with the yellow metal still trading above its 20-day moving average, which is providing intermediate support around US$3,297.
In China, the People's Bank of China (PBoC) lowered its seven-day reverse repurchase rate from 1.5% to 1.4% and cut the reserve requirement ratio (RRR) for banks by 50 basis points to support domestic demand and offset the impact of US tariffs. PBoC Governor Pan noted that the RRR cut would inject approximately 1 trillion yuan in long-term liquidity. These policy actions boosted investor confidence, lifting the Hang Seng Index by 1.5% in today’s Asian opening.
Economic data releases
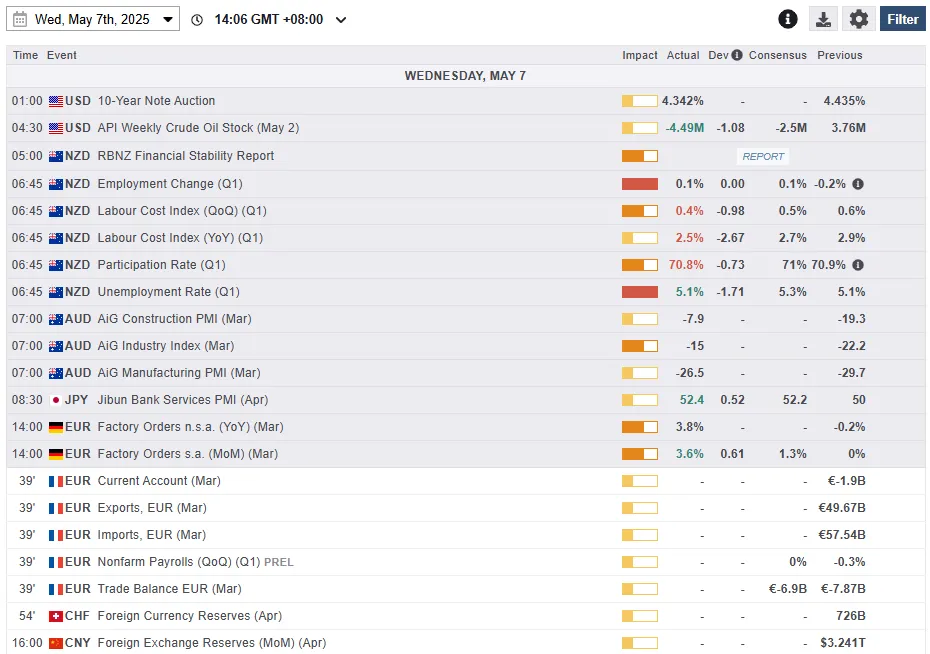
Fig 1: Key data for today’s Asian mid-session (Source: MarketPulse)
Chart of the day – Gold (XAU/USD) pull-backed but short-term uptrend remains intact
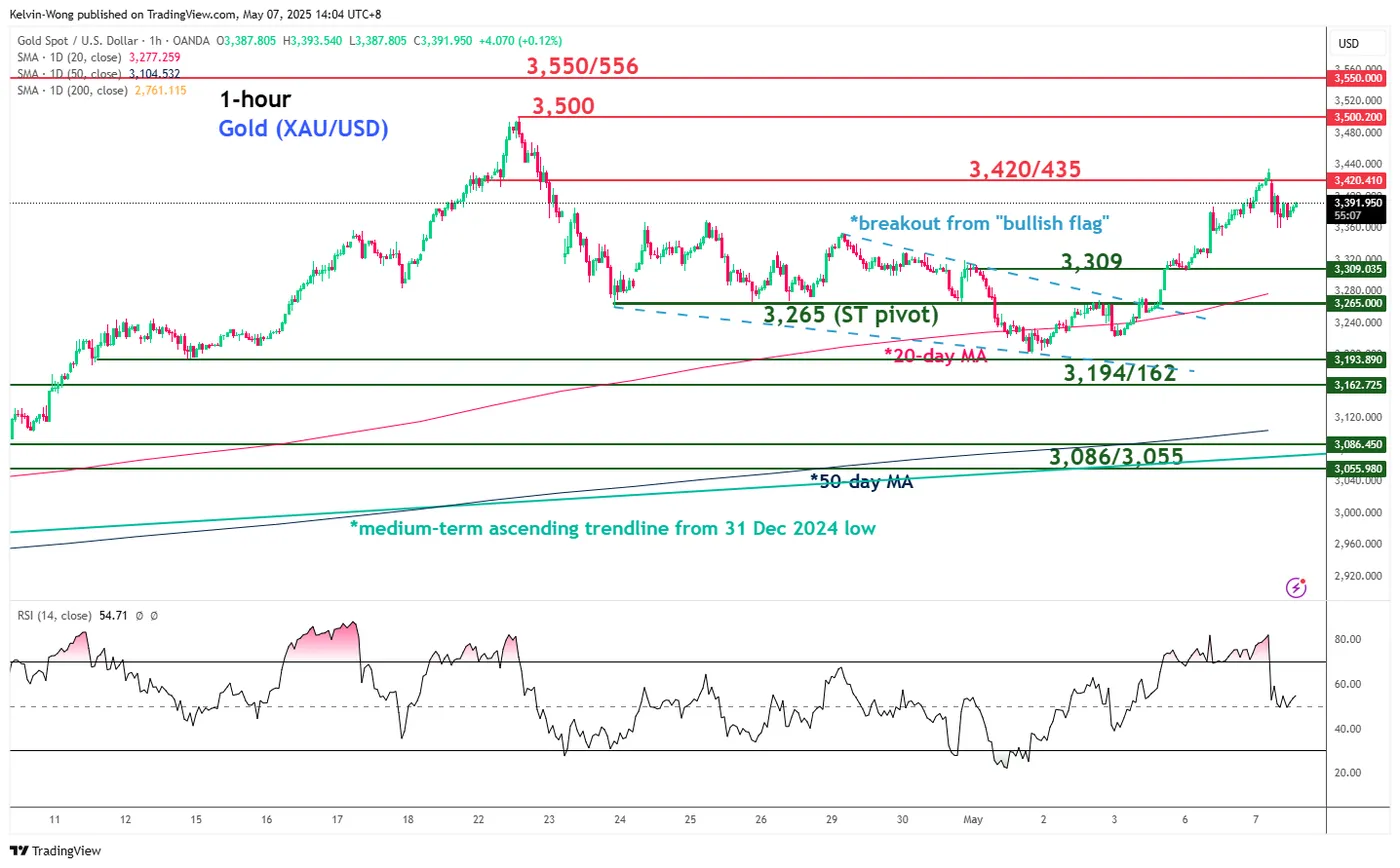
Fig 2: Gold (XAU/USD) minor trend as of 7 May 2025 (Source: TradingView)
Gold (XAU/USD) has staged an intraday pull-back of -2.1% in today’s Asian session from yesterday’s 5 May US session high of US$3,435.
The current weakness is likely a corrective pull-back rather than the start of a multi-week corrective decline sequence after two consecutive sessions of total positive gains of 6% that led the hourly RSI momentum indicator to hit an extreme overbought level of 82 yesterday (see Fig 2).
Also, Gold (XAU/USD) has just staged a bullish breakout from its prior two-week (22 April to 1 May) “bullish flag” configuration.
Watch the US$3,265 short-term pivotal support (also close to the upward sloping 20-day moving average), and a clearance above the near-term resistance zone of US$3,420/3,435 may increase the odds of another bullish impulsive up move sequence for a retest on its current 22 April all-time high of US$3,500 before the next intermediate resistance comes in at US$3,550/3,556.
However, a break below US$3,265 invalidates the bullish scenario for another round corrective decline extension to expose the next intermediate support zone at US$3,194/3,162.
Trading the FOMC Meeting: Key Levels & Analysis for EURUSD and USDJPY
How are Economic Data and Inflation Shaping the Outlook?
This week, financial markets are keenly focused on the upcoming FOMC Federal Funds Rate decision, the FOMC statement, and the subsequent FOMC press conference. Significant uncertainty surrounds US interest rate projections due to the ongoing divergence between market expectations and the Federal Reserve's outlook for the remaining part of 2025 and early 2026. A key point of division within markets is how tariffs will influence the overall US economy. Recent data revealed a slowdown in US GDP for the first quarter of 2025, largely attributed to a surge in imports driven by tariff front running. Conversely, the US job market has shown strength, and inflation, measured by the Core PCE, the FED’s preferred inflation gauge, has been slightly lower.
Specifically, the US nonfarm payroll in April exceeded forecasts, although some views suggest that the strength may not last, while the March’s Core Personal Consumption Expenditure (Core PCE) M/M dropped to 0.0% from 0.3% and the Y/Y was 2.3% compared to 2.5%. Market participants are split on the Federal Reserve's potential rate cuts, with some anticipating faster cuts due to the slowing economy and low inflation, while others believe concerns about tariff-induced inflation will lead to slower cuts.
Why is Powell's Press Conference So Important?
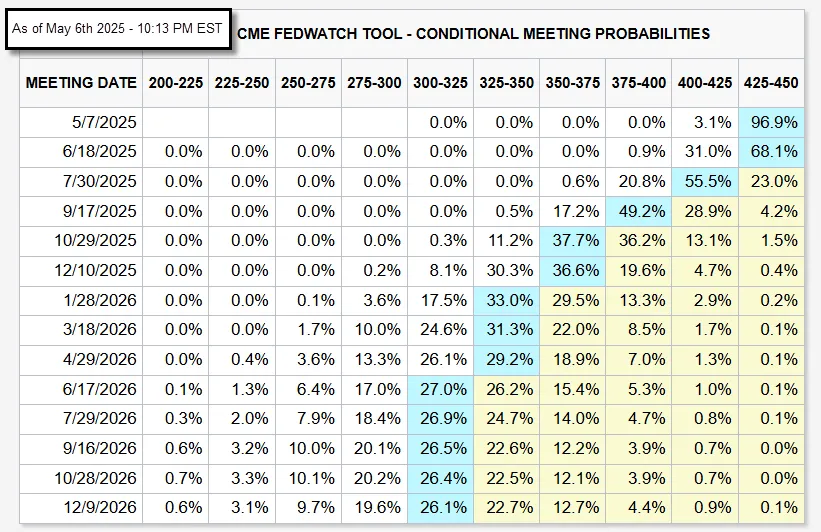
CME FedWatch Tool Source: https://www.cmegroup.com/markets/interest-rates/cme-fedwatch-tool.html Past Performance is not indicative of future results.
According to the CME FedWatch tool, 97.8% of market participants expect that interest rates will remain unchanged at the upcoming May 7th, 2025 meeting. The FOMC statement is expected to acknowledge tariff concerns among policymakers, but it may not provide clear hints on future rate expectations. The statement will be scrutinized for any significant change in language from prior statements such as “Uncertainty around the economic outlook has increased” or “Inflation remains somewhat elevated”
During the press conference, Federal Reserve Chair Jerome Powell's remarks on the impact of tariffs will be crucial. The Fed’s Chairman may emphasize that the Federal Reserve remains data dependent and caution that market expectations can sometimes be overly optimistic. Currently, markets anticipate more interest rate cuts than the Federal Reserve's official forecast, with a notable difference in the number of expected basis point reductions.
EUR/USD Technical Analysis Overview
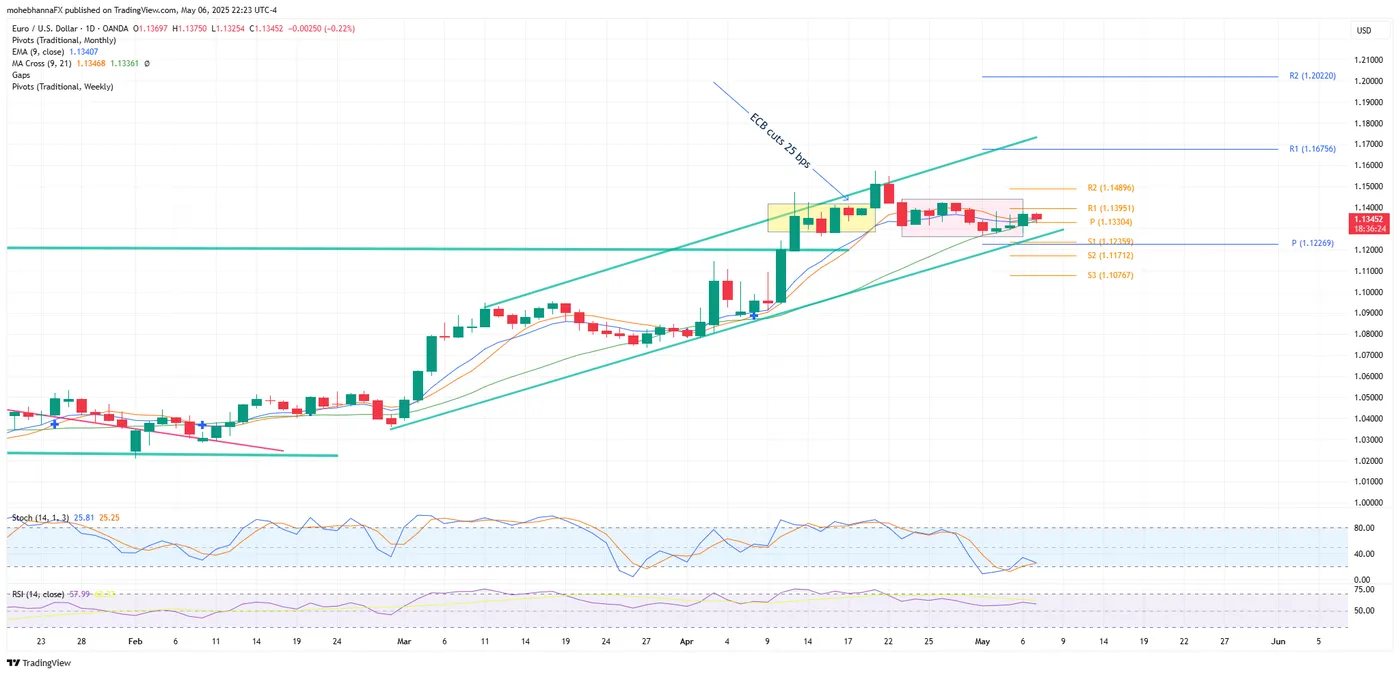
EURUSD Daily Chart Source: https://www.tradingview.com/ Past Performance is not indicative of future results.
- Price Action Analysis has been trading within an Ascending Channel Pattern since early March 2025. A period of Market Consolidation Zone (highlighted in yellow) occurred along the upper boundary of this channel in mid-April, coinciding with the ECB Interest Rate Impact announcement on April 17th, 2025.
- Following this Consolidation, the price initially rose but subsequently declined from 1.1500 back to the 1.1280 range. Currently, a second Consolidation period (highlighted in light red) is underway within the same price range as the previous one, emphasizing the significance of the 1.1280 to 1.1400 range for potential long-term expectations.
- Pivot Point Levels indicate that Price Action is currently trading above its monthly pivot point of 1.1226, which intersects with the lower border of the Ascending Channel Formation and weekly S1, forming a confluence of support below price.
- Moving Average Confluence is observed as Price Action trades within a narrowing range between converging fast and intermediate moving averages. These averages intersect with the weekly Pivot Point of 1.1330, creating a critical resistance level that has held since Thursday of last week, highlighting the importance of this price level.
- The Stochastic Oscillator indicator aligns with Price Action, currently in oversold territory, with the %K line crossing above the %D line.
- The Relative Strength Index (RSI) Levels also align with Price Action, although it remains near its overbought territory.
USD/JPY Technical Analysis Overview
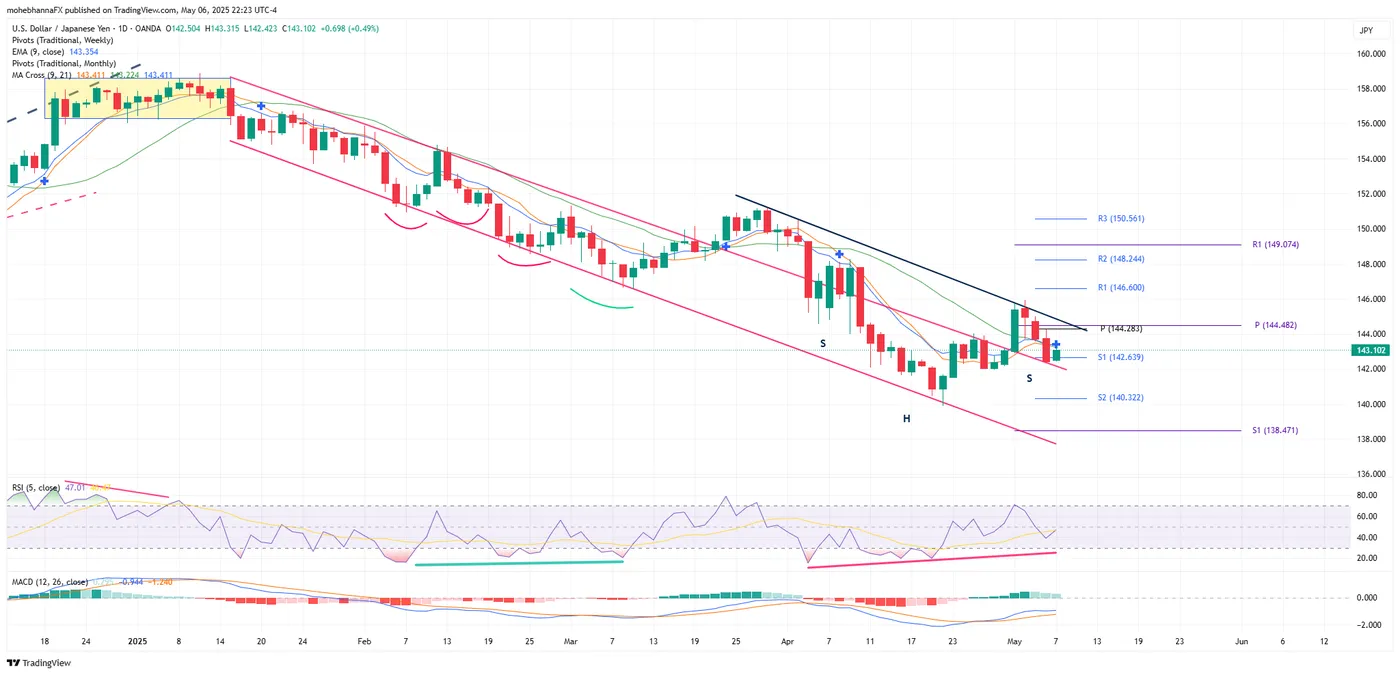
USDJPY Daily Chart Source: https://www.tradingview.com/ Past Performance is not indicative of future results.
- Since early January 2025, the price trend has been confined within a descending channel. After several unsuccessful attempts, the price action successfully broke out above the channel's upper boundary. A subsequent throwback occurred, finding support at the S1 support level of 142.63 and the broken channel line extension.
- A potential inverted head and shoulders pattern (H, S) is forming, with its neckline intersecting both the weekly pivot point and monthly pivot point, creating a significant resistance confluence between 144.28 and 144.48.
- Another nearby resistance confluence exists due to the convergence of the EMA9 (Exponential Moving Average 9), SMA9 (Simple Moving Average 9), and SMA21 (Simple Moving Average 21), which represent short-term and intermediate-term moving averages.
- A positive divergence is observed between the price action (making lower lows) and the RSI (Relative Strength Index) (making higher lows). The Stochastics indicator aligns with the price action, as its %K line has crossed above the %D line.
Conclusion
The potential strength of the US dollar hinges on how strongly Federal Reserve Chair Jerome Powell communicates a hawkish stance and suggests that markets may be overestimating future interest rate cuts. Such messaging could lead traders to reduce their expectations for rate cuts, thereby strengthening the dollar. From a technical analysis perspective, if the inverted head and shoulders pattern on the daily chart completes, a sustained break above 144.80 could signal further gains for the US dollar against the Japanese Yen, however, should the price fail to hold above 142.30, this could indicate a renewed decline in USD/JPY, potentially pushing it back into the descending channel.
Chinese Markets Give a Lukewarm Welcome to PBOC Easing Measures
Markets
Yesterday’s quite European trading session was interrupted by German parliament. Lawmakers unexpectedly and narrowly turned down CDU-leader Merz’s first bid to get the Chancellor nomination (310 votes). On second attempt, he received 325 votes in the Bundestag, exceeding the 316 necessary in the 630-seat parliament. The episode nevertheless highlights the fragility of the new ruling coalition between CDU/CSU and SPD (328 seats combined). German equities dipped by 2% intraday, but recovered most of these losses by the closing bell. The impact on German Bunds was negligible. The German yield curve bear steepened in the end with yields up to 3.1 bps higher at the very long end of the curve. Fiscal initiatives by the new government are expected by summer. US Treasuries recovered somewhat from the past days’ losses with yields falling by 3.7 bps (30-yr) to 5 bps (2-yr). Strong demand at the US Treasury’s $42bn 10-yr Note sale provided some support. EUR/USD was rangebound between 1.13-1.14.
Chinese markets give a lukewarm welcome to PBOC easing measures this morning (see News & Views). The confirmation of a first high level meeting between US and Chinese officials in Geneva this weekend equally fails to really lift spirits. Talks between Treasury Secretary Bessent and Chinese vice premier He Lifeng mostly serve to de-escalate the situation rather than really start discussions future trade relations. Underperformance at the very long end of the Japanese yield curve (30-yr +8.5 bps; about to set YTD high) is something to monitor with the US note future and especially the German Bund also showing signs of weakness. Focus shifts to the Fed today. The US central bank is expected to keep rates steady and signal no intent to break the deadlock any time soon. The trade-off between downside risks to the maximum employment goal and upside risks to price stability clearly tilt to the latter. Not only because of the expected impact from tariffs on already above target inflation, but also from the self-fulfilling risk coming from surging inflation expectations for consumers and companies. We stick to the view that the Fed rate cut pause will last at least over summer. The Powell Fed has a track record of wanting to be very sure and then going fast. If the labour market breaks, they’ll be inclined to use the ample policy room towards neutral levels as soon as possible. They showcased that last September by kicking off with a 50 bps rate cut. That contrasts hugely with the US money market view of pre-emptive 25 bps rate cuts. A hawkish Fed could hurt risk sentiment and weigh on US Treasuries. EUR/USD 1.1276/74 could be tested again. The Czech National Bank’s policy meeting is a wildcard (cut discounted, pause possible) as it could be indicative on central bank’s reaction functions given the uncertain growth/inflation outlook.
News & Views
Asian currencies are on a tear these last couple of days. The likes of Malaysian ringgit, the Taiwanese dollar and the Hong Kong dollar all printed several percentage points gains against their US counterparts. The common factor underpinning the recent surge is rising hope of trade deals, both between the US and Asian economic heavyweight China as well as between the US and several other regional countries. That in turn happened in the wake of several (constructive) trade reports by end last week, including ones that suggest the US-Sino relationship is thawing. The Taiwanese dollar in particular was supercharged by speculation fueled by local press that the government would allow the currency to appreciate as part of trade talks with the US. At some point it strengthened almost 9% over four days. Monetary authorities in Hong Kong have been forced to step in the FX market to protect the currency peg. The HK dollar rose to the strong end of the USD/HKD 7.75-7.85 trading band, prompting already four USD sale operations since Friday which triggered the biggest short-term interest rate drop since 2008.
After enjoying the May 1 – May 5 holidays, China’s onshore yuan also traded significantly stronger on yesterday’s first trading session of the month. That followed the trend set by the offshore CNH, which did trade during CNY’s absence. By setting the daily CNY fixing still above the symbolical 7.20 rate, however, China’s central bank (PBOC) signals it does not want its currency to strengthen an awful lot since a weak(er) currency acts as a shock absorber in the still-ongoing trade conflict with the US. With this in mind, the PBOC today also reduced its main policy rate (seven-day repo rate) to 1.4% from 1.5% and trimmed the reserve requirement ratio by 0.5 ppts. Lowering borrowing costs and releasing liquidity were just a few of the measures announced by governor Pan in a bid to support the economy. USD/CNY recouped some of yesterday’s losses as a result, rising to 7.226 this morning.
Futures Rise on News of Upcoming US–China Tariff Talks
The futures are in the positive this morning on news that the trade talks between the US and China could lead to progress, as the Chinese Premier will reportedly meet US Treasury Secretary Bessent later this week to discuss tariffs. It’s possible that we hear about significant cuts to the recent tariff rates the two giants imposed on each other. But the tariffs are so high – 145% for Chinese goods imported into the US and 125% for US goods imported into China – that even a significant improvement might not satisfy China, which continues to prepare for a potentially prolonged war.
The People’s Bank of China (PBoC) freshly lowered its policy rate and reserve ratio today in an effort to strengthen its monetary support for the Chinese economy, which is seeing a slowdown in activity. As such, the CSI 300 is better bid this morning – the index is back to April 2nd levels, when Trump blew the world’s mind with his unreasonable tariff levels – while the Hang Seng jumped above its 50-DMA, though gains remained fragile and were mostly given back by the time of writing.
The US dollar is slightly positive this morning, as the selloff against Asian currencies cools. Good news from the Chinese front could bring back hopes and risk appetite. The latter would result in a recovery in the US dollar and a further rebound in equities.
But uncertainties persist
In America, Trump’s meeting with Canadian PM Carney was less catastrophic than it could have been, but no deal is on the horizon yet. On the European front, the EU said it would hit EUR 100bn worth of US goods with additional tariffs if there is no deal by the end of the famous 90-day negotiation period – on top of the EUR 21bn of goods already targeted.
Meanwhile – and unsurprisingly – the US trade deficit hit a record high in April as companies rushed to import goods into the US before the tariffs took effect. Canada’s exports to the US saw the biggest decline since 2020: exports tumbled 6.6%, imports fell nearly 3% on reluctance from Canadians to buy US goods.
The good news for Canadians is that exports to other countries jumped nearly 25% – yes, 25% – almost fully offsetting the loss from US trade. The Loonie strengthened by almost 10 figures since the February peak against the US dollar despite a persistent fall in oil prices – similar to other majors that also saw their valuations surge amid rising trade tensions. This was totally unexpected at the start of the year.
The trade war was supposed to boost demand for the safe-haven USD, but that didn’t happen. And as days go by, it becomes clearer that countries are not willing to play along, and Trump is losing his influence – a situation that could lead him to back off and de-escalate.
The latter would come at a good time, as the tariff crisis is taking a toll on US earnings forecasts: companies have kept insisting that the tariffs would be bad for business – duh – and some even scrapped their earnings guidance because it’s too hard to see what will happen tomorrow.
Inside equities, we’re also starting to see a divergence among the so-called Mag 7 companies: firms with complex supply chains – and therefore exposed to tariffs – like Tesla, Apple, Amazon, and Nvidia are under greater pressure than companies whose products haven’t yet been targeted, like Google, Meta, and Microsoft. Though note that these tech giants could also find themselves in the crossfire if tensions between the US and Europe rise again. Europeans are coming after US Big Tech... with their regulators.
On top of that, Tesla sales in Europe continue to decline – a reaction to Elon Musk’s political support for the extreme right. Sales in Sweden were down more than 80% in April. And according to Electrek, BYD outsold Tesla in both Germany and the UK in April. The company’s sales in Germany rose by – I hope you’re sitting – 756% in April.
Any good news from the Chinese front may not help Tesla much, but will probably open the door to other negotiations – and hopefully good news.
Decision time
What do you do if you’re a Federal Reserve (Fed) President and must decide what to do with monetary policy to – at least – not make matters worse? Well, I guess you just wait. You wait to see if the negotiations lead to trade agreements, you wait to see the impact of tariff uncertainty on your growth and inflation metrics, you wait to see demand for the US dollar and US Treasuries in this newly shaping world order. And more importantly, you avoid making decisions in a hurry.
So, the Fed, which will announce its latest policy decision today, is expected to bring no changes to monetary policy and say it will monitor market conditions and the data carefully before announcing the next rate cut. Make no mistake: what Powell says in his press conference today is more important than the decision itself.
If Powell still thinks the tariff-led inflation boost could be more than just temporary – and should be addressed accordingly – the USD and US markets won’t like the news. If, however, Powell softens his stance to join other Fed members in showing willingness to support the economy, we could see sentiment in USD and equities improve.
But the Fed is not the only major factor driving appetite these days. Whatever the Fed says, it's trade news that will likely set the tone.
Merz Overcomes Initial Setback to Become Germany’s Chancellor
In focus today
This evening the Federal Reserve May meeting takes place, where we expect the Fed to keep an unchanged monetary policy, in line with consensus and market pricing. While we expect the Fed to resume cutting rates in June, we doubt Powell will opt for clear forward guidance amid the tariff uncertainty. Read more in our Research US - Fed preview: Waiting calmly before the storm, 5 May.
In the euro area, we look out for March retail sales data, which could reveal if the weaker consumer confidence recorded in the previous months have started to affect spending. So far, retail sales have been flat in the past six months, following a strong rise in the first half of 2024.
This morning in Sweden, we receive preliminary inflation numbers for April. We expect CPIF at 2.5% y/y and CPIF ex energy at 3.2%, close to the Riksbank's forecast at 2.3% y/y and 3.2%, respectively. No details will be provided until next week. This is the last piece of information for the Riksbank ahead of today's policy decision, due for announcement tomorrow.
Economic and market news
What happened overnight
In China, the central bank announced a series of measures to further ease monetary policy. This includes cutting the reserve requirement ratio, lowering key policy rates and interest rates for specific sectors and a new re-lending facility to support the service sector. The recent appreciation of the yuan has made more room for easing monetary policy. China has generally been reluctant to ease when there is weakening pressure on its currency. This stimulus should help a little on domestic demand in the light of the trade war with the US.
In South Asia, India carried out two air strikes on Pakistan following last month's militant attacks on tourists in the Indian-administered Kashmir region. India's defense ministry said it had targeted terrorist infrastructure, non-escalatory in nature. In an initial response, Pakistan Prime Minister Shehbaz Sharis deemed the strikes an act of war giving Pakistan every right to respond forcefully.
What happened yesterday
In Germany, chancellor Merz managed to secure 325 votes in the Bundestag to become chancellor. The vote was the second of the day, following a first vote where he failed to secure backing with only 310 of the required 316 votes. His coalition has 328 members, which shows that the members not voting for him wanted to teach him a lesson rather than sink his political career. He has probably realised that there is disagreement in the coalition and that he cannot steamroll his own decisions through. Hence, new reforms and policies will likely take more time to negotiate than previously thought, given the disagreement that is now visible. But still, the infrastructure fund and change to the debt brake have already been passed and the coalition have that money to spend.
In the euro area, the final composite PMI for April was revised up to 50.4 from 50.1 in the flash estimate. Hence, the economy experienced a small expansion in April according to the indicator. The higher final data was due to both sectors in the survey, as manufacturing PMI was revised up to 49.0 from 48.7 and services up to 50.1 to from 49.7. While manufacturing did not turn out as bad as feared given the recent trade uncertainty, the services PMI dropping from 51.0 in March is more worrying.
In Sweden, the services PMI for April declined to 48.4 and was marginally revised down for March to 49.3 from 49.4. The decline what somewhat unexpected due to recent NIER survey for the services sector remaining somewhat unchanged at 98.0 in April from 97.7 in March.
In Norway, seasonally adjusted housing prices declined 0.2 % m/m in April, confirming the signals of a somewhat weaker market the last couple of months. Details were slightly mixed, as the inventory to sales ratio dropped from 2.5 to 2.4, mainly driven by higher transactions, while the inventory of unsold houses rose further. This is the second month where the housing inflation is significantly below Norges Bank's estimate from the latest MPR (March: 0.1 % vs. exp. 0.7 % and April: -0.2 % vs. exp. 0.6 %). However, this is still more of a cooling down than outright weakness and should not affect monetary policy going forward.
Equities: Global equity markets continued their downward drift yesterday, though once again without a clear catalyst from either macroeconomic data or corporate earnings. The decline came despite a mixture of solid macroeconomic indicators and decent corporate results. Notably, cyclicals outperformed again, and European equities continued to show relative strength compared to US markets. Volatility ticked up slightly, with the VIX edging higher, but the broader trend suggests a market that is gradually settling down. Daily swings are narrowing, and intraday volatility has decreased, signalling a more stable equity environment. In the US yesterday, the Dow fell by 1.0%, the S&P 500 by 0.8%, the Nasdaq by 0.9%, and the Russell 2000 by 1.1%. Trade headlines are once again dominating sentiment this morning. Markets are digesting confirmation that US and Chinese officials will meet in Switzerland over the weekend for talks. Asian markets are trading higher, and futures in both Europe and the US point slightly upwards.
FI&FX: US Treasury yields declined after strong 10Y Treasury auction. Today we have the 30Y auction and the market will be looking for a similar demand at the auction. The euro strengthened versus the USD despite the political volatility in Germany. The main focus today is the FOMC meeting, where we expect that the Federal Reserve is on hold.
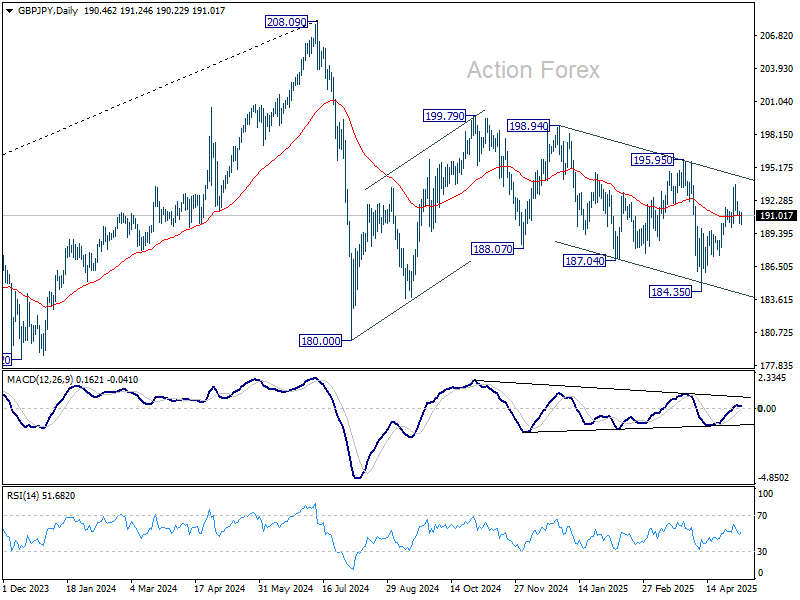
GBP/JPY Daily Outlook
Daily Pivots: (S1) 190.63; (P) 191.47; (R1) 191.92; More...
No change in GBP/JPY's outlook and intraday bias remains neutral. Further rise is expected as long as 189.97 support holds. Above 193.72 will resume the rise from 184.35 and target 195.95 resistance next. However, firm break of 189.97 will turn bias back to the downside for deeper decline.
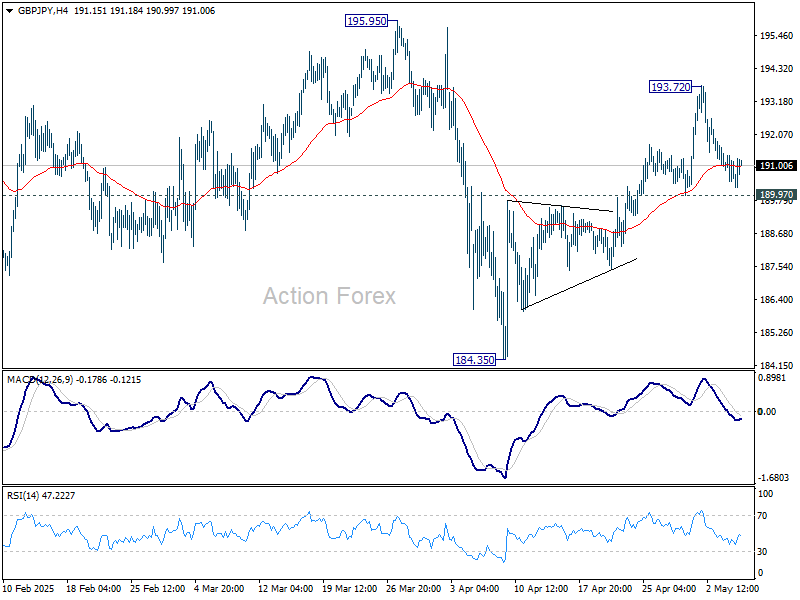
In the bigger picture, price actions from 208.09 are seen as a correction to rally from 123.94 (2020 low). Strong support should be seen from 38.2% retracement of 123.94 to 208.09 at 175.94 to contain downside. However, sustained break of 175.94 will bring deeper fall even still as a correction.
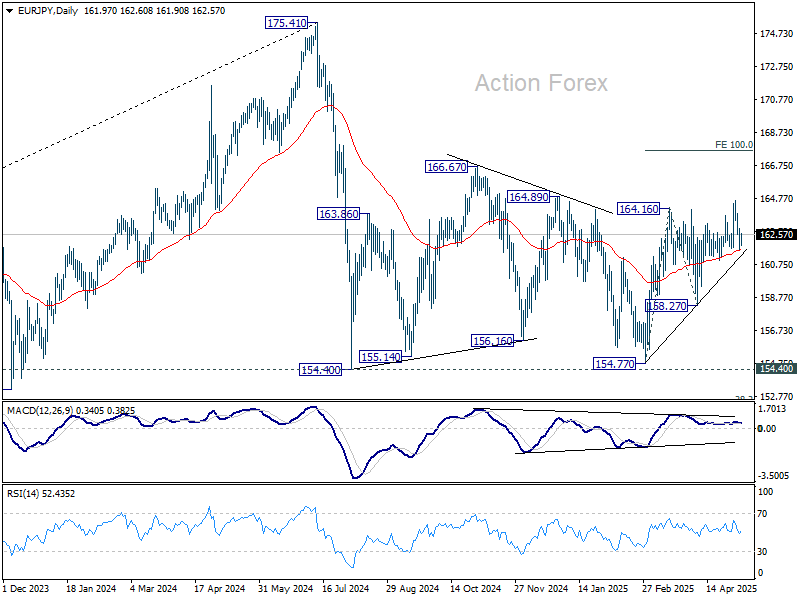
EUR/JPY Daily Outlook
Daily Pivots: (S1) 161.35; (P) 162.15; (R1) 162.71; More...
EUR/JPY recovered after breaching 161.68 support and intraday bias stays neutral. On the upside, above 164.61 will resume the rise from 154.77 to 100% projection of 154.77 to 164.16 from 158.27 at 167.66. However, sustained break of 161.68 will turn bias back to the downside for 158.27 instead.
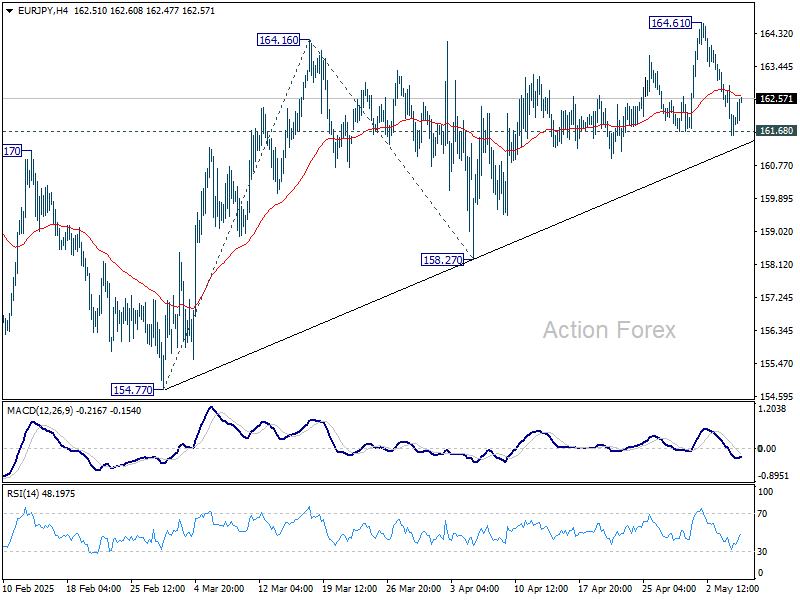
In the bigger picture, price actions from 175.41 are seen as correction to rally from 114.42 (2020 low). Strong support should be seen from 38.2% retracement of 114.42 to 175.41 at 152.11 to contain downside. However, sustained break of 152.11 will bring deeper fall even still as a correction.