Sample Category Title
Survival of the Fittest: OPEC+ Confirmed a Complete Reversal in Strategy
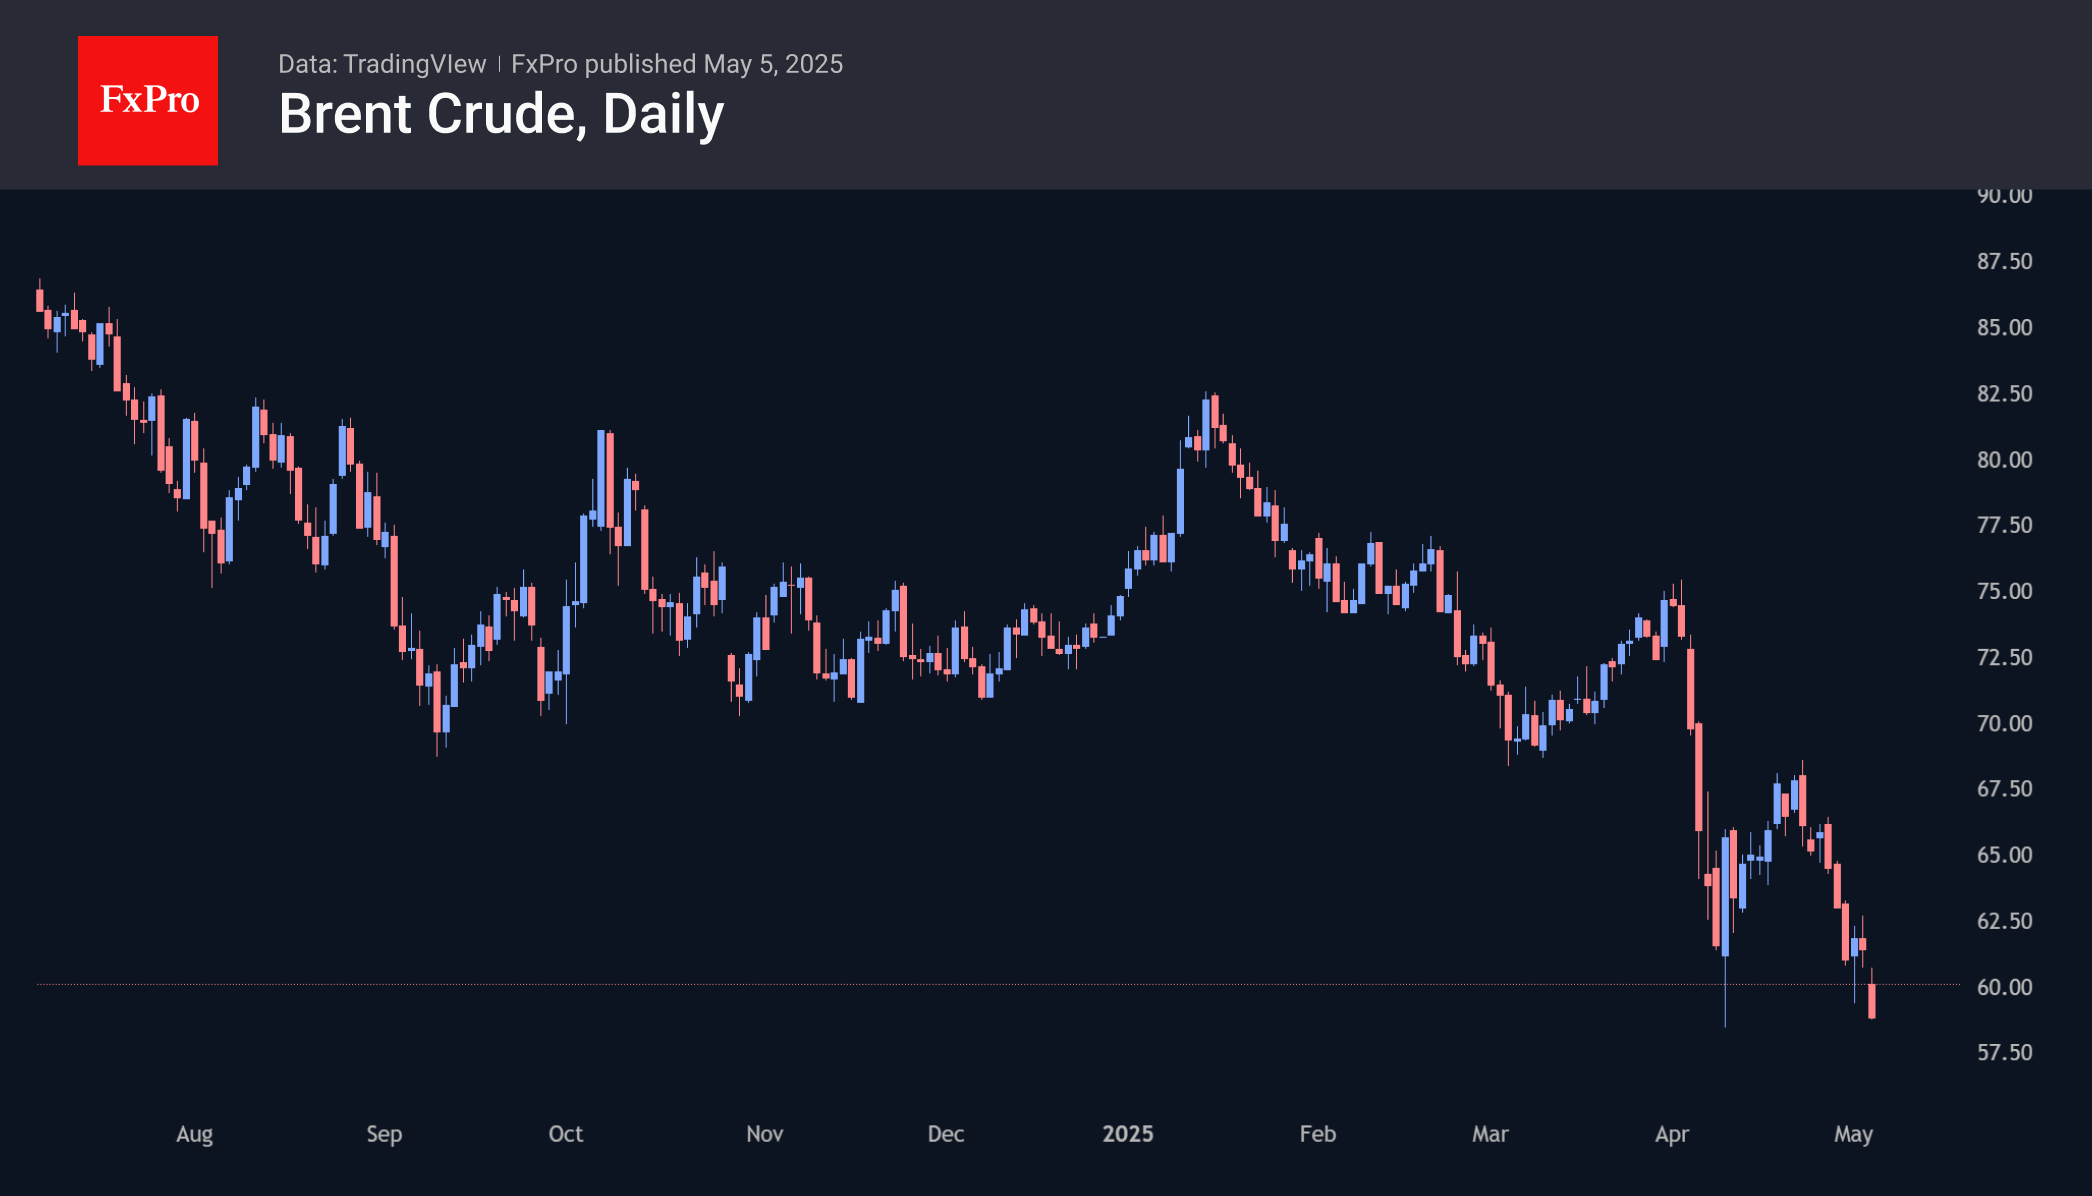
Oil opened this week down 4% after OPEC+ announced its intention to increase production by 411K bpd from June. The change represents the phasing out of voluntary restrictions by major producers, including Saudi Arabia and Russia, which previously totalled 2.2m bpd.
The decision surprised the market, which had expected an increase of about 244K barrels. Last month, an increase of 135 thousand barrels per day was forecast. These measures can be seen as Saudi Arabia’s response to the loss of market share caused by the active increase in production by competitors outside the cartel and the exceeding of quotas by several OPEC colleagues.
Saudi Arabia’s strategy assumes lower oil prices in the coming months, which will benefit only the most sustainable projects. Low production costs allow the Kingdom to realise this strategy. In addition, low hydrocarbon prices may affect the development of the renewable energy industry.
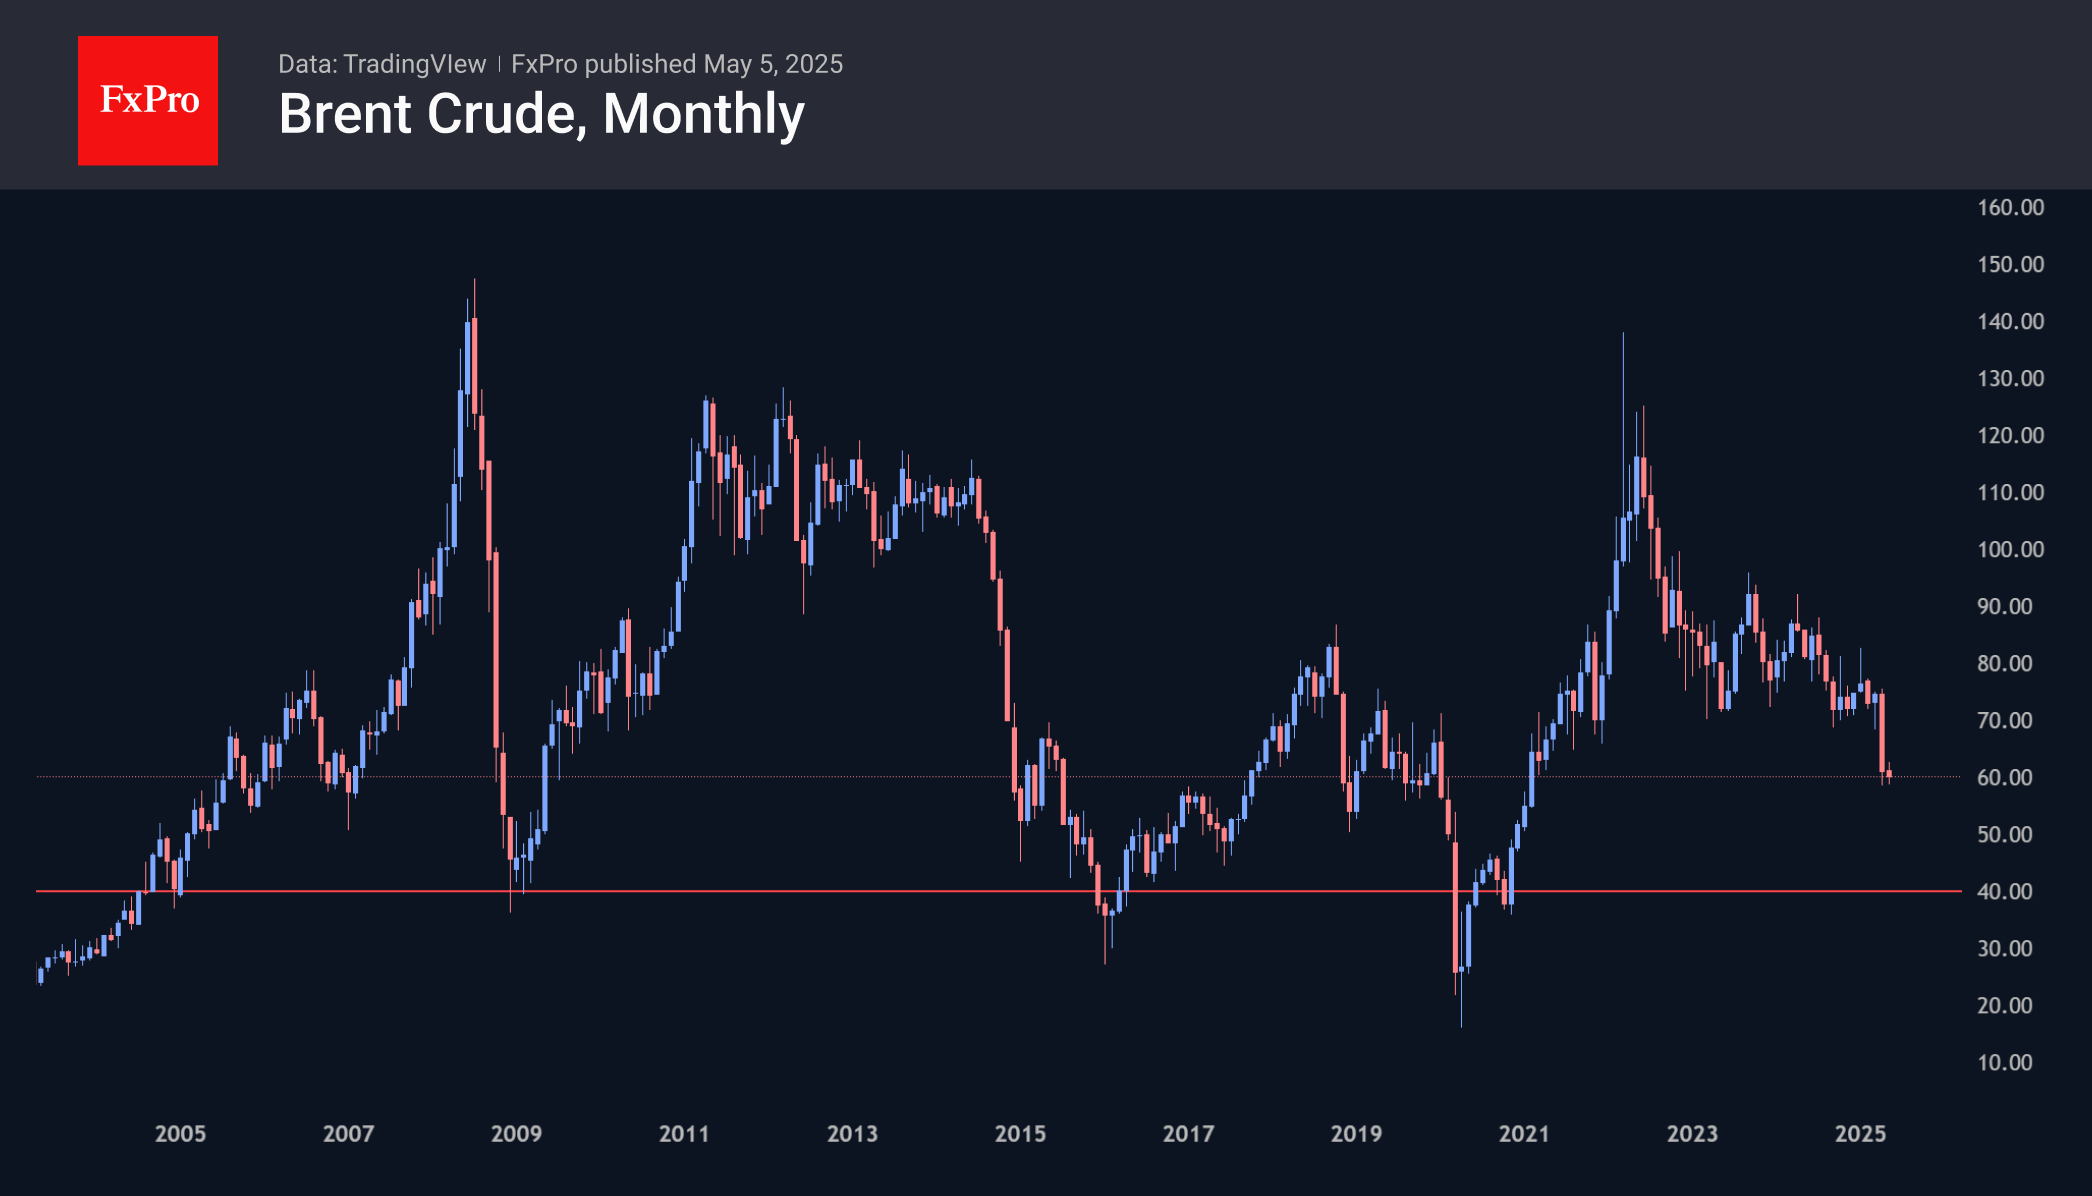
Saudi Arabia already used a similar tactic in 2014. Then, as is the case now, the price of oil was falling due to a slowdown in final demand and the desire to increase production, as well as high drilling activity in the US due to the shale revolution. From a peak in July 2014, the price fell by three-quarters, hitting a low a year and a half later.
Oil faced another perfect storm in 2020 when record US production coincided with a supply conflict between Russia and Saudi Arabia. The COVID-19 pandemic exacerbated the sell-off. As a result, Brent has lost around 72 per cent of its January 2020 peak, and nearby WTI futures have gone into negative territory.
In the current environment, a 70-75% decline in oil prices suggests a downturn to $20-25 per barrel of Brent. However, this scenario is for a possible market crash like March-April 2020. The price has not fallen below $35 per barrel Brent in the last 20 years, and the $40 area is soft support. When approaching these levels, major producing countries have shown a willingness to negotiate and coordinate.
Despite possible changes in this context, downside targets to the $40 area still look ambitious. Lower levels represent a disproportionate risk-return ratio. At prices below $50, many projects lose profitability, while their number increases significantly as we approach $40.
Gold: Strong Bounce Generates Initial Reversal Signal
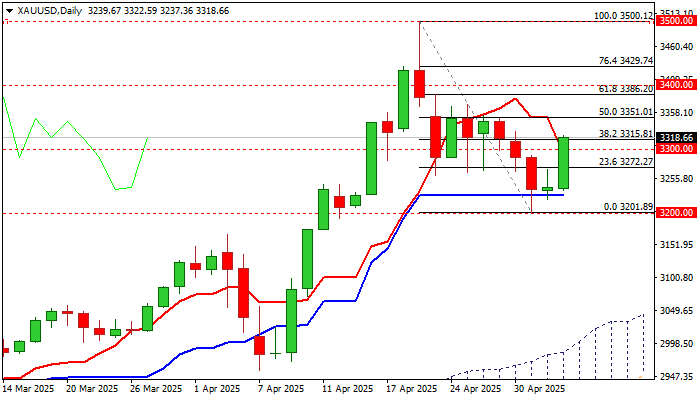
Gold jumped over 2% on Monday, lifted by weaker dollar and persisting uncertainty over US-China trade conflict that revived safe-haven demand.
Strong bounce followed repeated failure to register clear break of strong support at $3228 (50% retracement of $2956/$3500 upleg / daily Kijun-sen).
The metal’s price returned above $3300 mark and cracked important resistance at $3315 (10DMA / Fibo 38.2% of $3500/$3201 bear-leg) to generate signal that corrective phase from new all-time high may be over.
Reversal signal is developing on daily chart, as 14-momentum bounced into positive territory after touching the centreline, daily MA’s are about to turn to full bullish configuration, while today’s large bullish candle contributes to formation of reversal pattern.
Ability to hold above $3300 would keep near term bias with bulls, and daily close above $3315 to validate signal and open way for further recovery and expose targets at $3351 / $3386 (Fibo 50% and 61.8% retracement of $3500/$3201 respectively).
Markets will keep a close eye on development of US-China case and will also look for fresh signals about Fed’s monetary policy trajectory, as the FOMC meets this week and will announce its rate decision late Wednesday.
Res: 3328; 3351; 3370; 3386.
Sup: 3300; 3272; 3228; 3201.
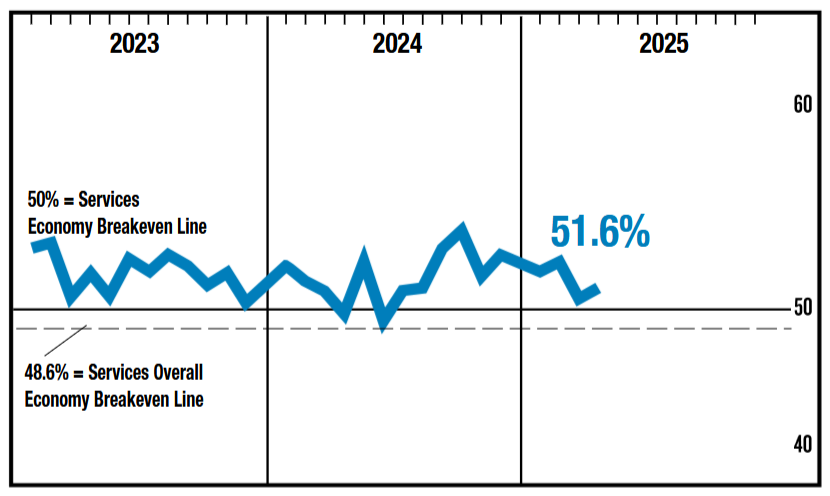
ISM Services Up Slightly in April
The ISM Services increased 0.8 points to 51.6 in April, beating expectations of a small decline. Eleven of eighteen industries reported growth in April, up from ten in March, though still below the 14 reporting expansion in January and February.
Business activity declined, falling 2.2 points to 53.7. New orders increased to 52.3, ending a streak of monthly declines and reversing a particularly weak reading (50.4) last month. The imports index registered a large decline (-8.3), falling to 44.3 and sending the sub-index into contractionary territory.
The employment index increased to 49.0 but remains in contractionary territory, suggesting services payrolls continued to decline in April. However, the employment index has signaled contraction several times since early 2024, while the labor market continued to expand.
The prices paid sub-component jumped up to 65.1 from 60.9 April, suggesting price pressures are heating up in the service sector.
Key Implications
The service sector expanded in April, but the details are less encouraging. While the overall index improved, business activity declined and it looks as though the service sector is feeling the effects of tariffs coming into place in April, cutting activity and imports at the same time.
Most respondents in this survey reported challenges to their operations and pricing from tariffs. The combination of areas which registered gains (new export orders, inventories, and prices) is indicative of businesses trying to get ahead of retaliatory tariffs or other policy changes and could foreshadow a deeper decline in the coming months. More importantly, the sharp increase in prices, coupled with the decline in activity, suggests the service sector could also be moving towards stagflation, something we have already seen in manufacturing.
Sunset Market Commentary
Markets
One of the biggest (and sole, really) movers in today’s uninspired session was oil. Brent crashed >4% during Asian dealings before recovering intraday. OPEC+ decided on Saturday to restore another 411k barrels of output in June. That’s the same amount they decided in April to do for May, which was also a huge surprise back then. It shows that OPEC (and Saudi Arabia) is eager to regain market share while punishing members with above-quota production. The balance of risks for oil prices remains tilted to the downside given tepid global demand. Dollar weakness is the name of the game on currency markets. EUR/USD trades higher around 1.1363, be it within the established narrow 1.13-1.15 range. USD/JPY drops from 145 to 143.6 and the trade-weighted dollar index turns back below 100 in another sign of the dollar lacking momentum for a comeback worthy the name. Among the best performers is the Australian dollar (second place after JPY in G10). AUD has high hopes from the Labour Party election victory. A solid majority paves the way for clearcut policies, including what is dubbed a fiscal “spendathon”. Sterling is going nowhere just north of EUR/GBP 0.85 amid UK markets closed for May Day and going into Thursday’s Bank of England meeting. A rate cut is expected with growth and inflation forecasts probably downgraded. The key question, however, is how much scope for cuts the BoE sees going forward given the stagflationary vibes running through the UK. Money markets currently price in around 100 bps of cuts for the remainder of the year (incl. Thursday’s meeting). The Fed also convenes this week on Wednesday but we expect no change in the tone Powell held during a speech two weeks ago: Too high inflation and upside inflation risks have priority over a still-robust labour market. A long rates pause (beyond the summer) is in the cards. The upcoming Fed meeting and lack of eco data – until the US services ISM releases that is – help explain the calm in core/US bond markets. US yields trade little changed apart from some (natural?) long end underperformance (30-yr +3.6 bps). We see a similar curve shift in Germany (+30-yr + 1.6 bps).
The April US services ISM came out to the better side of expectations with the headline index improving from 50.8 to 51.6 (50.2 expected). Details showed new orders recovering to 52.3 after a 1.8 point drop in March. Employment still shrinks but only marginally (49.0 from 46.2). Prices paid gained traction again though, with the subseries rising to the highest level since early 2023 (65.1). US yields eke out a few additional bps and the USD pares earlier losses after the release in a first reaction.
News & Views
Swiss CPI consumer prices stagnated in April, both compared to March 2025 and compared to April 2024, according to data published by the Swiss Statistical office (FSO) today. This compares to expectations for a 0.2% M/M rise. Core inflation also printed at a softer than expected 0.1% M/M and 0.6% Y/Y. Domestic prices declined 0.1% M/M to slow to 0.8% Y/Y. Imported goods rose 0.3% M/M but were 2.5% below last year’s level. Goods prices rose 0.2% in a monthly perspective, but declined 2.0% Y/Y. Services prices fell 0.1% M/M to be up 1.4% Y/Y. The data were also lower than the forecast of the Swiss National Bank (SNB) at the time of its March policy meeting when it saw inflation at 0.4% on average in Q1 and at 0.3% in Q2. The average expected for this year was already set at a low 0.4%. The combination of low inflation, being reinforced by a strong Swiss franc caused markets to fully a discount a new rate cut at the June 19 meeting from 0.25% back to zero. The Swiss franc eased marginally/temporarily after the CPI release (EUR/CHF 0.934). Even so, in case of further Swiss franc strength, the SNB faces the difficult choice of reconsidering FX interventions and/or returning to negative rates.
Turkish inflation in April rose 3.0% M/M and 37.86% Y/Y, compared to 2.46% and 38.10% in March. Core inflation excluding energy, food and beverages, tobacco and gold rose 3.34% M/M and 37.12% Y/Y. The outcome was marginally lower than expected. After starting gradual easing last year, the Central Bank of the Republic of Turkey at the April 17 meeting again raised its one week repo rate to 46.0% from 42.5%. In March the CBRT already took emergency tightening measures to preserve financial stability and cope with renewed inflationary risks from a weaker currency due to domestic political turmoil at that time. The lira dropped to new all-time lows (against the dollar and the euro) after the imprisonment of opposition member Ekrem Imamoglu. The weak currency probably will force the CBRT to keep a tight monetary conditions from some time to come. At USD/TRY 38.586, the lira is holding near all-time low levels against the dollar except for the volatile moves on March 19.
US ISM services rises to 51.6, prices jumps to highest since Jan 2023
US ISM Services PMI from 50.8 rose to 51.6 in April, beating expectations of 50.6. The gain was driven by stronger new orders, which rose from 50.4 to 52.3.
However, business activity slipped to 53.7 from 55.9. Employment rebounded from 46.2 to 49.0, but stayed in contraction territory for the second consecutive month.
The most notable development was the sharp jump in the prices index—from 60.9 to 65.1—the highest since January 2023.
Overall, the data point to modest economic growth, with ISM estimating a 1% annualized GDP expansion based on the services reading.
USD/JPY Mid-Day Outlook
Daily Pivots: (S1) 143.82; (P) 144.87; (R1) 146.01; More...
No change in USD/JPY's outlook and intraday bias stays neutral at this point. Overall near term outlook will stay bearish as long as 38.2% retracement of 158.86 to 139.87 at 147.12 holds. Break of 141.96 will argue that the rebound has completed as a corrective move. Retest of 139.87 should then be seen next in this case.
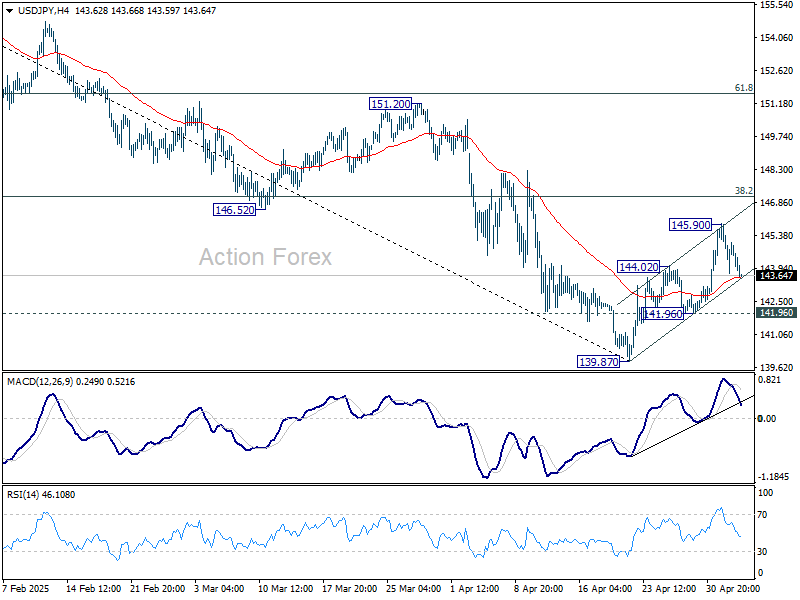
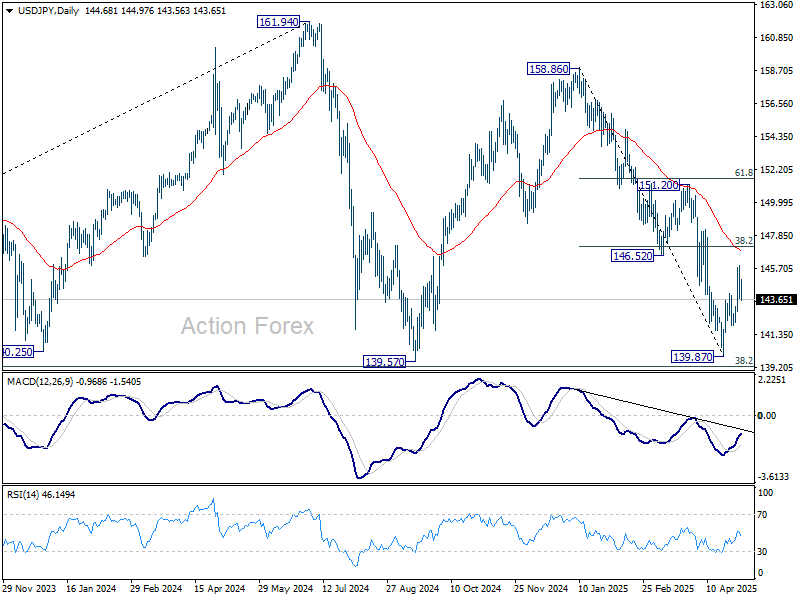
In the bigger picture, price actions from 161.94 are seen as a corrective pattern to rise from 102.58 (2021 low), with fall from 158.86 as the third leg. Strong support should be seen from 38.2% retracement of 102.58 to 161.94 at 139.26 to bring rebound. However, sustained break of 139.26 would open up deeper medium term decline to 61.8% retracement at 125.25.
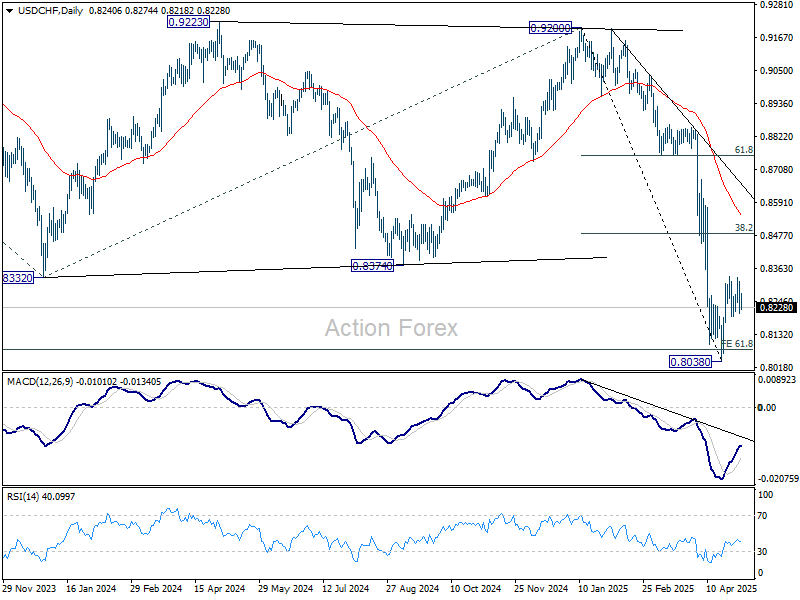
USD/CHF Mid-Day Outlook
Daily Pivots: (S1) 0.8208; (P) 0.8264; (R1) 0.8321; More….
Range trading continues in USD/CHF and intraday bias remains neutral. On the upside, above 0.8333 will resume the rebound from 0.8038. However, upside should be limited by 38.2% retracement of 0.9200 to 0.8038 at 0.8482. On the downside, below 0.8196 minor support will bring retest of 0.8038. Firm break there will resume larger down trend.
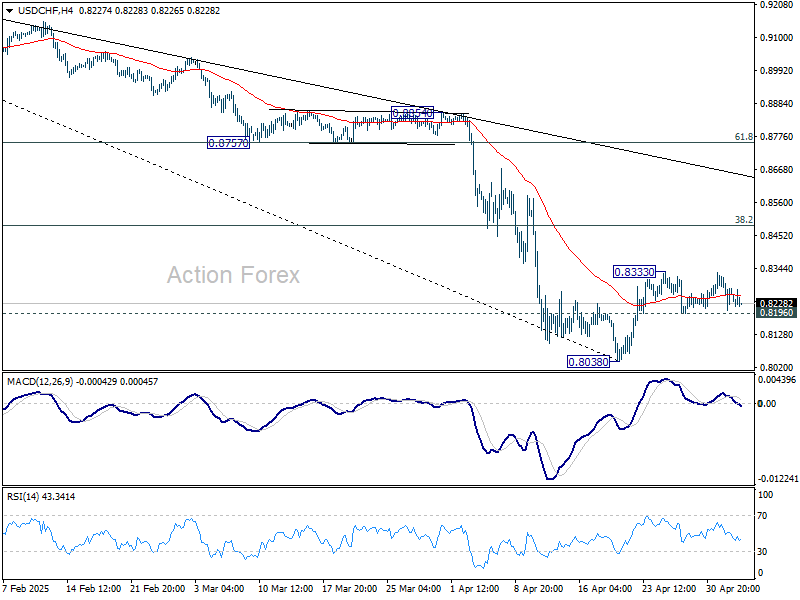
In the bigger picture, long term down trend from 1.0342 (2017 high) is still in progress and met 61.8% projection of 1.0146 (2022 high) to 0.8332 from 0.9200 at 0.8079 already. In any case, outlook will stay bearish as long as 55 W EMA (now at 0.8763) holds. Sustained break of 0.8079 will target 100% projection at 0.7382.
GBP/USD Mid-Day Outlook
Daily Pivots: (S1) 1.3250; (P) 1.3291; (R1) 1.3318; More...
Range trading continues in GBP/USD and intraday bias remains neutral. On the downside, firm break of 1.3232 support will indicate short term topping and rejection by 1.3433 key resistance. Intraday bias will be back on the downside for deeper pullback to 55 D EMA (now at 1.3020) and possibly below. On the upside, firm break of 1.3433 key resistance confirm larger up trend resumption.
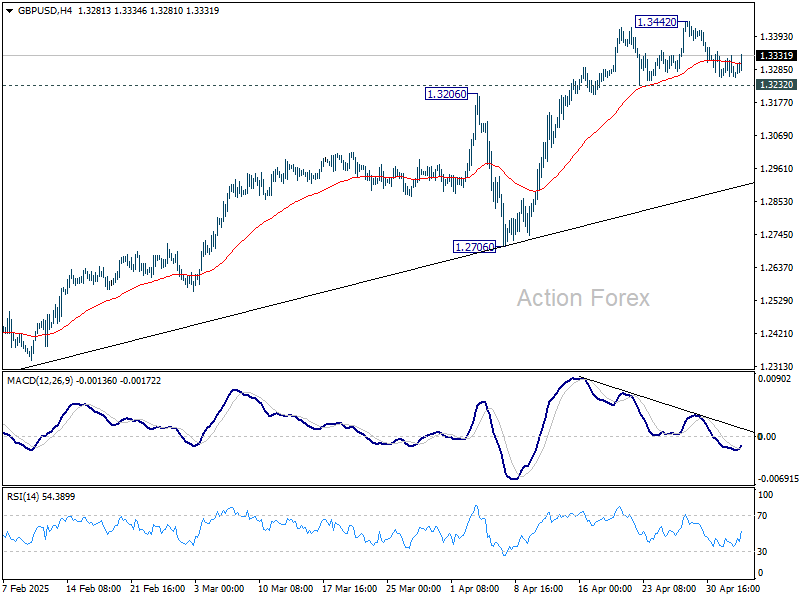
In the bigger picture, price actions from 1.3433 are seen as a corrective pattern to the up trend from 1.3051 (2022 low). Rise from 1.2099 could either be resuming the up trend, or the second leg of a consolidation pattern. Overall, GBP/USD should target 1.4248 key resistance (2021 high) on decisive break of 1.3433 at a later stage.
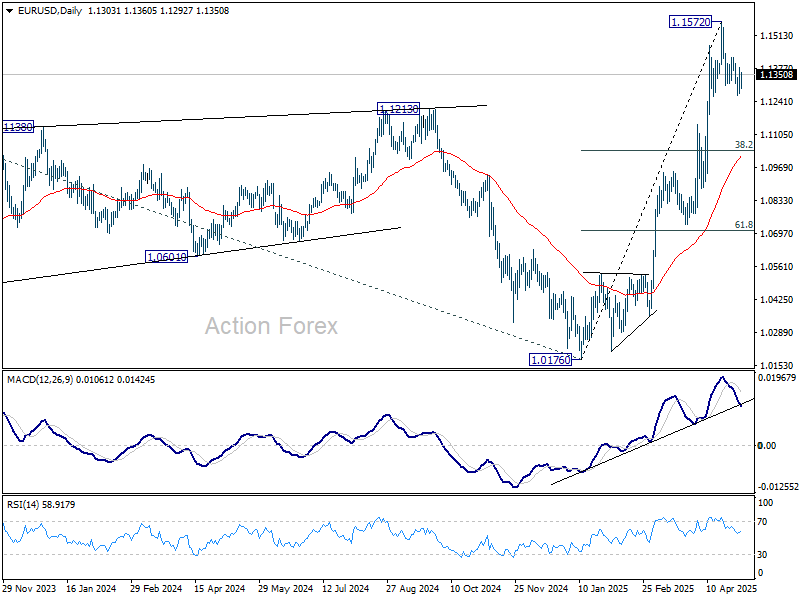
EUR/USD Mid-Day Outlook
Daily Pivots: (S1) 1.1257; (P) 1.1319; (R1) 1.1364; More...
EUR/USD is staying in tight range above 1.1265 and intraday bias remains neutral. On the downside, below 1.1265 will resume the corrective fall from 1.1572 short term top. But downside should be contained by 38.2% retracement of 1.0176 to 1.1572 at 1.1039. On the upside, break of 1.1424 will suggest that the correction has completed and bring retest of 1.1572 high.
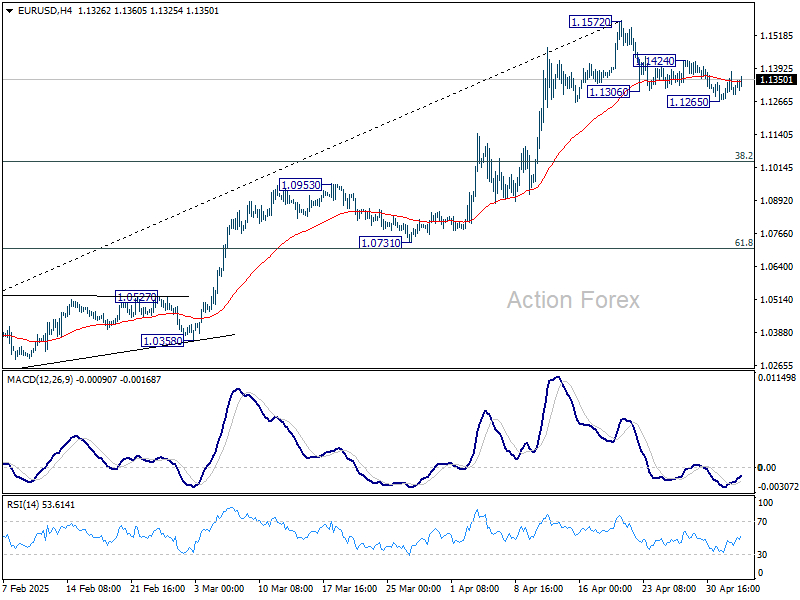
In the bigger picture, rise from 0.9534 long term bottom could be correcting the multi-decade downtrend or the start of a long term up trend. In either case, further rise should be seen to 100% projection of 0.9534 to 1.1274 from 1.0176 at 1.1916. This will now remain the favored case as long as 55 W EMA (now at 1.0808) holds.