Sample Category Title
Muted Major FX Action Masks Big Moves in Asia; Gold Rebound Gather Momentum
The currency markets remain subdued in early trading this week, with the exception of a broad, mild Dollar weakness. Among the major currencies, movements have been muted despite notable developments. Swiss inflation falling back to 0% has increased pressure on the SNB to cut rates further to avoid deflation, but the Swiss Franc showed little response. Similarly, an unexpected improvement in Eurozone investor confidence failed to generate any sustained lift in the Euro.
In equities, European stocks were mixed, lacking clear conviction, while UK markets closed for a public holiday. US futures also point to a slightly weaker open. Meanwhile, oil prices saw some stabilization but remained lower for the day after OPEC+ agreed to a production hike over the weekend. WTI crude is attempting to recover, but the bearish bias remains as markets now anticipate a potential production surplus in the second half of the year.
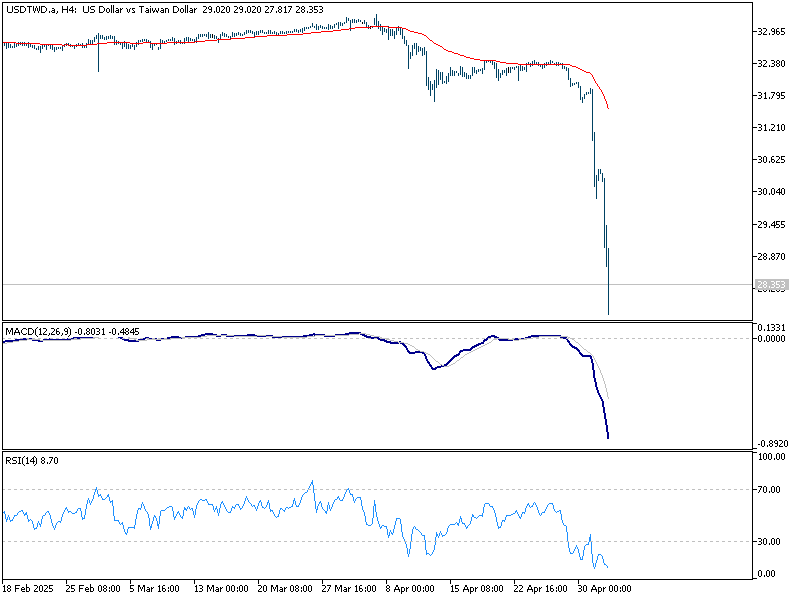
The most eye-catching action is unfolding in Asian currency markets. Taiwanese Dollar soared more than 5% to a three-year high against Dollar, capping an 8% gain in just two sessions. The sharp move followed the conclusion of US-Taiwan trade talks last week, stoking speculation that a tacit agreement to strengthen the TWD may have been reached. While it's denied by Taiwan’s central bank, the pace and scale of the rally suggest market confidence in a policy-backed shift, which would align with US interests in reducing bilateral trade imbalances.
China’s offshore yuan also rallied sharply, touching a six-month high against the greenback. While no official catalyst was pinpointed, the move followed speculation that the US and China may soon begin tariff negotiations. However, any such discussions would be complex and drawn-out, likely injecting fresh volatility into CNY markets.
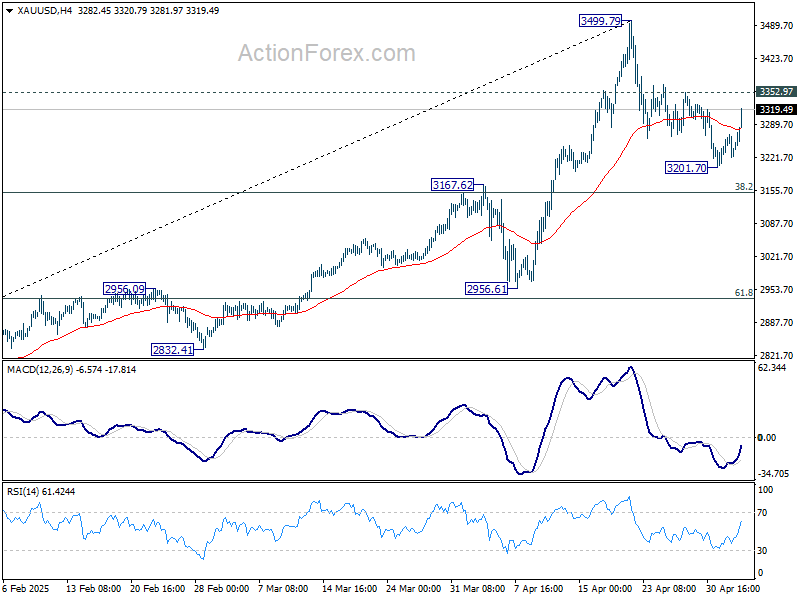
Technically, one focus now is on how far Gold's rebound could go. Firm break of 3352.97 resistance will indicate that correction from 3499.79 has already completed at 3201.70, ahead of 3167.62 resistance turned support. Retest of 3499.79 should be seen next, with prospect of breaking through this level to resume the record run.
Eurozone Sentix confidence surges to -8.1 as investors cheer calm EU response to trade war
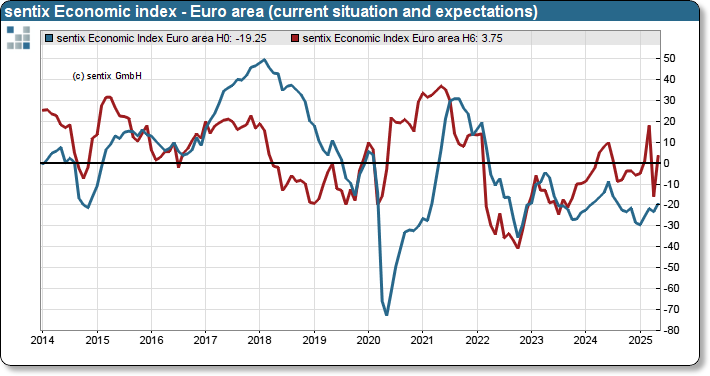
Eurozone Sentix Investor Confidence rose sharply from -19.5 to -8.1,well above expectations. Current Situation Index climbed from -23.3 to -19.3, the highest level since August 2024. Expectations Index turned positive, rising from -15.8 to 3.8.
Sentix credited the European Commission's "level-headed response" toward escalating US trade actions for the improving sentiment. Additionally, a surprising improvement in inflation data has reinforced expectations that ECB will be able to continue its gradual rate-cutting cycle.
While investors are clearly more upbeat, Sentix noted the mood was "more subdued but basically ‘calm’", comparing to March.
ECB’s Panetta warns protectionism threatens global prosperity
Italian ECB Governing Council member Fabio Panetta warned today that rising protectionism poses a serious threat to global economic stability
Speaking at an event, Panetta said, "Openness to trade has benefited both advanced and developing nations, reducing inequality and lifting hundreds of millions of people out of extreme poverty."
However, "protectionism threatens to undo these achievements and to weaken the very fabric of global prosperity," he added.
He emphasized that geopolitical tensions, alongside growing uncertainty in global trade, are becoming central considerations for policymakers.
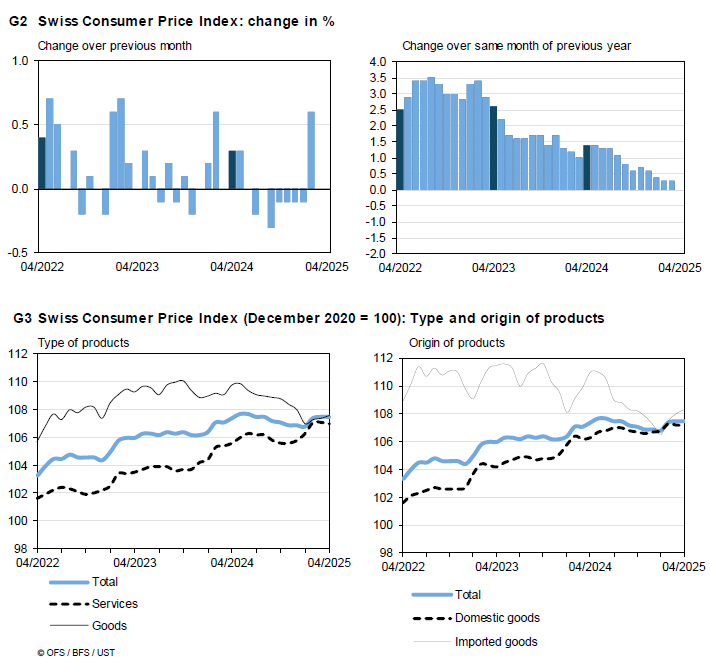
Swiss CPI drops to 0% as import deflation worsens
Swiss consumer price growth came to a standstill in April, with headline CPI unchanged month-on-month for a second consecutive month.
On an annual basis, inflation slowed sharply from 0.3% yoy to 0.0% yoy, marking a return to flat price levels not seen since the disinflationary spell of early 2021.
Core CPI (excluding fresh and seasonal products, energy and fuel) also lost momentum, easing from 0.9% yoy to 0.6% yoy.
The softness in inflation was driven by a decline in domestic product prices, which fell -0.1% mom and decelerated from 1.0% yoy to 0.8% yoy. Meanwhile, imported product prices offered a small offset, rising 0.3% mom but still contracting -2.5% yoy (prior -1.7% yoy).
EUR/USD Mid-Day Outlook
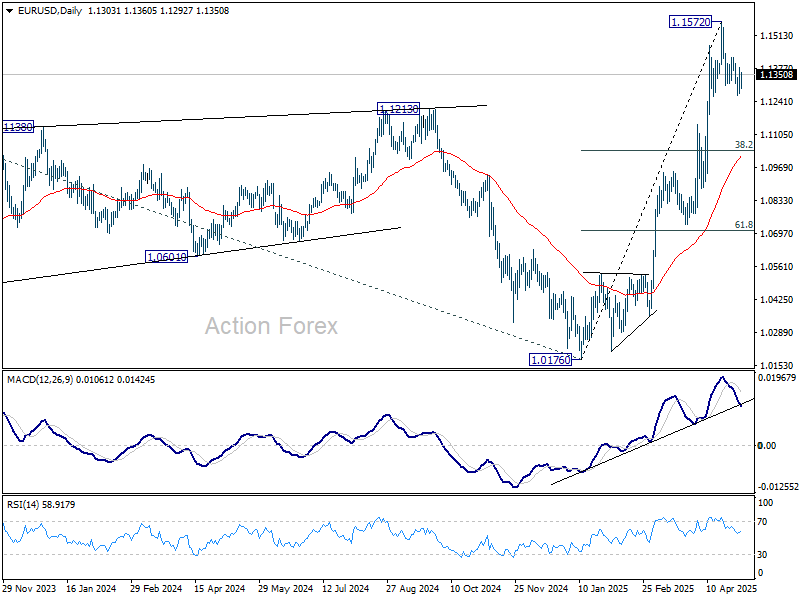
Daily Pivots: (S1) 1.1257; (P) 1.1319; (R1) 1.1364; More...
EUR/USD is staying in tight range above 1.1265 and intraday bias remains neutral. On the downside, below 1.1265 will resume the corrective fall from 1.1572 short term top. But downside should be contained by 38.2% retracement of 1.0176 to 1.1572 at 1.1039. On the upside, break of 1.1424 will suggest that the correction has completed and bring retest of 1.1572 high.
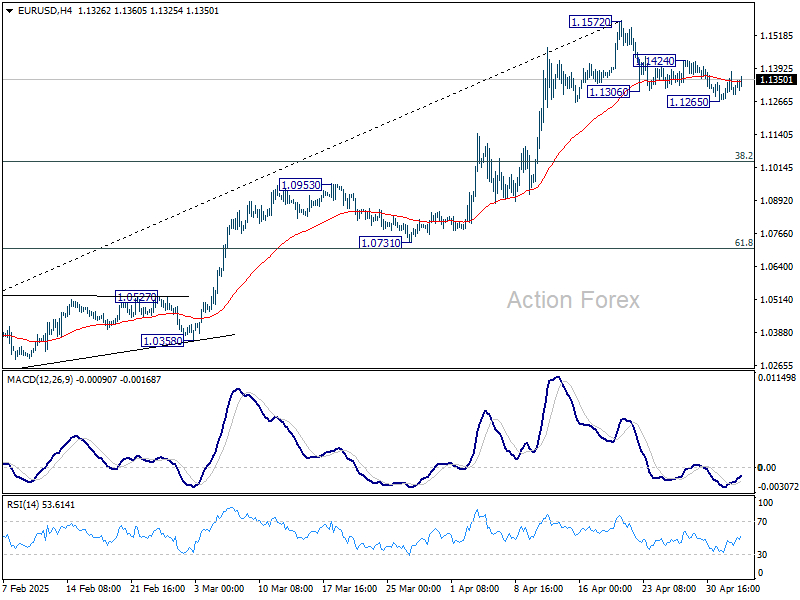
In the bigger picture, rise from 0.9534 long term bottom could be correcting the multi-decade downtrend or the start of a long term up trend. In either case, further rise should be seen to 100% projection of 0.9534 to 1.1274 from 1.0176 at 1.1916. This will now remain the favored case as long as 55 W EMA (now at 1.0808) holds.
WTI: Oil Prices Tumble on Monday as OPEC+ Increases Production Again
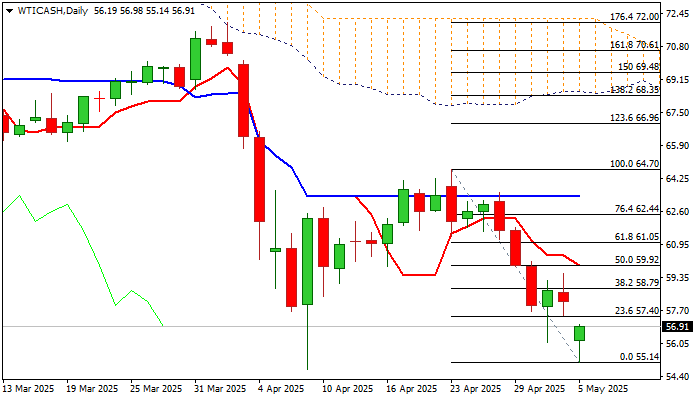
WTI Oil opened with $2 gap lower on Monday and hit the lowest since Apr 9, after OPEC+ over the weekend announced decision to further increase oil production by 411K bpd from June.
This marks the third consecutive output increase which totaled 960K bpd, including increases in April May and June.
The decision negatively impacted oil prices as markets remain very concerned about oil demand outlook, darkened by growing fears about further weakening of the global economy which already felt strong drag from US trade tariffs.
The pressure on oil prices could increase on concerns that further output increases would fully offset cartel’s earlier decision of voluntary production cuts and deepen threats of disbalance between production and demand.
Fresh weakness neared key support at $55.12 (Apr 9 low, the lowest since Feb 2021) but face strong headwinds at this zone that may keep the price in consolidation before final push lower.
Immediate bears are expected to remain intact as long as today’s gap is unfilled, though extended upticks (which cannot be ruled out) should be ideally capped under $60.00 (50% retracement of $64.70/$55.14 bear-leg / psychological reinforced by daily Tenkan-sen) to keep near term bias with bears.
Daily studies are bearish (strong negative momentum / daily Tenkan / Kijun-sen in bearish setup and diverging) and add to negative near term outlook.
Res: 57.11; 57.66; 58.79; 60.00.
Sup: 55.12; 54.77; 52.43; 51.59.
ECB’s Panetta warns protectionism threatens global prosperity
Italian ECB Governing Council member Fabio Panetta warned today that rising protectionism poses a serious threat to global economic stability
Speaking at an event, Panetta said, "Openness to trade has benefited both advanced and developing nations, reducing inequality and lifting hundreds of millions of people out of extreme poverty."
However, "protectionism threatens to undo these achievements and to weaken the very fabric of global prosperity," he added.
He emphasized that geopolitical tensions, alongside growing uncertainty in global trade, are becoming central considerations for policymakers.
Crypto Market Blows Off Steam
Market picture
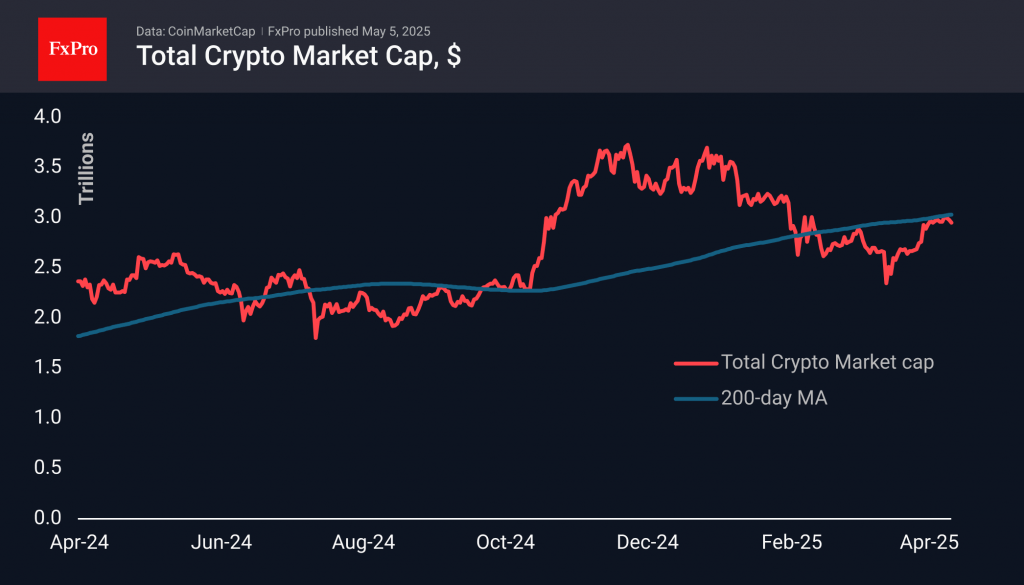
Crypto market capitalisation has returned to below $3 trillion to $2.95 trillion, losing around 0.8% in the last 24 hours and down 1% in seven days. The selling looks like short-term profit taking after the rally of the past two weeks. Market sentiment is neutral with a slight positive bias, with the fear and greed index at 52.
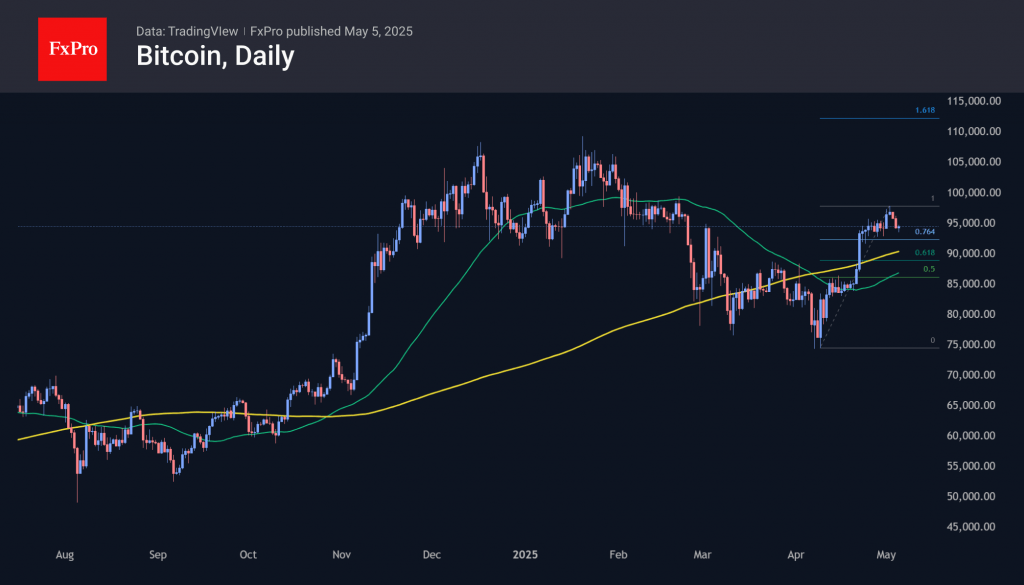
Bitcoin has pulled back below $95000, correcting after briefly breaking above $98000 last Friday. The price has returned to the area of former strong support that worked from December to February. Expectedly, it is now equally strong resistance. Technical correction targets look like the $92500 and $89000 levels. However, a decline below $90000 will already make the nervous, sending the price under the psychologically important round level and the 200-day moving average.
News background
Significant inflows into spot bitcoin ETFS in the US continue for the second week in a row. According to SoSoValue data, weekly net inflows into spot BTC-ETFS totalled $1.81bn after $3.06bn the week before, bringing the all-time total to $40.24bn. Net inflows into ETH-ETFS totalled $106.8m last week, bringing the total to $2.51bn.
Fidelity believes Bitcoin has moved from the ‘belief and denial’ zone to the ‘optimism and anxiety’ phase. The first cryptocurrency’s fundamental metrics remain strong despite the asset’s decline from the year’s highs.
Glassnode warns of sell-off risks as bitcoin rises towards $100,000. The cumulative unrealised gains of long-term investors in the first cryptocurrency approached 350%, which has historically coincided with stronger selling.
At the end of Q1, Tether generated an operating profit of $1bn from traditional investments. Investments in US government bonds provided the result, while the positive revaluation of gold almost offset bitcoin’s volatility.
Santiment notes that the number of meme-coin mentions on social media peaked in 2025 due to a shift in traders’ interest in high-risk assets in the last couple of weeks.
Fed Preview: Waiting Calmly Before the Storm
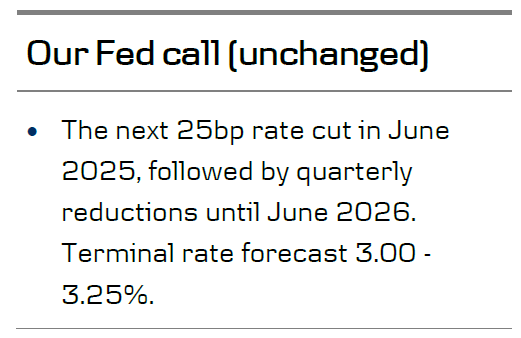
- We expect the Fed to maintain its monetary policy unchanged in the May meeting, in line with consensus and market pricing. The Fed will not publish updated economic projections.
- While we expect the Fed to resume cutting rates in June, we doubt Powell will opt for clear forward guidance amid
 the tariff uncertainty. Growth risks remain tilted to the downside, but rising inflation expectations are still a concern.
 - We see current Fed pricing as broadly fair, but see risks skewed towards a dovish market reaction. We maintain our terminal rate forecast at 3.00-3.25% and 12M EUR/USD forecast at 1.22.
After a month of unprecedented tariff uncertainty, the Fed can most likely afford to stay in a 'wait-and-see' mode next week. While the trade war is already weighing on the economy, the effects on hard data have so far been more modest than feared. The combination of recovering equities, lower bond yields, weaker USD and lower oil prices have eased financial conditions markedly after the sharp tightening seen in early April.
FOMC participants' views on the most likely policy implications have varied surprisingly lot over the past weeks. Christopher Waller, who has often been seen as the consensus voice of the committee, took a clear step towards the dovish camp by firmly labelling tariff-driven inflation as 'transitory' and by warning against recessionary signs emerging in H2. Others have sounded more cautious and called for patience, as the negative supply shock on imports and rising consumers' inflation expectations bring back uncomfortable memories from 2021.
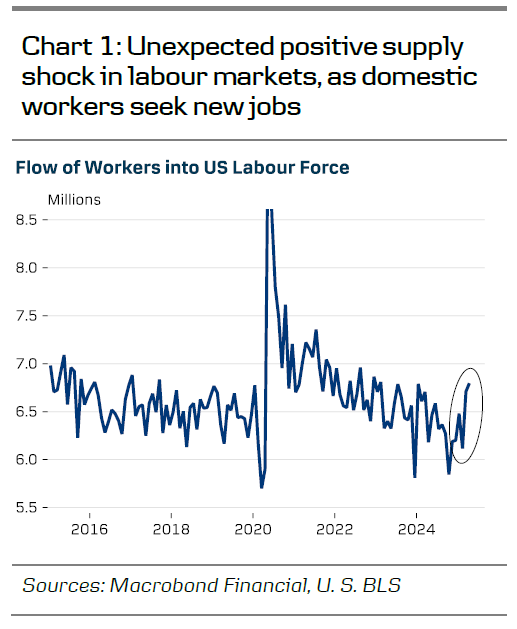
The key difference to post-Covid inflation is that the aggregate supply outside of imported goods has not been negatively affected by the trade war, but even the opposite. Last Friday's Jobs Report showed an unexpected uptick in domestic labour supply (chart 1), as the fear of weaker job prospects might have motivated those outside the labour force to seek employment. March JOLTs data showed the ratio of job openings to unemployed job seekers declining to 1.02 - the least overheated level since mid-2021. Balanced labour markets reduce the risk of persistent inflation, in our view.
Markets are pricing 112bp of rate cuts by June 2026 - not far from our call of 125bp (chart 2). We think the most likely timing for the next cut is the following meeting in June, but do not anticipate Powell to pre-commit at this stage. As market sentiment has stabilized, the Fed has little incentive for providing forward guidance amid the obvious tariff uncertainty. By June and July, the Fed will likely have much more clarity on both the final level of China tariffs as well as the future of the other 'reciprocal' tariffs.
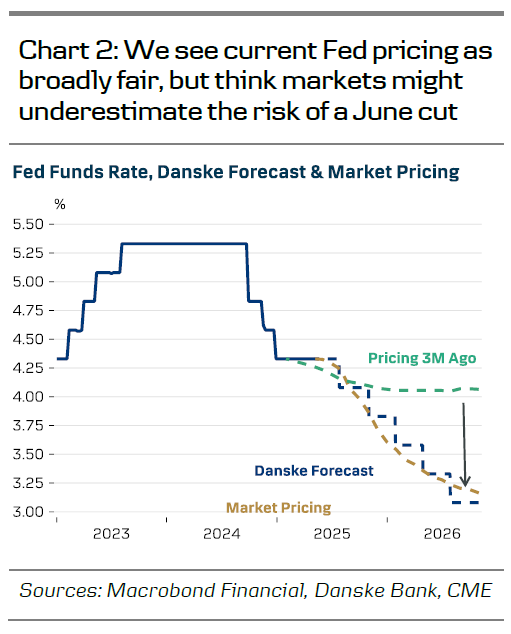
Market prices in only 8bp for the June meeting, which leaves risks mildly skewed towards a dovish reaction. We see EUR/USD moving higher over the coming year with a 12M target of 1.22, and 10y UST yield declining to 4.20%. Upside risks to yields are more related to the term premium component, than risk-neutral rate expectation. Finally, we do not expect changes to the QT after the taper announcement in March.
Brent Crude Opens with a Bearish Gap
As shown on the XBR/USD chart, Brent crude oil opened this Monday morning around $59.00, forming a bearish gap relative to Friday’s closing price of approximately $61.40.
The current Brent crude oil price is near the yearly low reached about a month ago, following the announcement of Trump’s tariffs, which turned out to be significantly higher than expected.
Why Is Oil Falling?
As we noted on 30 April, market participants are closely watching news related to OPEC+. Over the weekend, during an online meeting (according to media reports), the following developments occurred:
→ It was stated that the current oil market is fundamentally healthy;
→ A decision was made to accelerate the pace of oil production increases.
According to the plan, output will rise by 411,000 barrels per day — with some believing this move is partly due to certain OPEC+ countries previously failing to adhere to production quotas.
Technical Analysis of the XBR/USD Chart
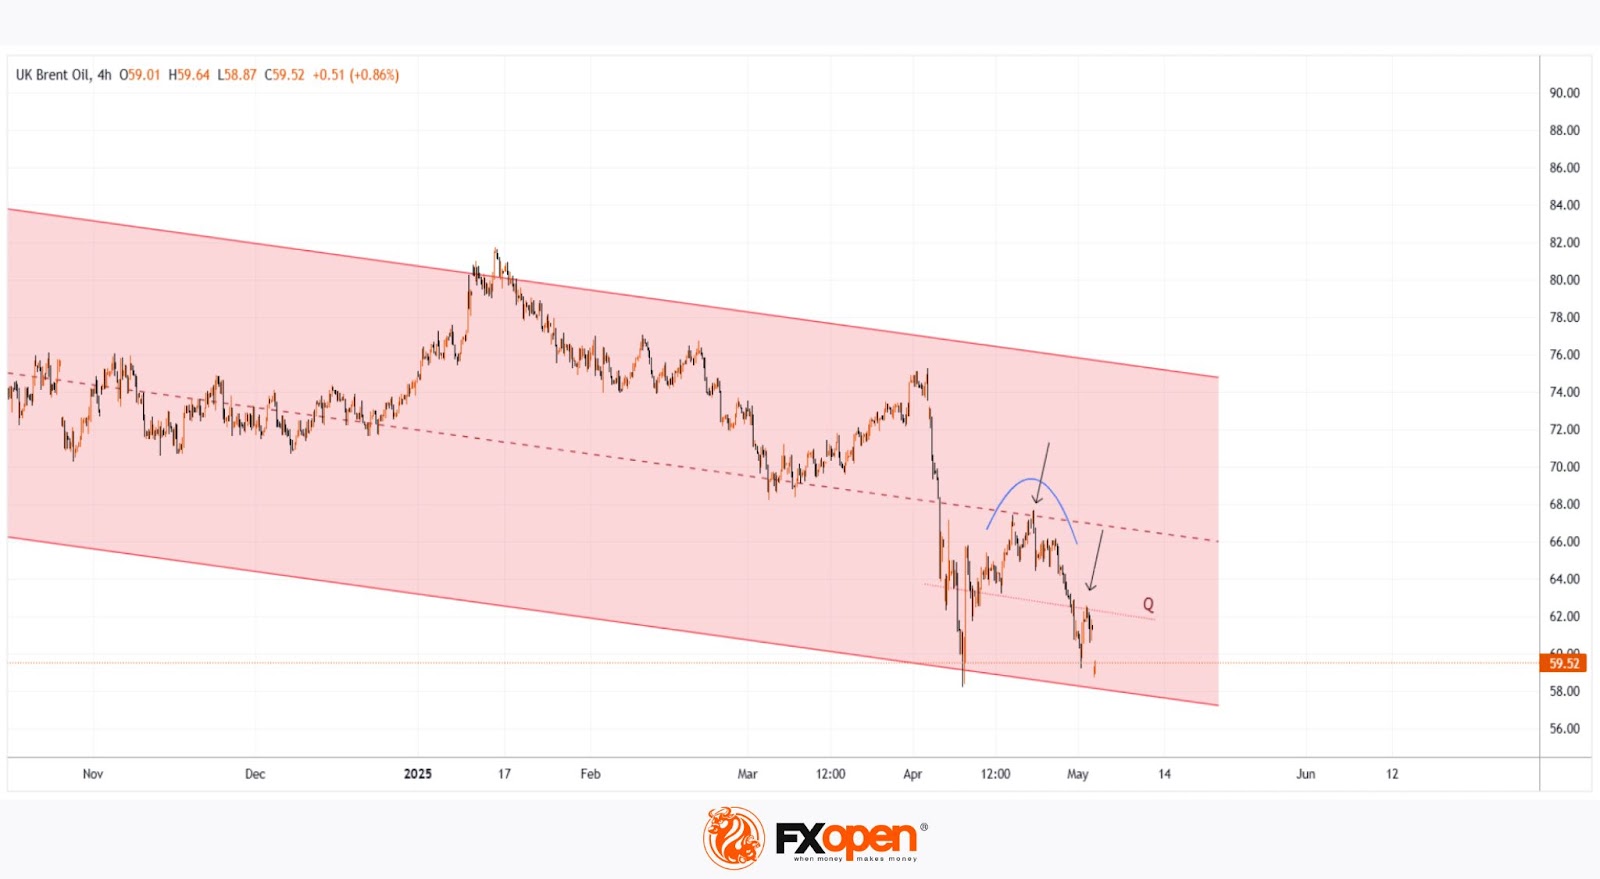
Oil price movements in 2025 form a descending channel (shown in red), with progressively lower highs and lows indicating bearish sentiment.
Although bulls may hope that the lower boundary of the channel could act as support, bears are showing signs of dominance (as indicated by arrows):
→ the median line of the channel previously acted as resistance;
→ now, similar behaviour is seen at line Q, which divides the lower half of the channel into two quarters;
→ the Rounding Top pattern also signals strong selling pressure.
Fundamentally, oil prices are supported by China’s willingness to negotiate tariffs with the US. However, considering the OPEC+ decision and ongoing fears of a global recession, the current downward channel on the Brent crude oil price chart is unlikely to lose relevance any time soon.
Start trading commodity CFDs with tight spreads. Open your trading account now or learn more about trading commodity CFDs with FXOpen.
This article represents the opinion of the Companies operating under the FXOpen brand only. It is not to be construed as an offer, solicitation, or recommendation with respect to products and services provided by the Companies operating under the FXOpen brand, nor is it to be considered financial advice.
Gold Rises as Demand for Safe-Haven Assets Returns
Gold prices climbed to 3,260 USD per troy ounce on Monday, as global uncertainty—particularly around US-China trade negotiations—continues to drive demand for safe-haven assets.
Trade tensions and a weaker dollar support gold
Market sentiment remains cautious after US President Donald Trump stated that China is ready to make a deal, yet offered no specifics on the content or timing of renewed negotiations.
Earlier, Beijing confirmed it was reviewing US proposals to restart talks but reiterated that certain conditions must be met before any dialogue can begin. This lingering uncertainty continues to bolster investor interest in gold.
Adding to the upside pressure, the US dollar weakened, making gold more attractive for holders of other currencies.
Investors are now turning their attention to the upcoming Federal Reserve meeting, which begins on Tuesday and concludes on Wednesday evening. Markets widely expect the Fed to maintain current interest rates, despite renewed calls from Trump to lower them.
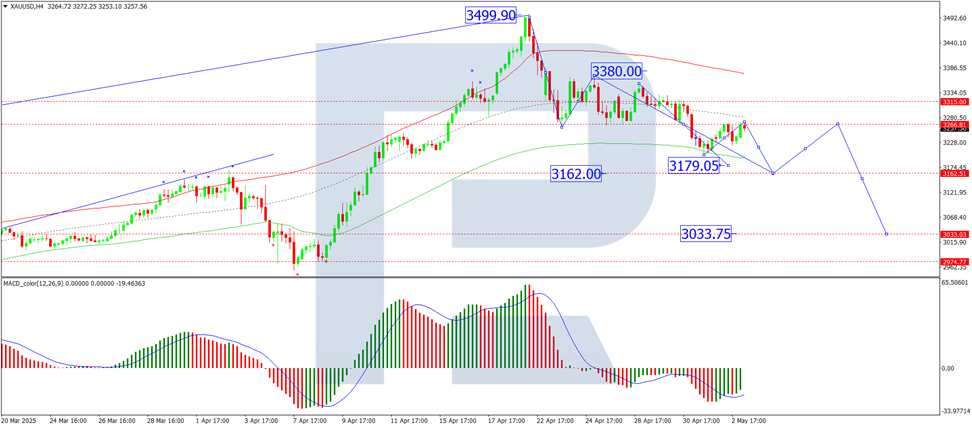
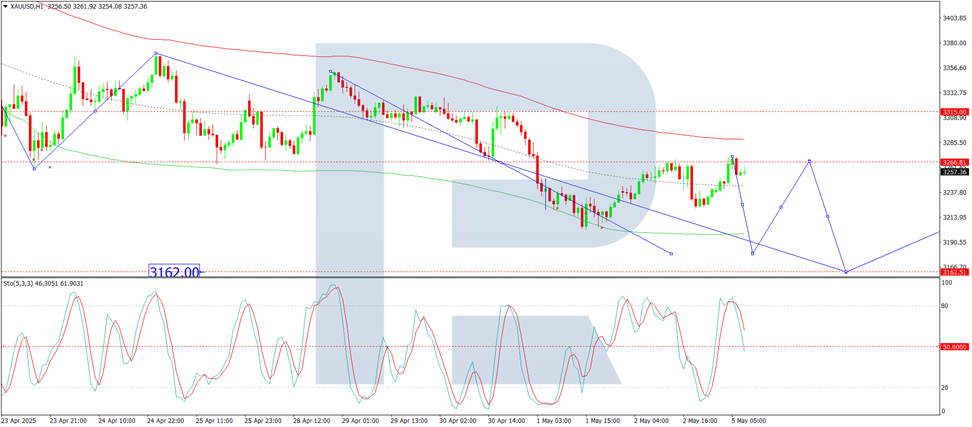
Technical analysis of XAU/USD
On the H4 chart, XAU/USD is consolidating around 3,266 USD. A decline to 3,165 USD is possible in the short term. After reaching this level, the market may correct back up to 3,266 USD. If the correction completes, another downward wave could unfold with a target at 3,033 USD. The MACD indicator supports this bearish scenario, with its signal line below zero and pointing sharply downwards.
On the H1 chart, gold broke below 3,266 USD, reached the local target of 3,202 USD, and then corrected back up to test 3,266 USD from below. The formation of another downside wave towards 3,179 USD is relevant today. The Stochastic oscillator confirms this outlook, with its signal line below 80 and heading directly towards 20, indicating continued downward momentum.
Conclusion
Gold remains supported by geopolitical uncertainty and a weakening dollar, while technical indicators point to short-term downside potential before another possible corrective rebound. Key levels to watch are 3,179 USD and 3,165 USD as near-term support, with a broader bearish target at 3,033 USD. The Fed's upcoming meeting may influence price direction depending on its tone regarding interest rates and the broader economic outlook.
Eurozone Sentix confidence surges to -8.1 as investors cheer calm EU response to trade war
Eurozone Sentix Investor Confidence rose sharply from -19.5 to -8.1,well above expectations. Current Situation Index climbed from -23.3 to -19.3, the highest level since August 2024. Expectations Index turned positive, rising from -15.8 to 3.8.
Sentix credited the European Commission's "level-headed response" toward escalating US trade actions for the improving sentiment. Additionally, a surprising improvement in inflation data has reinforced expectations that ECB will be able to continue its gradual rate-cutting cycle.
While investors are clearly more upbeat, Sentix noted the mood was "more subdued but basically ‘calm’", comparing to March.
Gold Dips Further and WTI Crude Oil Tumbles
Gold price started a fresh decline below $3,300. WTI Crude oil is down over 10% and remains at risk of more losses.
Important Takeaways for Gold and WTI Crude Oil Price Analysis Today
- Gold price climbed higher towards the $3,350 zone before there was a sharp decline against the US Dollar.
- A key bearish trend line is forming with resistance near $3,270 on the hourly chart of gold at FXOpen.
- WTI Crude oil prices extended downsides below the $60.00 support zone.
- A major bearish trend line is forming with resistance near $57.25 on the hourly chart of XTI/USD at FXOpen.
Gold Price Technical Analysis
On the hourly chart of Gold at FXOpen, the price climbed above the $3,250 resistance. The price even spiked above $3,300 before the bears appeared.
A high was formed near $3,352 before there was a fresh decline. There was a move below the $3,300 support level. The bears even pushed the price below the $3,250 support and the 50-hour simple moving average.
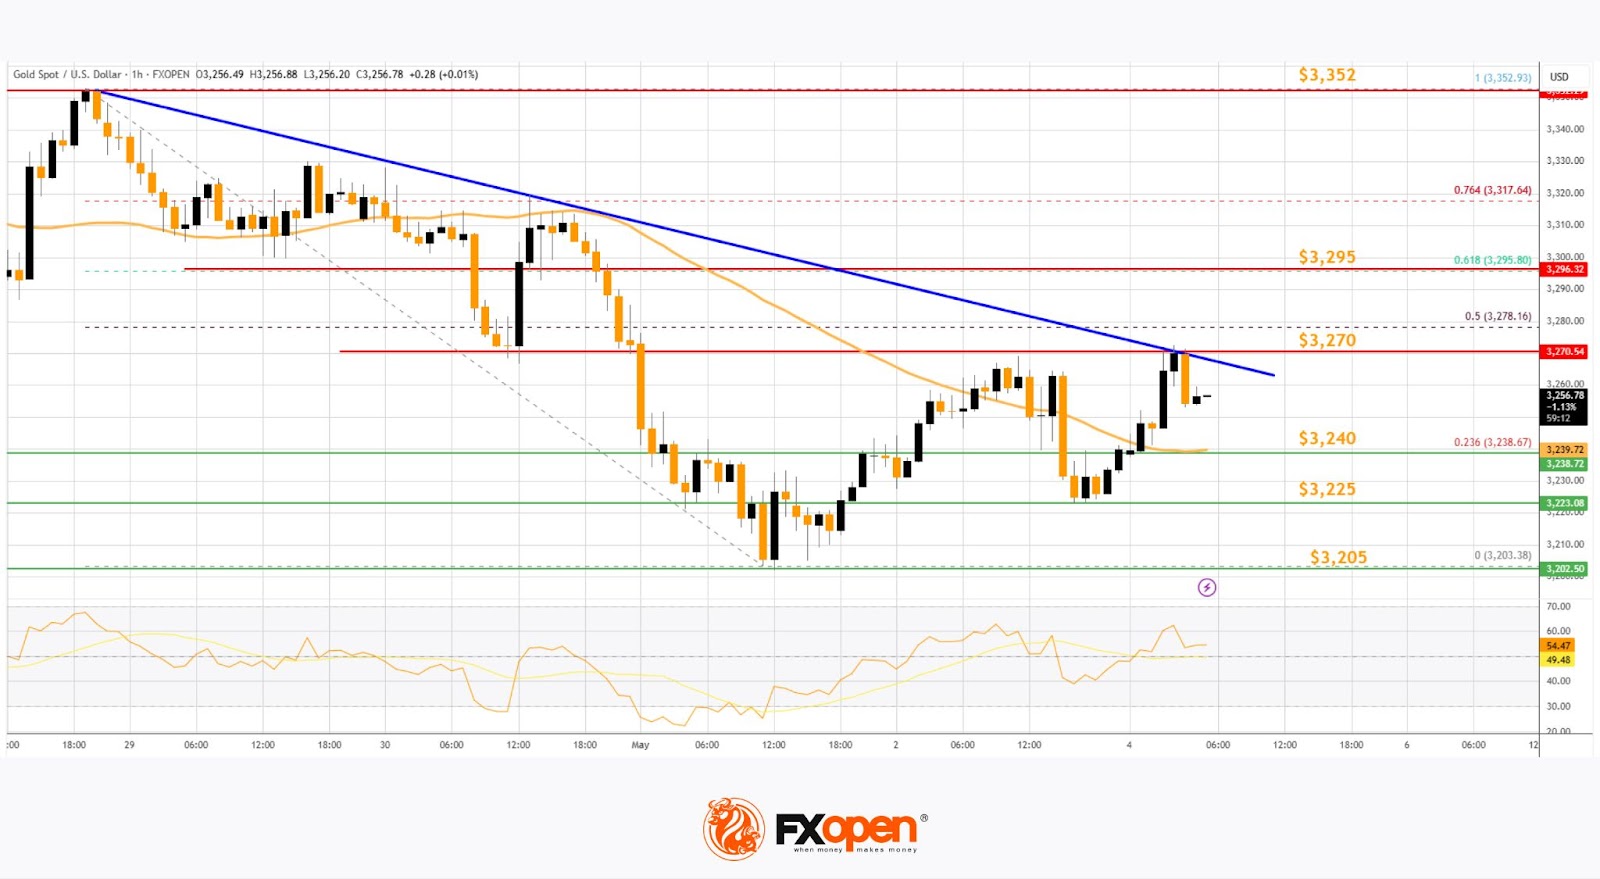
It tested the $3,200 zone. A low has formed near $3,203 and the price is now showing bearish signs. There was a minor recovery wave above the 23.6% Fib retracement level of the downward move from the $3,352 swing high to the $3,203 low.
However, the bears are active below $3,270. Immediate resistance is near $3,270. There is also a key bearish trend line forming with resistance near $3,270.
The next major resistance is near the $3,295 zone and the 61.8% Fib retracement level of the downward move from the $3,352 swing high to the $3,203 low. The main resistance could be $3,352, above which the price could test the $3,400 resistance. The next major resistance is $3,500.
An upside break above the $3,500 resistance could send Gold price toward $3,550. Any more gains may perhaps set the pace for an increase toward the $3,620 level.
Initial support on the downside is near the $3,240 level. The first major support is near the $3,225 level. If there is a downside break below the $3,225 support, the price might decline further. In the stated case, the price might drop toward the $3,205 support.
WTI Crude Oil Price Technical Analysis
On the hourly chart of WTI Crude Oil at FXOpen, the price struggled to continue higher above $60.00 against the US Dollar. The price formed a short-term top and started a fresh decline below $58.00.
There was a steady decline below the $57.75 pivot level. The bears even pushed the price below $56.20 and the 50-hour simple moving average. Finally, the price tested the $55.00 zone. The recent swing low was formed near $55.01, and the price is now consolidating losses.
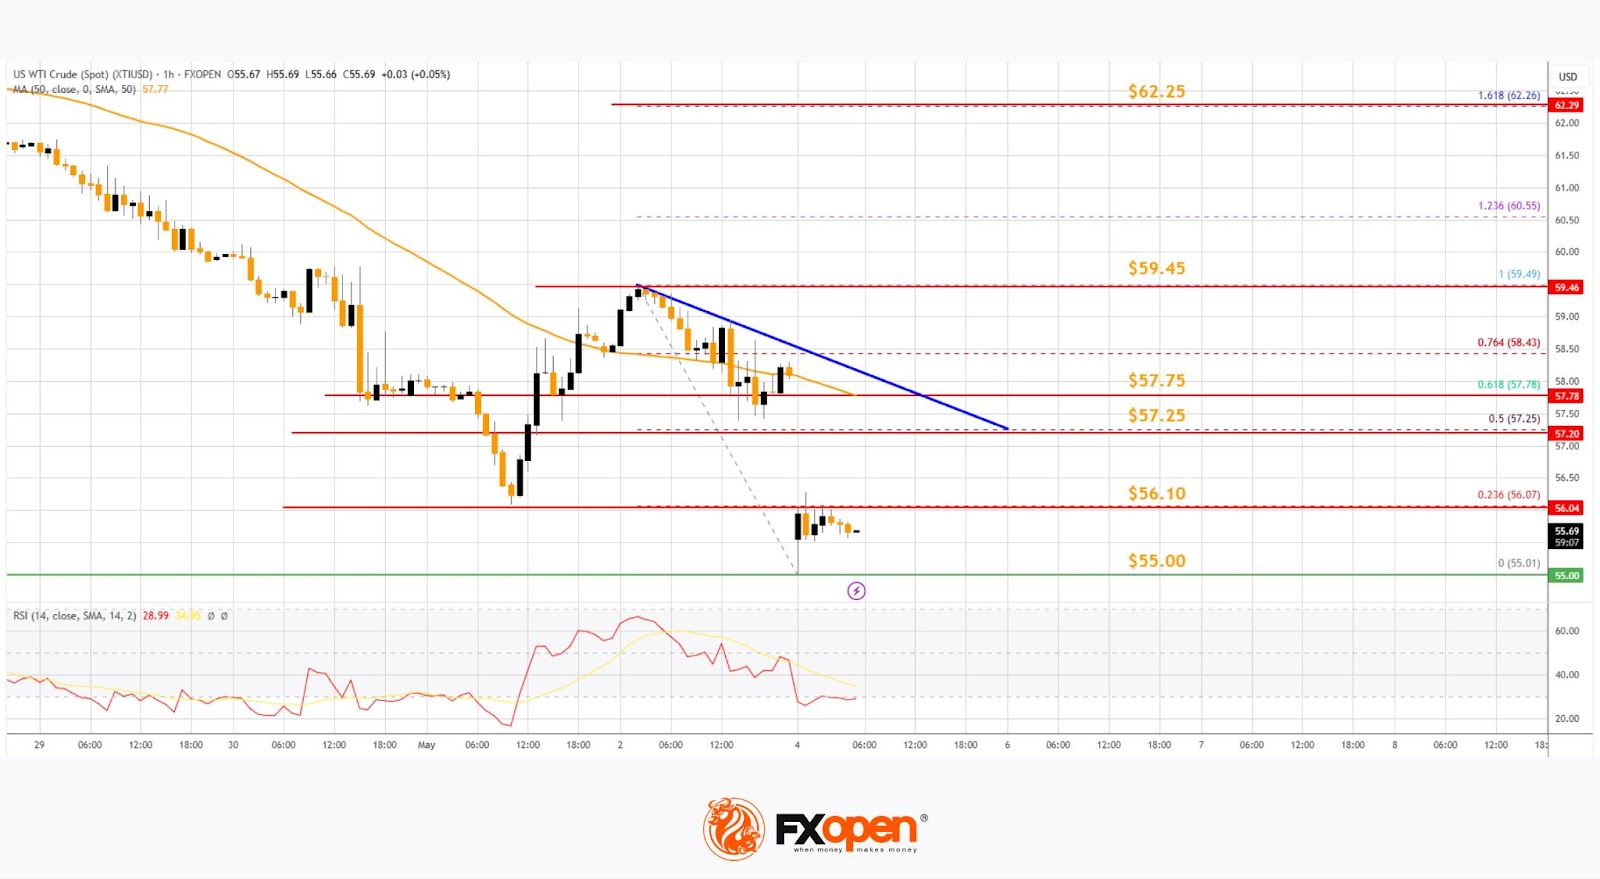
There was a minor move above the $55.50 level. On the upside, immediate resistance is near the $56.10 level and the 23.6% Fib retracement level of the downward move from the $59.49 swing high to the $55.01 low.
The next resistance is near the $57.25 level. There is also a major bearish trend line forming with resistance near $57.25. The trend line is near the 50% Fib retracement level of the downward move from the $59.49 swing high to the $55.01 low.
The main resistance is near a trend line at $57.75. A clear move above the $57.75 zone could send the price toward $59.45. The next key resistance is near $62.25. If the price climbs further higher, it could face resistance near $63.20. Any more gains might send the price toward the $65.00 level.
Immediate support is near the $55.00 level. The next major support on the WTI crude oil chart is near $53.00. If there is a downside break, the price might decline toward $52.00. Any more losses may perhaps open the doors for a move toward the $50.00 support zone.
Start trading commodity CFDs with tight spreads. Open your trading account now or learn more about trading commodity CFDs with FXOpen.
This article represents the opinion of the Companies operating under the FXOpen brand only. It is not to be construed as an offer, solicitation, or recommendation with respect to products and services provided by the Companies operating under the FXOpen brand, nor is it to be considered financial advice.
Swiss CPI drops to 0% as import deflation worsens
Swiss consumer price growth came to a standstill in April, with headline CPI unchanged month-on-month for a second consecutive month.
On an annual basis, inflation slowed sharply from 0.3% yoy to 0.0% yoy, marking a return to flat price levels not seen since the disinflationary spell of early 2021.
Core CPI (excluding fresh and seasonal products, energy and fuel) also lost momentum, easing from 0.9% yoy to 0.6% yoy.
The softness in inflation was driven by a decline in domestic product prices, which fell -0.1% mom and decelerated from 1.0% yoy to 0.8% yoy. Meanwhile, imported product prices offered a small offset, rising 0.3% mom but still contracting -2.5% yoy (prior -1.7% yoy).