Sample Category Title
GBP/USD Daily Outlook
Daily Pivots: (S1) 1.3250; (P) 1.3291; (R1) 1.3318; More...
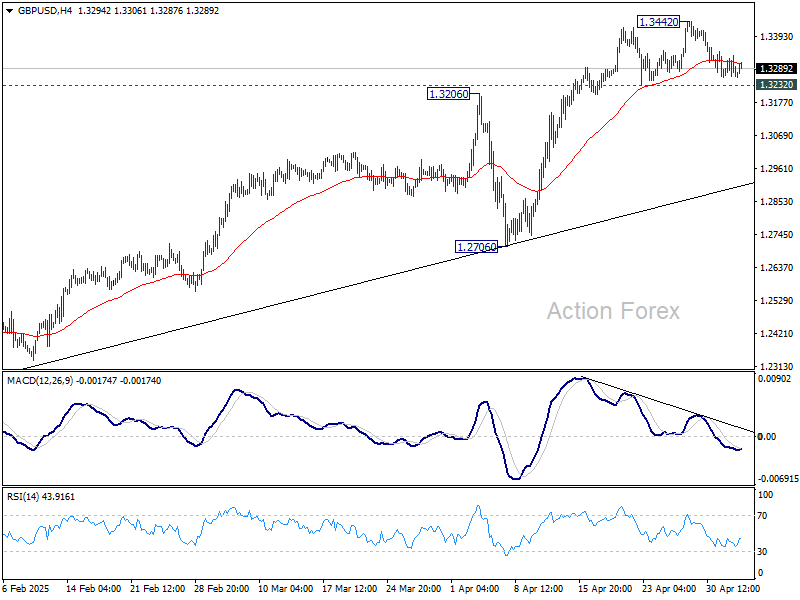
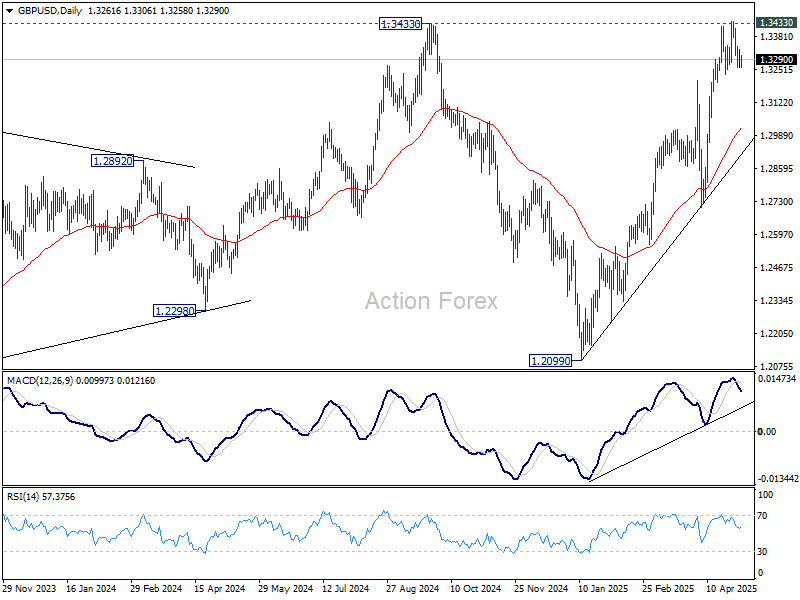
Intraday bias in GBP/USD remains neutral for the moment. On the downside, firm break of 1.3232 support will indicate short term topping and rejection by 1.3433 key resistance. Intraday bias will be back on the downside for deeper pullback to 55 D EMA (now at 1.3020) and possibly below. On the upside, firm break of 1.3433 key resistance confirm larger up trend resumption.
In the bigger picture, price actions from 1.3433 are seen as a corrective pattern to the up trend from 1.3051 (2022 low). Rise from 1.2099 could either be resuming the up trend, or the second leg of a consolidation pattern. Overall, GBP/USD should target 1.4248 key resistance (2021 high) on decisive break of 1.3433 at a later stage.
USD/CHF Daily Outlook
Daily Pivots: (S1) 0.8208; (P) 0.8264; (R1) 0.8321; More….
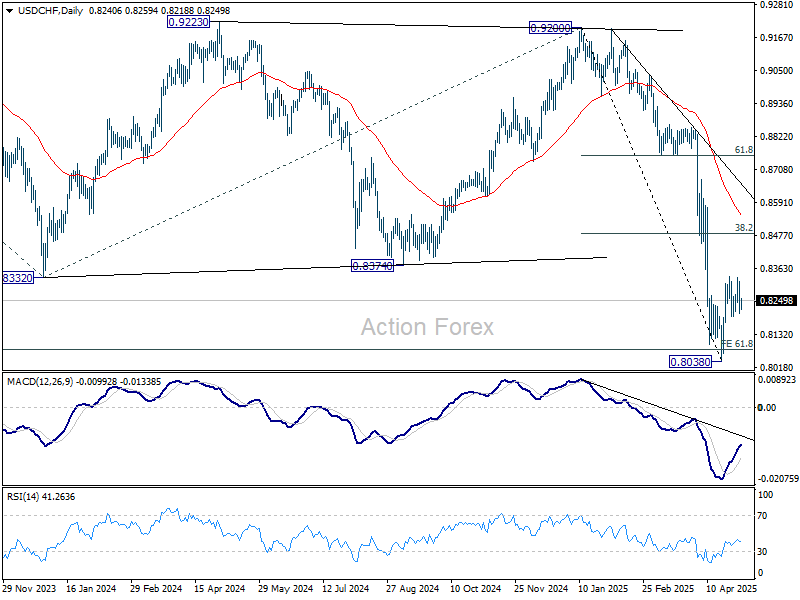
Intraday bias in USD/CHF remains neutral for the moment. On the upside, above 0.8333 will resume the rebound from 0.8038. However, upside should be limited by 38.2% retracement of 0.9200 to 0.8038 at 0.8482. On the downside, below 0.8196 minor support will bring retest of 0.8038. Firm break there will resume larger down trend.
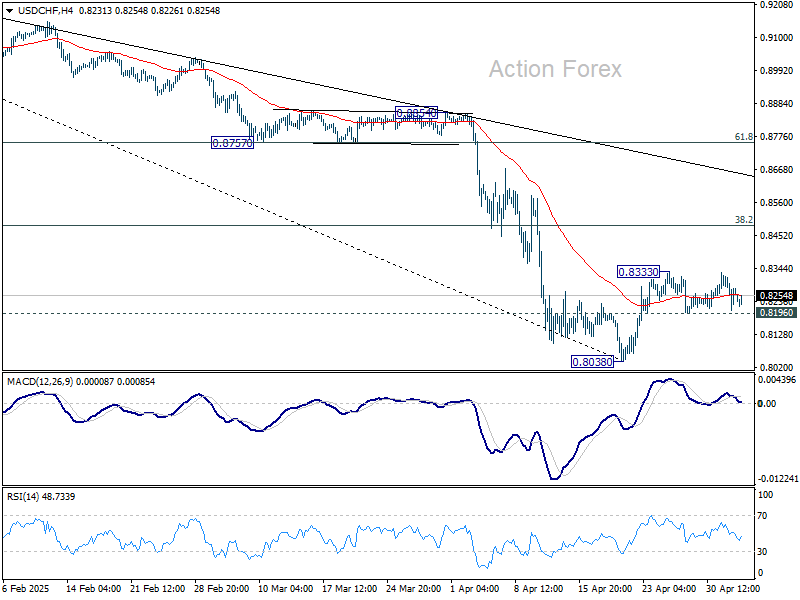
In the bigger picture, long term down trend from 1.0342 (2017 high) is still in progress and met 61.8% projection of 1.0146 (2022 high) to 0.8332 from 0.9200 at 0.8079 already. In any case, outlook will stay bearish as long as 55 W EMA (now at 0.8763) holds. Sustained break of 0.8079 will target 100% projection at 0.7382.
USD/CAD Daily Outlook
Daily Pivots: (S1) 1.3764; (P) 1.3813; (R1) 1.3866; More...
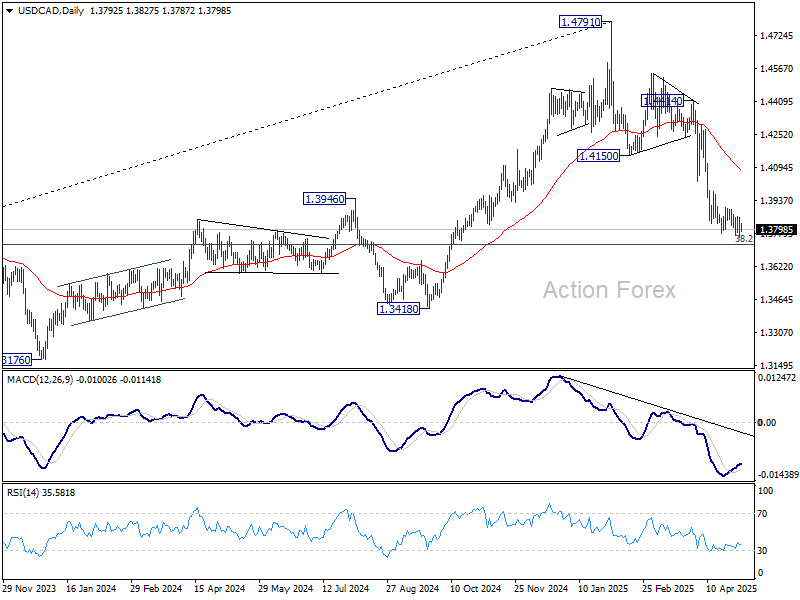
Intraday bias in USD/CAD stays mildly on the downside at this point. Fall from 1.4791 is in progress for 1.3727 fibonacci level next. On the upside, however, firm break of 1.3903 resistance should indicate short term bottoming, and turn bias back to the upside for stronger rebound.
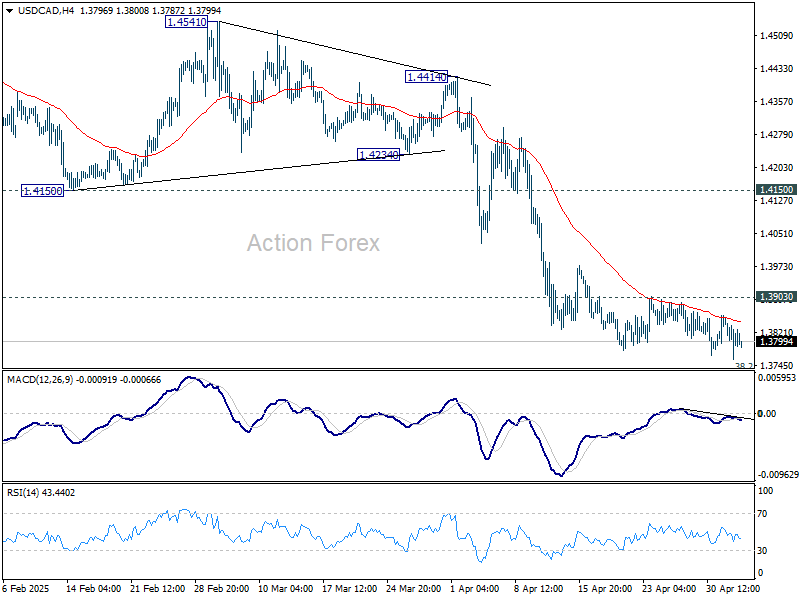
In the bigger picture, price actions from 1.4791 medium term top could either be a correction to rise from 1.2005 (2021 low), or trend reversal. In either case, further decline is expected as long as 1.4150 resistance turned support holds. Firm break of 38.2% retracement of 1.2005 (2021 low) to 1.4791 at 1.3727 will pave the way back to 61.8% retracement at 1.3069.
AUD/USD Daily Report
Daily Pivots: (S1) 0.6384; (P) 0.6427; (R1) 0.6484; More...
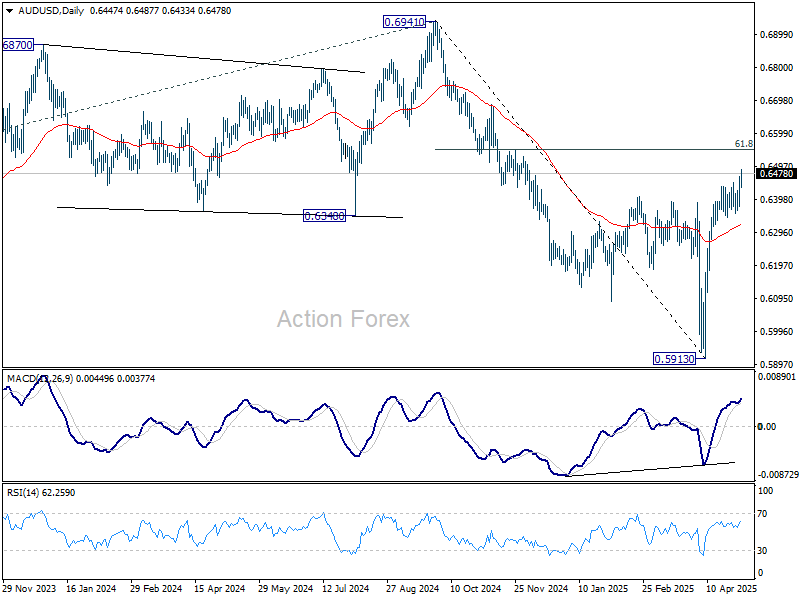
Intraday bias in AUD/USD remains on the upside for the moment. Rise from 0.5913 should continue to 61.8% retracement of 0.6941 to 0.5913 at 0.6548. On the downside, though, break of 0.6364 support will indicate short term topping, and turn bias to the downside for 55 D EMA (now at 0.6325) and below.
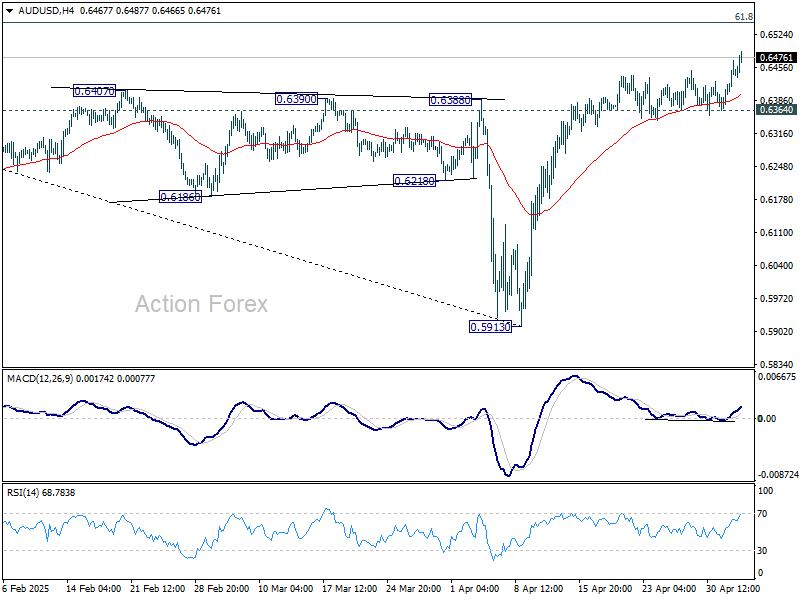
In the bigger picture, as long as 55 W EMA (now at 0.6443) holds, the down trend from 0.8006 (2021 high) should resume later to 61.8% projection of 0.8006 to 0.6169 from 0.6941 at 0.5806. However, sustained trading above 55 W EMA will argue that a medium term bottom was already formed, and set up further rebound to 0.6941 resistance instead.
Dollar Slips in Holiday Trade, Fed and BoE in Focus This Week
Dollar drifted lower in subdued trading, with many Asian markets closed for holidays. Movements in the currency markets elsewhere were mixed. Traditional safe havens like Yen and Swiss Franc inching higher. But at the same time, risk-sensitive currencies such as Australian and New Zealand Dollars also advanced. Overall risk sentiment lacking clear direction.
This lack of coherence highlights the current state of indecision. Traders are reasonable to be hesitant to take firm positions ahead of key events later in the week, including Fed and BoE rate decisions. Nevertheless, today's US ISM Services PMI might still inject some short-term volatility. The manufacturing sector in the US has held up better than expected despite tariff shocks. It's time for the services sector to face its own resilience test.
On the trade front, US President Donald Trump announced a new 100% tariff on foreign-produced films, citing what he called a “very fast death” of the US film industry due to global competition. He also signaled that new tariff decisions on select countries could be announced in the coming weeks if negotiations stall.
Meanwhile, Australian Prime Minister Anthony Albanese celebrated a landslide reelection and confirmed a "positive" conversation with Trump. Albanese reiterated continued engagement on AUKUS and tariff matters. However, despite the friendly rhetoric, markets remain wary of what’s next on the trade front.
Oil sinks as OPEC+ ramps up output again, WTI heading back to 4-yr low
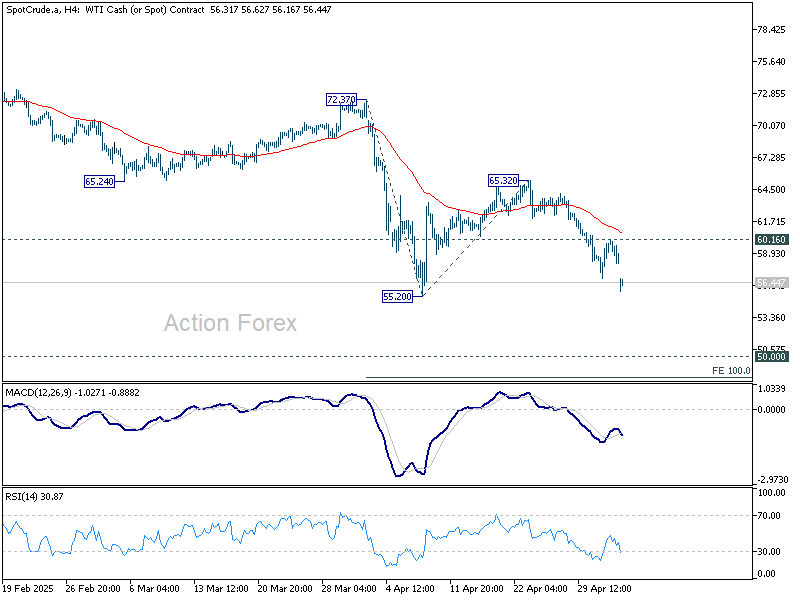
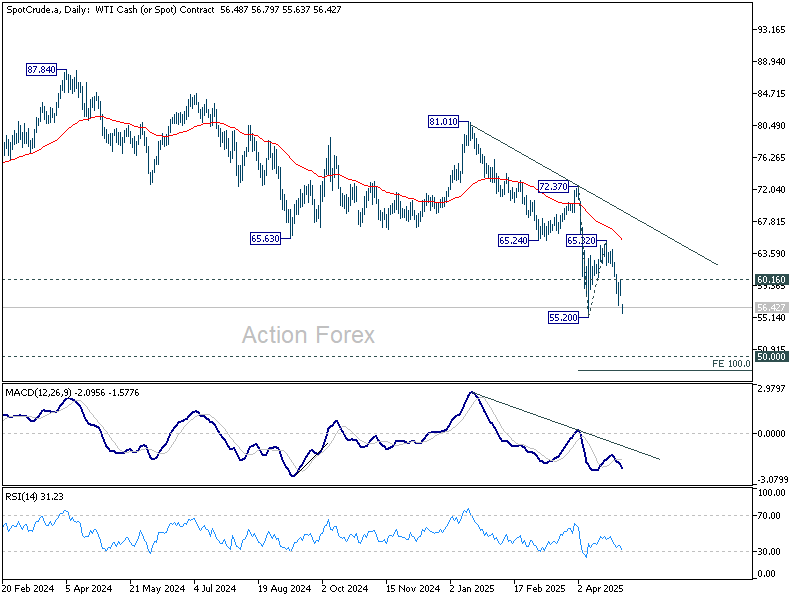
Oil prices opened the week with a sharp gap lower, as traders responded to OPEC+'s weekend agreement to accelerate output increases for a second straight month. WTI crude is now heading back toward the four-year low of $55.20 set in April.
OPEC+ will raise June production by 411k barrels per day. That brings the total additional supply from April to June to nearly one million barrels per day, representing 44% rollback of the group’s 2022-era production cuts.
This shift has stoked concerns that global oil markets may soon swing into surplus. The broader concern is that OPEC+ may fully unwind voluntary production cuts by October unless compliance among members improves. Such a move would flood the market with more supply just as global demand outlooks remain clouded by trade tensions.
Technically, prior rejection by 65.24 support turned resistance keeps WTI's long term down trend intact. Further decline is now expected as long as 60.16 resistance holds. Firm break of 55.20 low will confirm down trend resumption. WTI could then decline through 50 psychological level to 100% projection of 72.37 to 55.20 from 65.32 at 48.20.
Fed to hold, BoE to cut, and more global data
Two major central banks will meet this week: Fed and BoE.
Fed is widely expected to leave interest rates unchanged at 4.25–4.50%, a view fully priced in by markets with over 97% probability. As a result, there’s little room for surprise in the policy decision itself. Instead, attention will be on Chair Jerome Powell’s guidance—particularly on whether he hints at a rate cut in June.
However, following last week's solid non-farm payroll report, expectations have already tempered, with the probability of a June cut slipping to just 35%. Also, the US is in a 90-day tariff truce. Negotiations are said to be progressing. But any major developments, positive or negative, may not materialize until closer to early July.
Given this backdrop, Powell is expected to reiterate that Fed is not in a rush to cut rates again, maintaining a data-dependent and cautious stance, especially while inflation expectations remain sticky and labor markets resilient.
In the UK BoE is expected to proceed with a 25 bps rate cut, lowering its Bank Rate to 4.25%. Governor Andrew Bailey has recently emphasized the downside risks from global trade tensions, particularly after the IMF revised down UK and global growth forecasts.
Yet while rhetoric has turned more cautious, markets will be looking to BoE’s updated projections for confirmation on how these concerns are turning into numbers. Inflation progress and growth expectations will be critical in assessing whether BoE will stick to a steady quarterly cutting path.
Beyond the central banks, markets will be watching a series of key economic data. Highlights include US ISM Services PMI, employment data from Canada and New Zealand, Japan’s wage growth and household spending, Swiss CPI, and China’s trade balance.
Here are some highlights for the week:
- Monday: Swiss CPI; US ISM services.
- Tuesday: China Caixin PMI services; Swiss unemployment rate; EUrozone PMI services final, PPI; UK PMI services final; Canada trade balance; US trade balance.
- Wednesday: New Zealand employment; Germany factory orders; Swiss foreign currency reserves; UK PMI construction; Eurozone retail sales; FOMC rate decision.
- Thursday: BoJ minutes; Germany industrial production, trade balance; BoE rate decision; US jobless claims, non-farm productivity.
- Friday: Japan average cash earnings, household spending; China trade balance; Swiss SECO consumer climate; Canada employment.
AUD/USD Daily Report
Daily Pivots: (S1) 0.6384; (P) 0.6427; (R1) 0.6484; More...
Intraday bias in AUD/USD remains on the upside for the moment. Rise from 0.5913 should continue to 61.8% retracement of 0.6941 to 0.5913 at 0.6548. On the downside, though, break of 0.6364 support will indicate short term topping, and turn bias to the downside for 55 D EMA (now at 0.6325) and below.
In the bigger picture, as long as 55 W EMA (now at 0.6443) holds, the down trend from 0.8006 (2021 high) should resume later to 61.8% projection of 0.8006 to 0.6169 from 0.6941 at 0.5806. However, sustained trading above 55 W EMA will argue that a medium term bottom was already formed, and set up further rebound to 0.6941 resistance instead.
EUR/USD Targets Key Breakout — Fresh Upside Potential Growing
Key Highlights
- EUR/USD corrected gains and tested the 1.1265 support zone.
- A connecting bearish trend line is forming with resistance at 1.1340 on the 4-hour chart.
- GBP/USD is consolidating gains near the 1.3300 level.
- Crude oil prices declined and traded below the $57.20 support.
EUR/USD Technical Analysis
The Euro started a downside correction from 1.1570 against the US Dollar. EUR/USD dipped below 1.1450 and tested the 1.1265 support zone.
Looking at the 4-hour chart, the pair settled below the 100 simple moving average (red, 4-hour) but stayed above the 200 simple moving average (green, 4-hour). A low was formed at 1.1265 and the pair is now attempting a fresh increase. There was a move above the 1.1300 level.
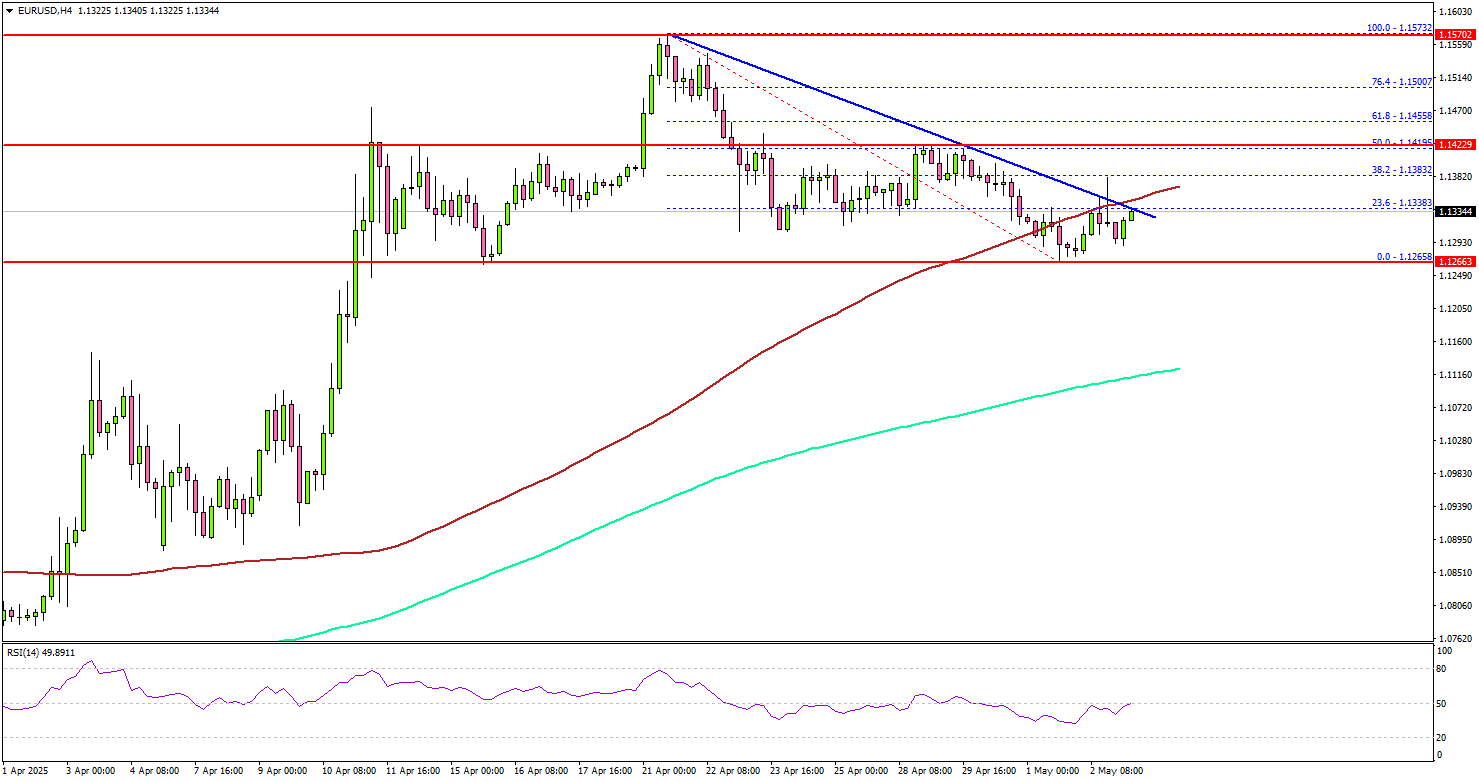
The pair is now facing resistance near the 1.1340 level and the 100 simple moving average (red, 4-hour). There is also a connecting bearish trend line forming with resistance at 1.1340 on the same chart.
An upside break above the trend line resistance could start a steady increase. The next major resistance is near the 1.1420 zone and the 50% Fib retracement level of the downward move from the 1.1572 swing high to the 1.1265 low.
A close above the 1.1420 level could set the tone for another increase. In the stated case, the pair could even clear the 1.1500 resistance.
On the downside, immediate support sits near the 1.1280 level. The next key support sits near the 1.1265 level. Any more losses could send the pair toward the 1.1150 level.
Looking at Crude oil, the price declined further and the bears were able to push the price toward the $55.00 support zone.
Upcoming Economic Events:
- US S&P Global Services PMI for April 2025 – Forecast 51.4, versus 51.4 previous.
- US ISM Services Index for April 2025 – Forecast 50.6, versus 50.8 previous.
Oil sinks as OPEC+ ramps up output again, WTI heading back to 4-yr low
Oil prices opened the week with a sharp gap lower, as traders responded to OPEC+'s weekend agreement to accelerate output increases for a second straight month. WTI crude is now heading back toward the four-year low of $55.20 set in April.
OPEC+ will raise June production by 411k barrels per day. That brings the total additional supply from April to June to nearly one million barrels per day, representing 44% rollback of the group’s 2022-era production cuts.
This shift has stoked concerns that global oil markets may soon swing into surplus. The broader concern is that OPEC+ may fully unwind voluntary production cuts by October unless compliance among members improves. Such a move would flood the market with more supply just as global demand outlooks remain clouded by trade tensions.
Technically, prior rejection by 65.24 support turned resistance keeps WTI's long term down trend intact. Further decline is now expected as long as 60.16 resistance holds. Firm break of 55.20 low will confirm down trend resumption. WTI could then decline through 50 psychological level to 100% projection of 72.37 to 55.20 from 65.32 at 48.20.
GOLD ($XAUUSD) Elliott Wave : Incomplete Sequences Calling the Decline
Hello fellow traders. In this technical article we’re going to look at the Elliott Wave charts of GOLD ($XAUUSD ) published in members area of the website. As our members know, XAUUSD is forming a correction against the 2954.2 low. In the following text, we’ll explain the Elliott Wave analysis and outline the target areas.
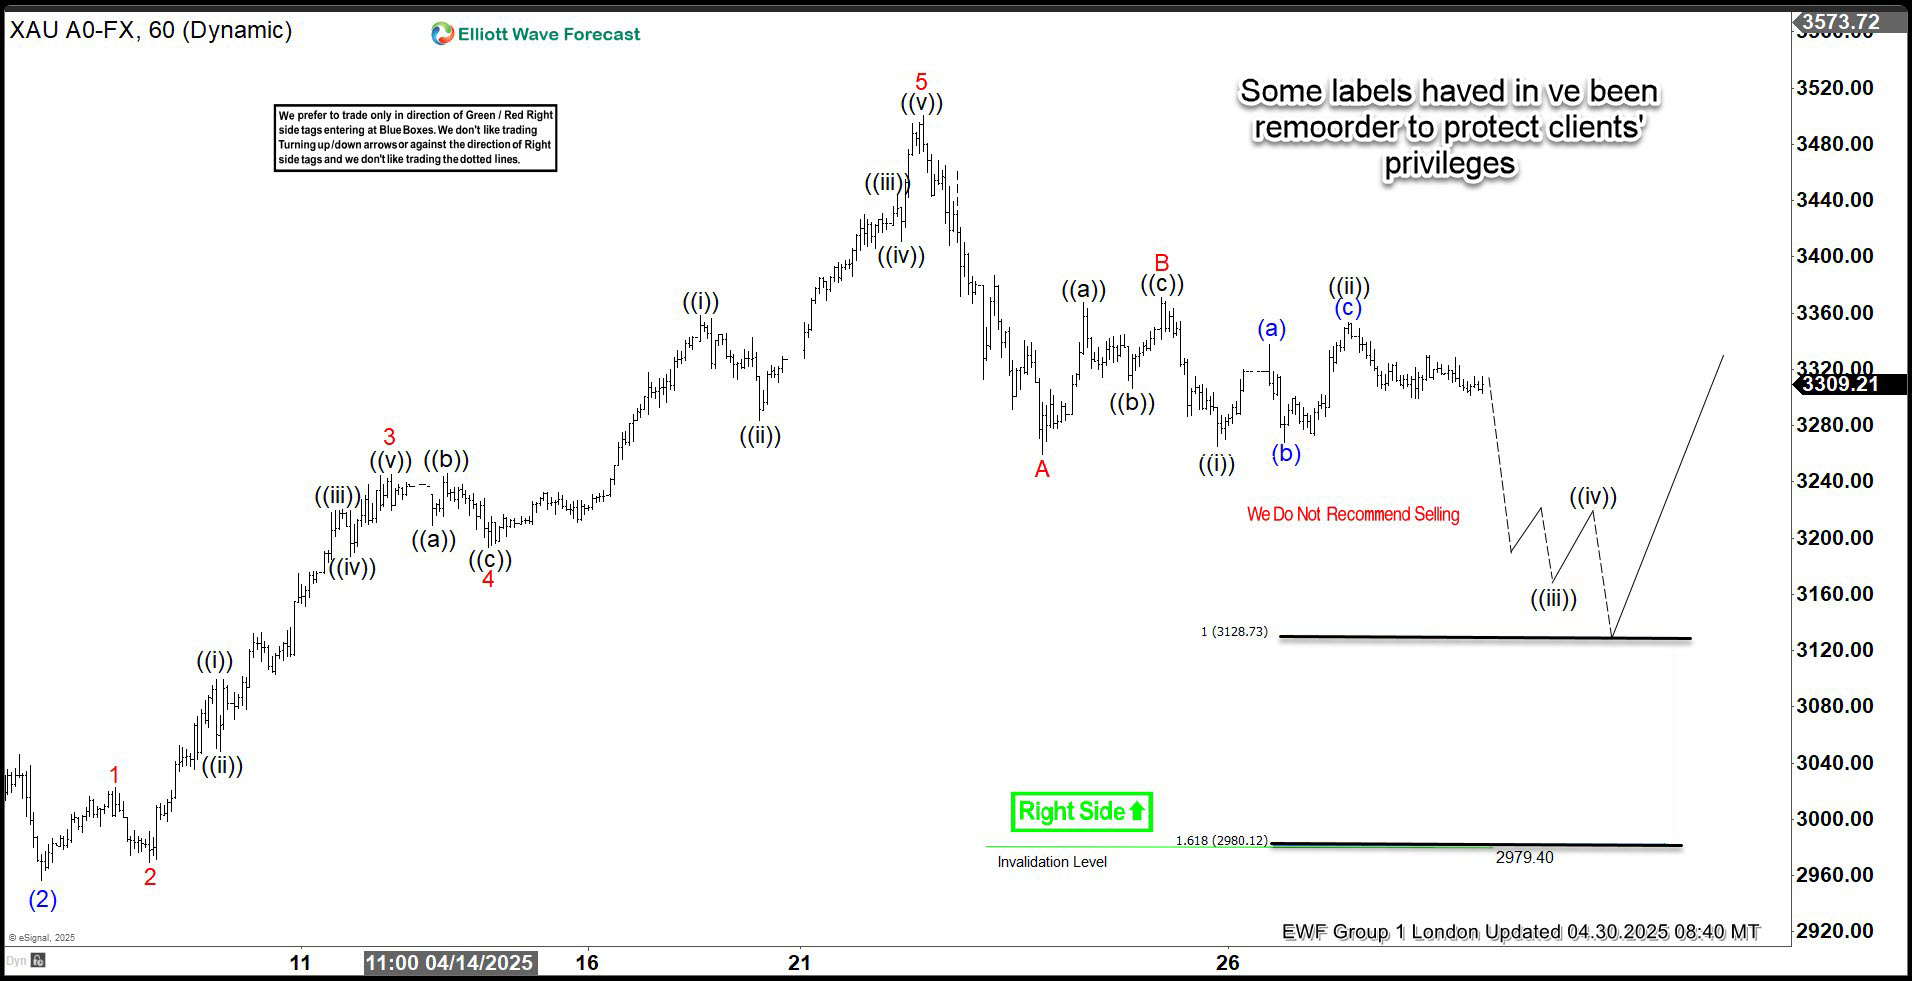
XAUUSD Elliott Wave 1 Hour Chart 04.30.2025
The price structure shows incomplete sequences from the April 22nd peak. The price broke below the 3260 level, confirming a potential extension to the downside.
As long as the price remains below the 3352.9 peak, we consider the intraday wave ((ii)) bounce completed and anticipate further decline in the near term.
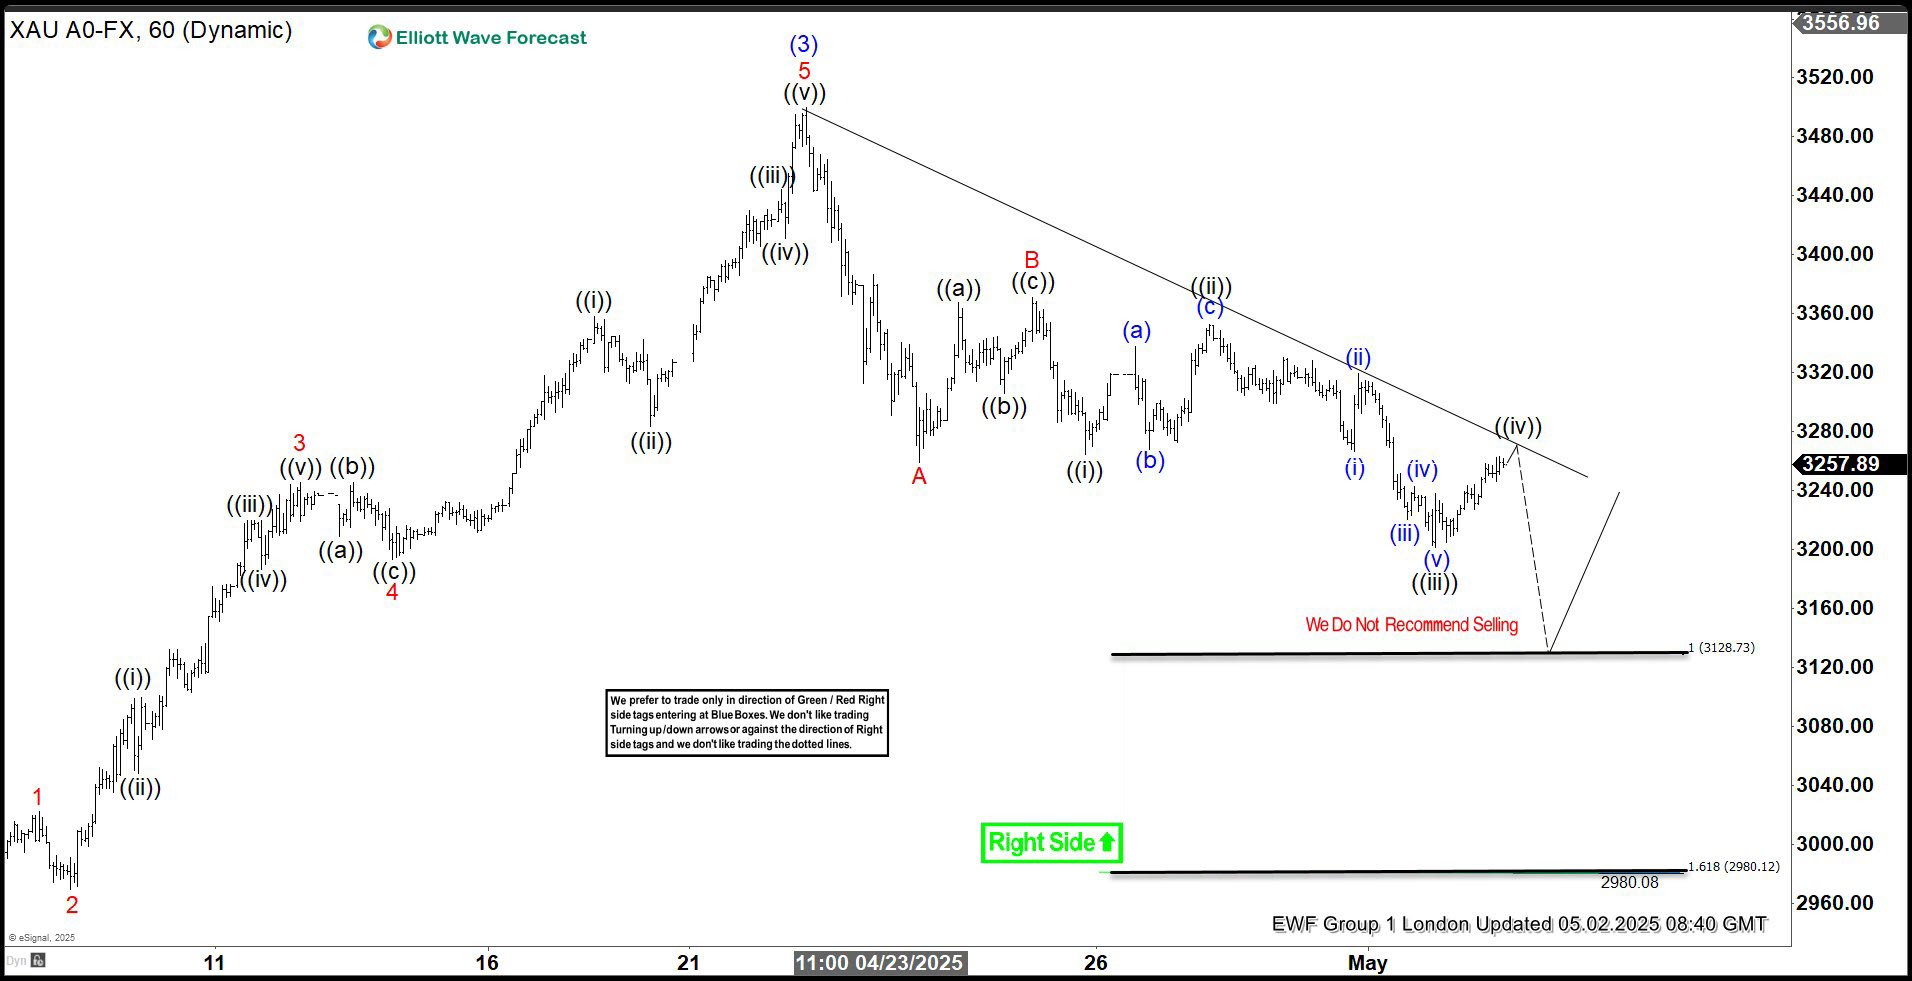
XAUUSD Elliott Wave 1 Hour Chart 05.02.2025
GOLD continued to drop as expected. The price broke to new lows, confirming the extension toward the 3128.7–2980.2 area.
We do not recommend selling at this point. If the marked extreme zone is reached, we will consider entering long positions again.
GBPAUD Wave Analysis
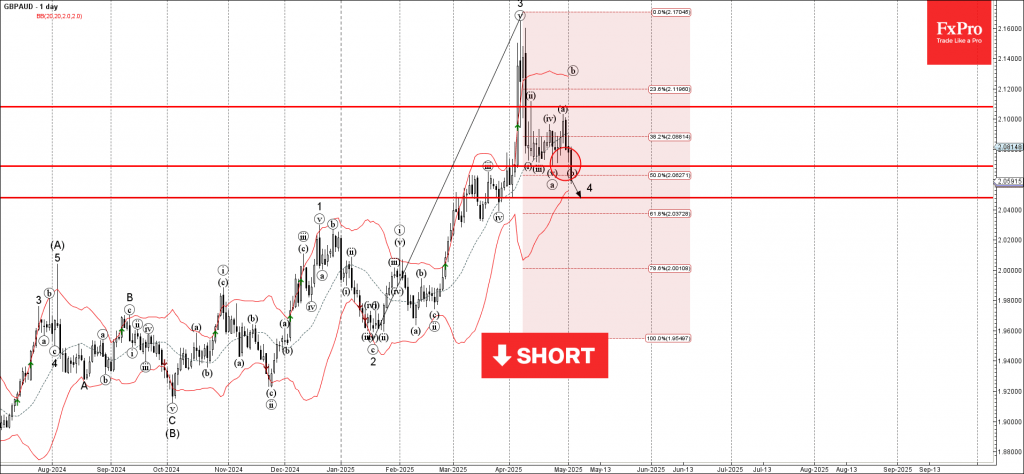
GBPAUD: ⬇️ Sell
- GBPAUD broke support zone
- Likely to fall to support level 2.0475
GBPAUD currency pair recently broke the support zone between the pivotal support level 2.0685 (which stopped the previous waves i, iii, v) and the 50% Fibonacci correction of the upward impulse from January.
The breakout of this support zone continues the c-wave of the active ABC correction 4 from the start of April.
GBPAUD can be expected to fall to the next support level 2.0475 (target price for the completion of the active correction 4).
Dow Jones Wave Analysis
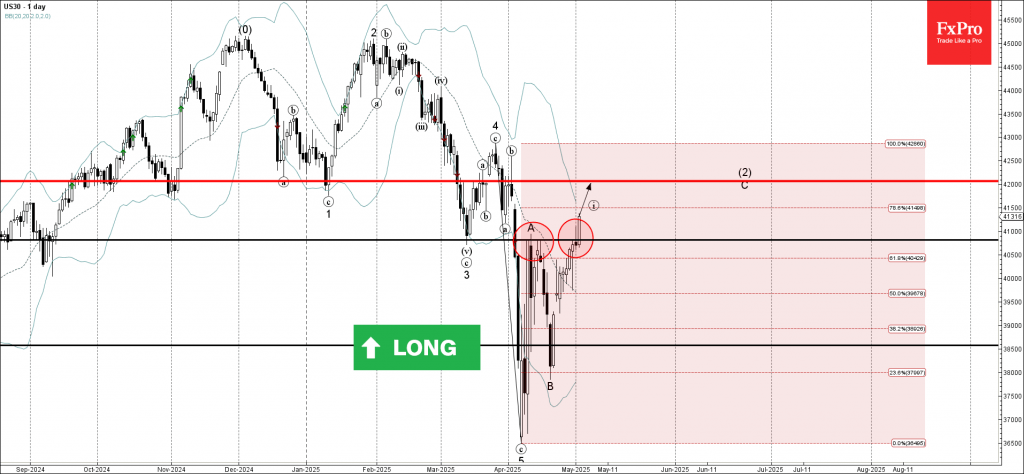
Dow Jones: ⬆️ Buy
- Dow Jones broke resistance zone
- Likely to rise to resistance level 42000.00
Dow Jones index recently broke the resistance zone between the pivotal resistance level 40815 (former support from March and the top of wave A from the start of April) and the 61.8% Fibonacci correction of the downward impulse 5 from March.
The breakout of this resistance zone continues the C-wave of the active ABC correction (2) from the start of April.
Dow Jones index can be expected to rise to the next resistance level 42000.00 (target price for the completion of the active impulse wave C).