
Sample Category Title
EUR/GBP Weekly Outlook
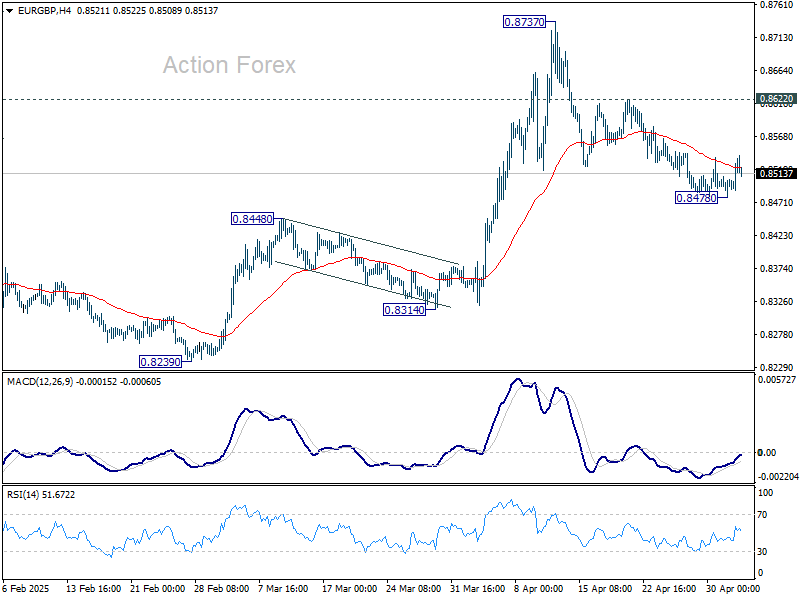
EUR/GBP's edged lower to 0.8478 last week but recovered since then. Initial bias is turned neutral this week first. On the downside, below 0.8478 will target 55 D EMA (now at 0.8455). Sustained trading below there will suggest that whole rise from 0.8221 has already complete and turn outlook bearish. However, break of 0.8622 resistance will suggest that the correction from 0.8737 has completed, and retain near term bullishness.
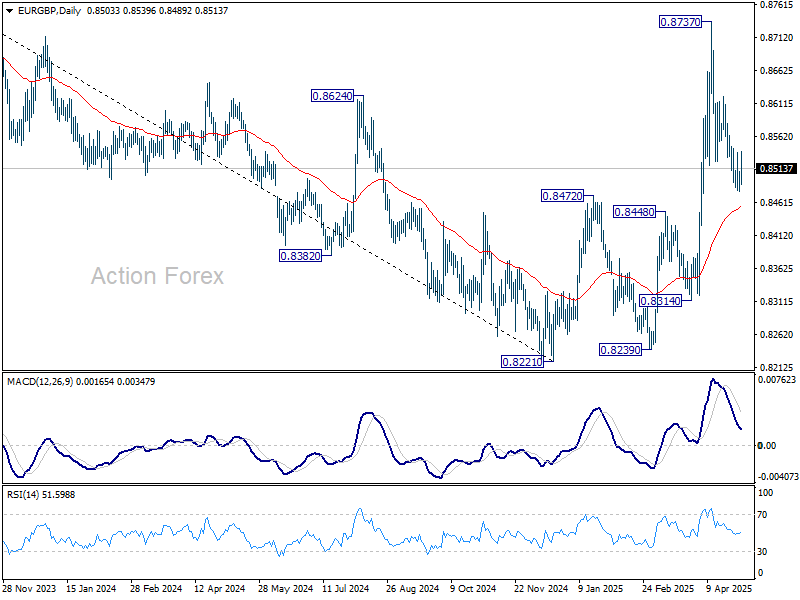
In the bigger picture, down trend from 0.9267 (2022 high) should have completed at 0.8221, just ahead of 0.9201 key support (2024 low). Rise from 0.8221 is likely reversing the whole fall. Further rise should be seen to 61.8% retracement of 0.9267 to 0.8221 at 0.8867 next. This will remain the favored case as long as 0.8472 resistance turned support holds.
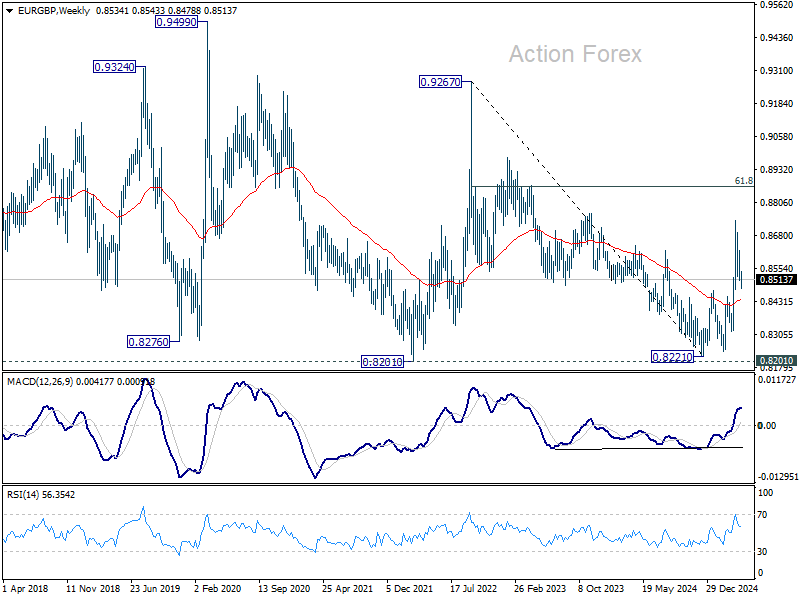
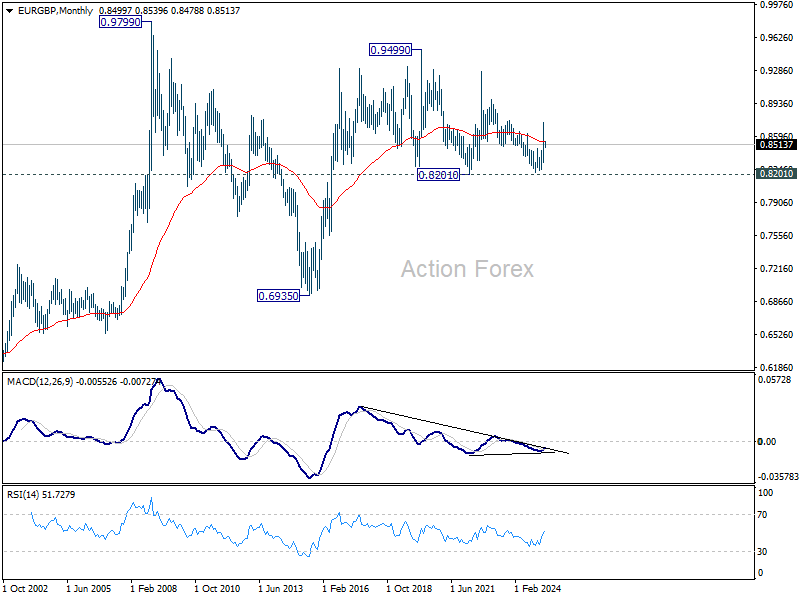
In the long term picture, price action from 0.9499 (2020 high) is seen as part of the long term range pattern from 0.9799 (2008 high). Range trading should continue between 0.8201 and 0.9499, until there is clear signal of imminent breakout.
EUR/AUD Weekly Outlook
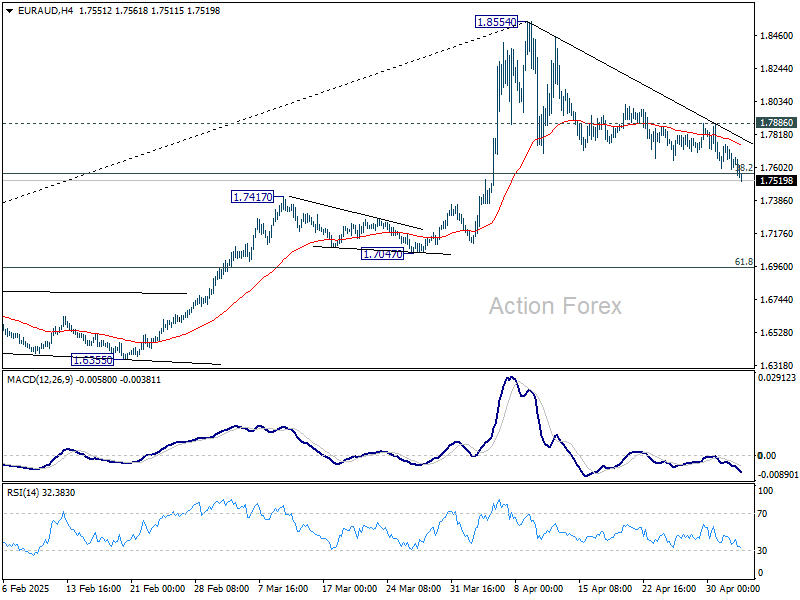
EUR/AUD's fall from 1.8554 extended lower last week and picked up some momentum. The close below 38.2% retracement of 1.5963 to 1.8854 at 1.7750 dampened our original view. Initial bias is now on the downside this week for 55 D EMA (now at 1.7410). Sustained break there will target 61.8% retracement at 1.6953. On the upside, though, break of 1.7886 resistance will turn bias back to the upside for retesting 1.8554 high.
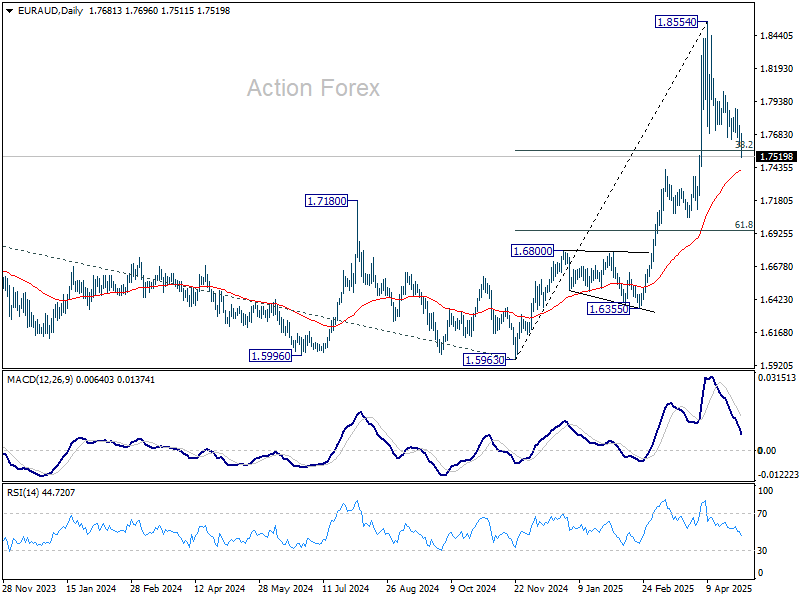
In the bigger picture, up trend from 1.4281 (2022 low) is in progress for 100% projection of 1.4281 to 1.7062 from 1.5963 at 1.8744. Firm break there will pave the way to 138.2% projection at 1.9806, which is close to 1.9799 (2020 high). Outlook will remain bullish as long as 1.7062 resistance turned support (2023 high) holds even in case of deep pullback.
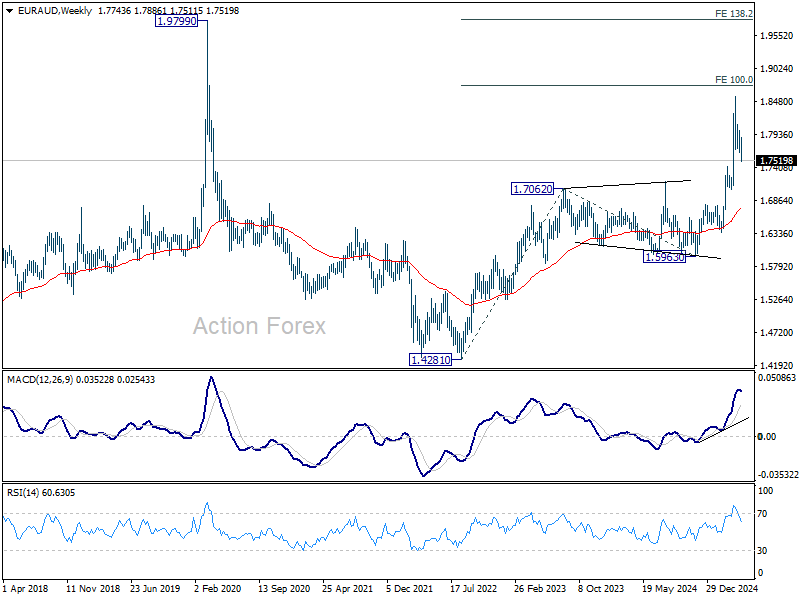
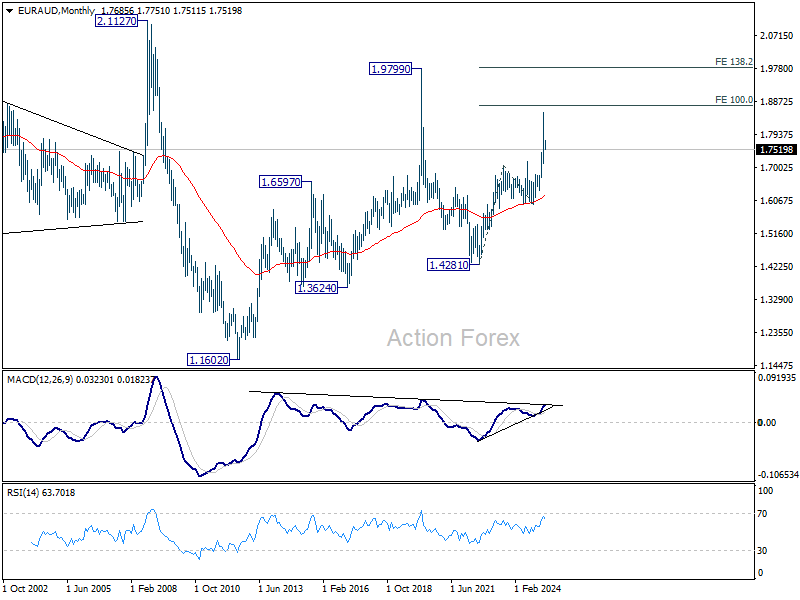
In the longer term picture, rise from 1.4281 is seen as the second leg of the pattern from 1.9799 (2020 high), which is part of the pattern from 2.1127 (2008 high). As long as 55 M EMA (now at 1.6199) holds, this second leg could still extend higher. However, firm break of the above mention 1.8744 projection level with strong momentum will argue that it's indeed resuming the up trend from 1.1602 (2012 low).
EUR/CHF Weekly Outlook
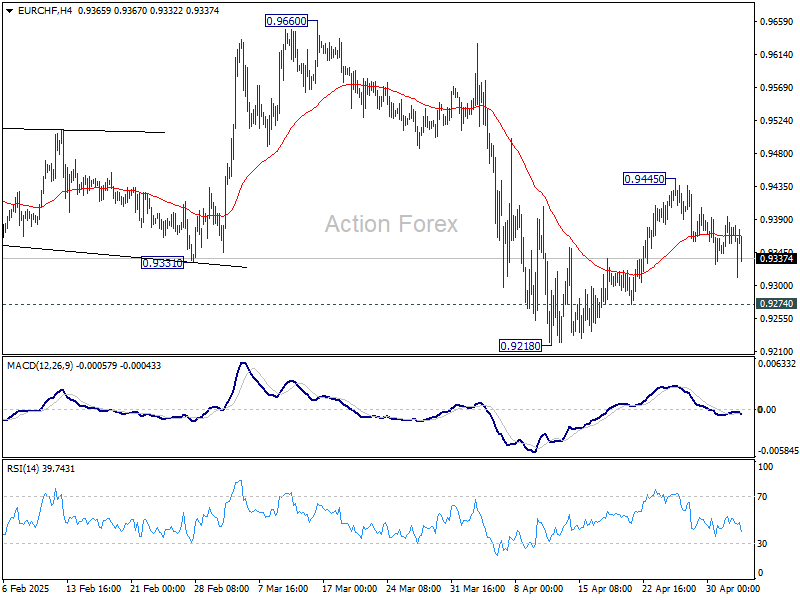
EUR/CHF gyrated lower last week but lacked convincing momentum. Initial bias remains neutral this week first. On the upside, above 0.9445 will resume the rebound from 0.9218, either as a corrective move or the third leg of the pattern from 0.9204. However, break of 0.9274 will suggest that that recovery has completed, and bring retest of 0.9204/18 support zone.
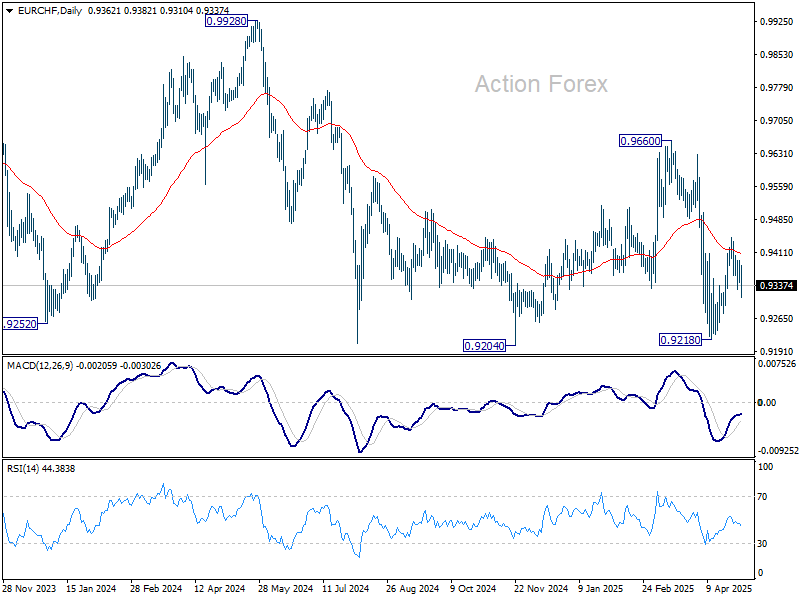
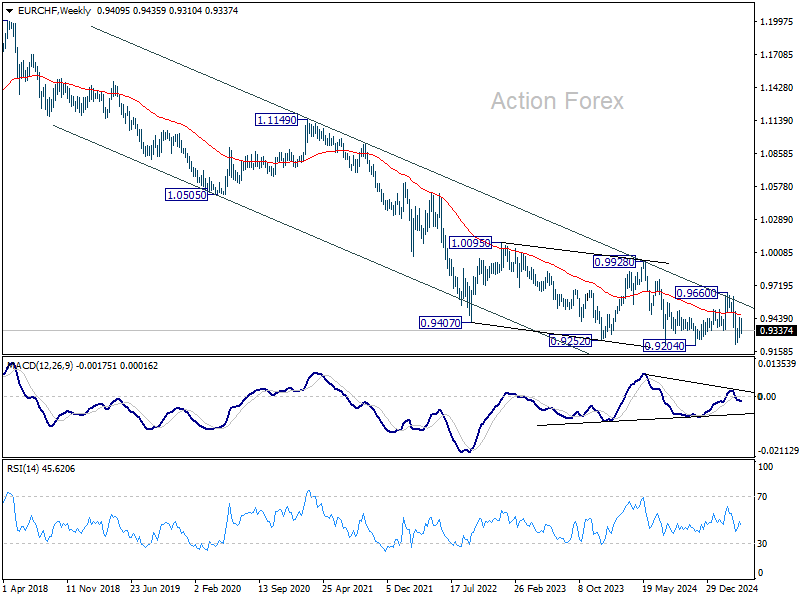
In the bigger picture, prior rejection by long-term falling channel resistance (now at 0.9555) retains medium term bearishness. That is, down trend from 1.2004 (2018 high) is still in progress. Firm break of 0.9204 (2024 low) will confirm resumption. This will remain the favored case as long as 0.9660 resistance holds.
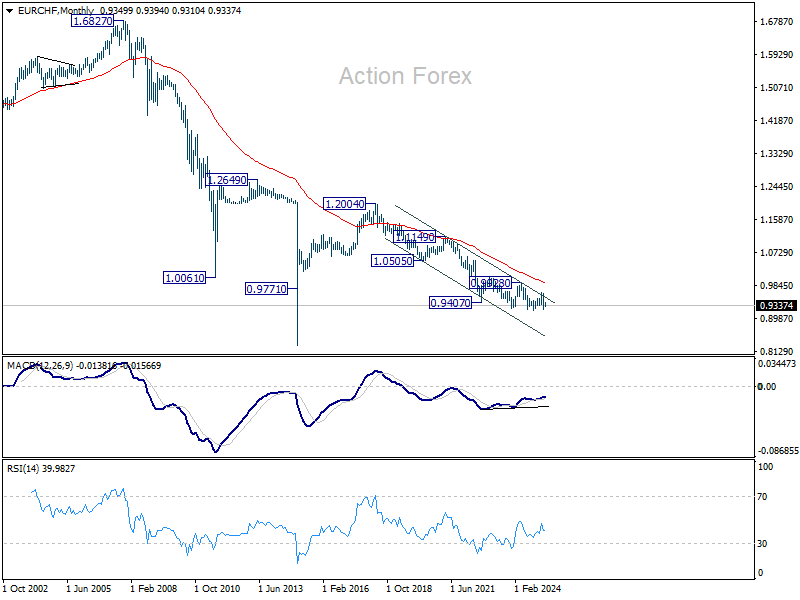
In the long term picture, overall long term down trend is still in force in EUR/CHF. Outlook will continue to stay bearish as long as 55 M EMA (now at 0.9919) holds.
Summary 5/5 – 5/9
Monday, May 5, 2025
| GMT | Ccy | Events | Consensus | Previous |
|---|---|---|---|---|
| 01:00 | AUD | TD-MI Inflation Gauge M/M Apr | 0.70% | |
| 06:30 | CHF | CPI M/M Apr | 0.20% | 0.00% |
| 06:30 | CHF | CPI Y/Y Apr | 0.30% | |
| 08:30 | EUR | Eurozone Sentix Investor Confidence May | -14.9 | -19.5 |
| 13:45 | USD | Services PMI Apr F | 51.4 | 51.4 |
| 14:00 | USD | ISM Services PMI Apr | 50.6 | 50.8 |
| GMT | Ccy | Events | |
|---|---|---|---|
| 01:00 | AUD | TD-MI Inflation Gauge M/M Apr | |
| Forecast: | Previous: 0.70% | ||
| 06:30 | CHF | CPI M/M Apr | |
| Forecast: 0.20% | Previous: 0.00% | ||
| 06:30 | CHF | CPI Y/Y Apr | |
| Forecast: | Previous: 0.30% | ||
| 08:30 | EUR | Eurozone Sentix Investor Confidence May | |
| Forecast: -14.9 | Previous: -19.5 | ||
| 13:45 | USD | Services PMI Apr F | |
| Forecast: 51.4 | Previous: 51.4 | ||
| 14:00 | USD | ISM Services PMI Apr | |
| Forecast: 50.6 | Previous: 50.8 | ||
Tuesday, May 6, 2025
| GMT | Ccy | Events | Consensus | Previous |
|---|---|---|---|---|
| 01:30 | AUD | Building Permits M/M Mar | -1.70% | -0.30% |
| 01:45 | CNY | Caixin Services PMI Apr | 51.7 | 51.9 |
| 06:45 | EUR | France Industrial Output M/M Mar | 0.40% | 0.70% |
| 07:50 | EUR | France Services PMI Apr F | 46.8 | 46.8 |
| 07:55 | EUR | Germany Services PMI Apr F | 48.8 | 48.8 |
| 08:00 | EUR | Eurozone Services PMI Apr F | 49.7 | 49.7 |
| 08:30 | GBP | Services PMI Apr F | 48.9 | 48.9 |
| 09:00 | EUR | Eurozone PPI M/M Mar | -1.10% | 0.20% |
| 09:00 | EUR | Eurozone PPI Y/Y Mar | 3% | |
| 12:30 | CAD | Trade Balance (CAD) Mar | -1.7B | -1.5B |
| 12:30 | USD | Trade Balance (USD) Mar | -124.7B | -122.7B |
| 14:00 | CAD | Ivey PMI Apr | 51.2 | 51.3 |
| 22:45 | NZD | Employment Change Q1 | 0.10% | -0.10% |
| 22:45 | NZD | Unemployment Rate Q1 | 5.30% | 5.10% |
| 22:45 | NZD | Labour Cost Index Q/Q Q1 | 0.50% | 0.60% |
| GMT | Ccy | Events | |
|---|---|---|---|
| 01:30 | AUD | Building Permits M/M Mar | |
| Forecast: -1.70% | Previous: -0.30% | ||
| 01:45 | CNY | Caixin Services PMI Apr | |
| Forecast: 51.7 | Previous: 51.9 | ||
| 06:45 | EUR | France Industrial Output M/M Mar | |
| Forecast: 0.40% | Previous: 0.70% | ||
| 07:50 | EUR | France Services PMI Apr F | |
| Forecast: 46.8 | Previous: 46.8 | ||
| 07:55 | EUR | Germany Services PMI Apr F | |
| Forecast: 48.8 | Previous: 48.8 | ||
| 08:00 | EUR | Eurozone Services PMI Apr F | |
| Forecast: 49.7 | Previous: 49.7 | ||
| 08:30 | GBP | Services PMI Apr F | |
| Forecast: 48.9 | Previous: 48.9 | ||
| 09:00 | EUR | Eurozone PPI M/M Mar | |
| Forecast: -1.10% | Previous: 0.20% | ||
| 09:00 | EUR | Eurozone PPI Y/Y Mar | |
| Forecast: | Previous: 3% | ||
| 12:30 | CAD | Trade Balance (CAD) Mar | |
| Forecast: -1.7B | Previous: -1.5B | ||
| 12:30 | USD | Trade Balance (USD) Mar | |
| Forecast: -124.7B | Previous: -122.7B | ||
| 14:00 | CAD | Ivey PMI Apr | |
| Forecast: 51.2 | Previous: 51.3 | ||
| 22:45 | NZD | Employment Change Q1 | |
| Forecast: 0.10% | Previous: -0.10% | ||
| 22:45 | NZD | Unemployment Rate Q1 | |
| Forecast: 5.30% | Previous: 5.10% | ||
| 22:45 | NZD | Labour Cost Index Q/Q Q1 | |
| Forecast: 0.50% | Previous: 0.60% | ||
Wednesday, May 7, 2025
| GMT | Ccy | Events | Consensus | Previous |
|---|---|---|---|---|
| 00:30 | JPY | Services PMI Apr F | 50 | |
| 06:00 | EUR | Germany Factory Orders M/M Mar | 1.10% | 0.00% |
| 07:00 | CHF | Foreign Currency Reserves (CHF) Apr | 726B | |
| 08:30 | GBP | Construction PMI Apr | 46 | 46.4 |
| 09:00 | EUR | Eurozone Retail Sales M/M Mar | -0.10% | 0.30% |
| 14:30 | USD | Crude Oil Inventories | -2.7M | |
| 18:00 | USD | Fed Interest Rate Decision | 4.50% | 4.50% |
| 18:30 | USD | FOMC Press Conference | ||
| 23:01 | GBP | RICS Housing Price Balance Apr | -4% | 2% |
| 23:50 | JPY | BoJ Minutes |
| GMT | Ccy | Events | |
|---|---|---|---|
| 00:30 | JPY | Services PMI Apr F | |
| Forecast: | Previous: 50 | ||
| 06:00 | EUR | Germany Factory Orders M/M Mar | |
| Forecast: 1.10% | Previous: 0.00% | ||
| 07:00 | CHF | Foreign Currency Reserves (CHF) Apr | |
| Forecast: | Previous: 726B | ||
| 08:30 | GBP | Construction PMI Apr | |
| Forecast: 46 | Previous: 46.4 | ||
| 09:00 | EUR | Eurozone Retail Sales M/M Mar | |
| Forecast: -0.10% | Previous: 0.30% | ||
| 14:30 | USD | Crude Oil Inventories | |
| Forecast: | Previous: -2.7M | ||
| 18:00 | USD | Fed Interest Rate Decision | |
| Forecast: 4.50% | Previous: 4.50% | ||
| 18:30 | USD | FOMC Press Conference | |
| Forecast: | Previous: | ||
| 23:01 | GBP | RICS Housing Price Balance Apr | |
| Forecast: -4% | Previous: 2% | ||
| 23:50 | JPY | BoJ Minutes | |
| Forecast: | Previous: | ||
Thursday, May 8, 2025
| GMT | Ccy | Events | Consensus | Previous |
|---|---|---|---|---|
| 05:45 | CHF | Unemployment Rate M/M Apr | 2.80% | |
| 06:00 | EUR | Germany Industrial Production M/M Feb | 0.80% | -1.30% |
| 06:00 | EUR | Germany Trade Balance (EUR) Mar | 18.8B | 17.7B |
| 11:00 | GBP | BoE Interest Rate Decision | 4.25% | 4.50% |
| 11:00 | GBP | MPC Official Bank Rate Votes | 0--9--0 | 0--1--8 |
| 12:30 | USD | Initial Jobless Claims (May 2) | 235K | 241K |
| 12:30 | USD | Nonfarm Productivity Q1 P | -0.40% | 1.50% |
| 12:30 | USD | Unit Labor Costs Q1 P | 5.30% | 2.20% |
| 14:00 | USD | Wholesale Inventories Mar F | 0.50% | 0.50% |
| 14:30 | USD | Natural Gas Storage | 107B | |
| 23:30 | JPY | Labor Cash Earnings Y/Y Mar | 2.60% | 2.70% |
| 23:30 | JPY | Household Spending Y/Y Mar | 0.20% | -0.50% |
| GMT | Ccy | Events | |
|---|---|---|---|
| 05:45 | CHF | Unemployment Rate M/M Apr | |
| Forecast: | Previous: 2.80% | ||
| 06:00 | EUR | Germany Industrial Production M/M Feb | |
| Forecast: 0.80% | Previous: -1.30% | ||
| 06:00 | EUR | Germany Trade Balance (EUR) Mar | |
| Forecast: 18.8B | Previous: 17.7B | ||
| 11:00 | GBP | BoE Interest Rate Decision | |
| Forecast: 4.25% | Previous: 4.50% | ||
| 11:00 | GBP | MPC Official Bank Rate Votes | |
| Forecast: 0--9--0 | Previous: 0--1--8 | ||
| 12:30 | USD | Initial Jobless Claims (May 2) | |
| Forecast: 235K | Previous: 241K | ||
| 12:30 | USD | Nonfarm Productivity Q1 P | |
| Forecast: -0.40% | Previous: 1.50% | ||
| 12:30 | USD | Unit Labor Costs Q1 P | |
| Forecast: 5.30% | Previous: 2.20% | ||
| 14:00 | USD | Wholesale Inventories Mar F | |
| Forecast: 0.50% | Previous: 0.50% | ||
| 14:30 | USD | Natural Gas Storage | |
| Forecast: | Previous: 107B | ||
| 23:30 | JPY | Labor Cash Earnings Y/Y Mar | |
| Forecast: 2.60% | Previous: 2.70% | ||
| 23:30 | JPY | Household Spending Y/Y Mar | |
| Forecast: 0.20% | Previous: -0.50% | ||
Friday, May 9, 2025
| GMT | Ccy | Events | Consensus | Previous |
|---|---|---|---|---|
| 03:00 | CNY | Trade Balance (USD) Apr | 94.3B | 102.6B |
| 05:00 | JPY | Leading Economic Index Mar P | 107.4 | 107.9 |
| 12:30 | CAD | Net Change in Employment Apr | 24.5K | -32.6K |
| 12:30 | CAD | Unemployment Rate Apr | 6.70% | 6.70% |
| GMT | Ccy | Events | |
|---|---|---|---|
| 03:00 | CNY | Trade Balance (USD) Apr | |
| Forecast: 94.3B | Previous: 102.6B | ||
| 05:00 | JPY | Leading Economic Index Mar P | |
| Forecast: 107.4 | Previous: 107.9 | ||
| 12:30 | CAD | Net Change in Employment Apr | |
| Forecast: 24.5K | Previous: -32.6K | ||
| 12:30 | CAD | Unemployment Rate Apr | |
| Forecast: 6.70% | Previous: 6.70% | ||
Markets Weekly Outlook – Central Banks in Focus as Risk Appetite Improves
- US-China trade optimism improved market sentiment, though US funds still saw outflows.
- Gold and precious metals experienced net sales after 12 weeks of inflows.
- The Federal Reserve is expected to hold rates steady, while UK rates may be cut.
- The US Dollar Index is poised for a potential technical breakout above 100.00.
Week in review: Optimism on US-China trade deal leads to improved sentiment
Wall Street stocks rose on Friday, marking the second week of gains, boosted by strong economic data and signs of easing U.S.-China trade tensions. The U.S. added 177,000 jobs in April, beating expectations, while unemployment stayed at 4.2%. This helped ease worries about an economic slowdown, despite a recent report showing the first contraction in GDP in three years, driven by a surge in imports due to tariffs.
Beijing announced on Friday that it is considering Washington's proposal for talks about President Donald Trump's 145% tariffs on Chinese imports. The ongoing tariff battle between the two biggest economies has unsettled investors, as neither side wants to appear to back down in a trade war that has shaken global markets.
Despite the improving sentiment investors pulled money from U.S. funds for the third week in a row. European equity funds benefited the most, with investors adding $14.64 billion, the largest weekly inflow since mid-March 2024, according to LSEG Lipper data. Asian funds received $6.68 billion in investments.
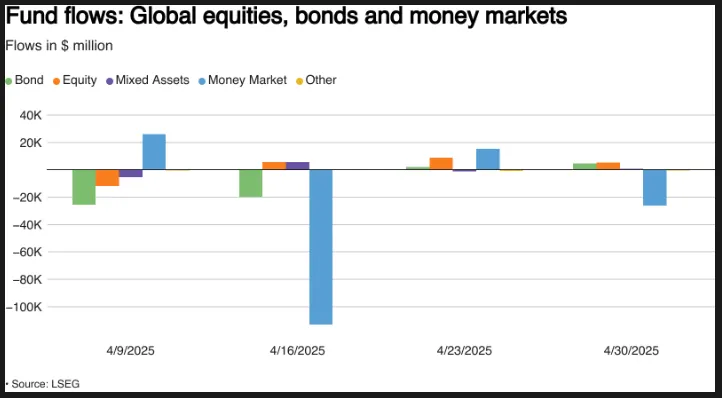
Source: LSEG
Improving sentiment did however affect Gold and precious metals commodity funds which registered their first weekly net sales in 12 weeks, with investors pulling out a marginal $4.4 million.
Gold has surrendered its recent bullish run and is on course for a second successive week of losses, trading around the $3230/oz market at the time of writing. Is this a sign that the worst may be behind us on the tariff front?
WTI Oil prices dropped below $60 a barrel this week after Reuters reported that Saudi officials told allies and analysts they were fine with keeping oil prices low for a longer period. Last month, sources told Reuters that some group members were urging another fast rate hike for June.
Eight OPEC+ countries will meet on Saturday to decide whether to increase oil production faster for June or stick to the smaller hike they had planned, two sources told Reuters on Friday. The meeting was initially set for Monday, but it’s unclear why it was moved earlier. Any developments from the meeting could see Oil prices face a volatile start next week.
On the FX front, the US dollar dropped on Friday but regained some ground against the euro and yen after data showed the U.S. added more jobs than expected last month, indicating a steady job market. Earlier in the week, the dollar had risen against both currencies.
The US Dollar recovery continues to be driven by tariff developments at this stage with Federal Reserve interest rate expectations taking a backfoot.
After the jobs data, the U.S. rate futures market lowered its expectations for a June rate cut by the Fed, reducing the probability to 35.6% from about 58% on Thursday. Overall, the market now predicts rate cuts totaling 80 basis points (bps), or roughly three 25-bps cuts, compared to the 100 bps of cuts expected earlier this week.
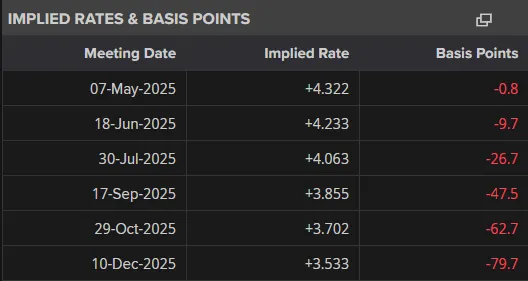
Source: LSEG
The week ahead: Fed on deck as trade deals grow nearer. Will there be any twists in the tale ahead?
The upcoming week will be a bit quieter but still busy nonetheless. Asia Pacific markets get a slight break while the market will shift focus to high impact data from the US and UK in particular with tariff developments still being monitored closely.
Asia Pacific Markets
China's April trade data, due Friday, will reveal the impact of rising tariffs on its trade. US-bound exports from China likely saw a sharp drop, potentially causing a double-digit decline in both exports and imports compared to last year. Since 14-15% of China's exports go to the US, a lot of this trade might have slowed drastically in April. Import data shows a similar trend, with signs of a decline evident in purchasing managers' index reports.
While some trade between the US and China may have shifted to other regions, the shift isn’t happening smoothly and won’t fully offset the losses. On Wednesday, China will also release foreign reserves data, which investors will analyze for signs of significant changes, like the possible selling of US Treasuries.
Europe + UK + US
The Federal Reserve is expected to keep interest rates unchanged next week despite pressure from the President. Fed Chair Jay Powell emphasized the need to maintain price stability and prevent temporary price hikes from becoming long-term inflation. Fed Governor Chris Waller also ruled out rate cuts in May or June, noting the pause on tariffs likely won't influence data until after July.
Meanwhile, the ISM Services Index, out Monday, risks dipping into contraction, signaling a cooling economy and potential recession.
Europe gets a bit of a data breather this week with Retail Sales the only high impact data release. Focus will shift to UK data next week.
The Bank of England is likely to cut rates by 25 basis points on Thursday but isn’t expected to adopt a significantly more cautious stance. Tariffs are less of an issue compared to other parts of Europe, but services inflation remains persistent. This could shift by summer, but for now, I expect the BoE to stick to its message that any future cuts will be "gradual."
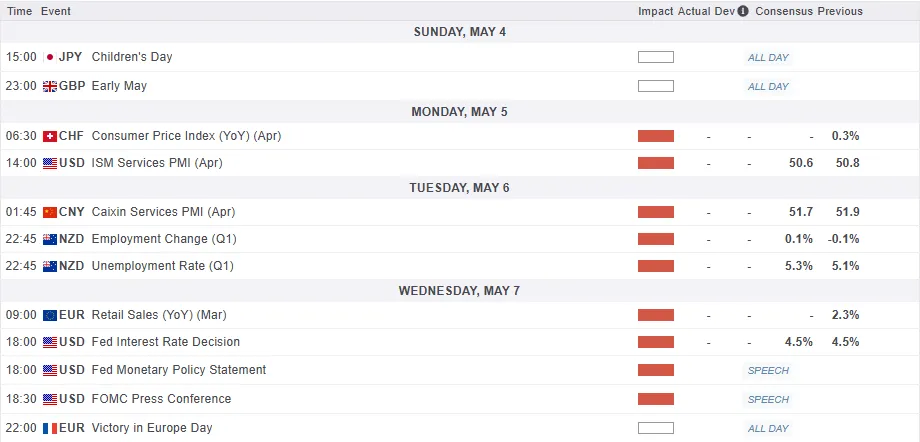
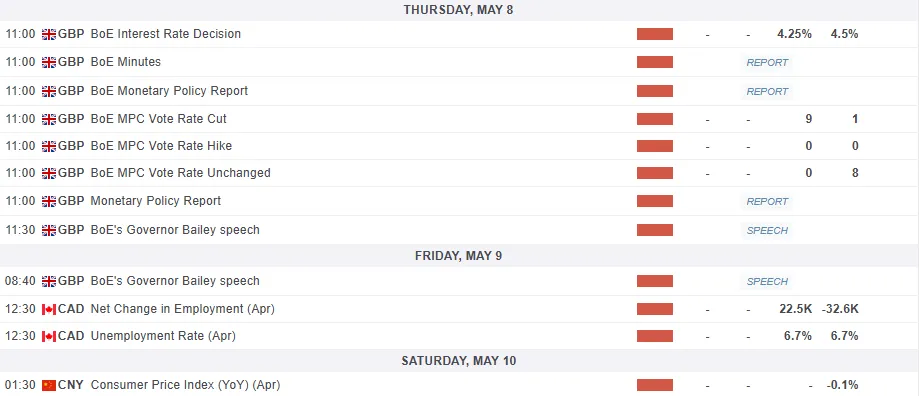
For all market-moving economic releases and events, see the MarketPulse Economic Calendar. (click to enlarge)
Chart of the Week - US Dollar Index (DXY)
This week's focus remains on the US Dollar Index.
The index is on course to close above the psychological 100.00 level for the first in four weeks in what could be a crucial close from a technical perspective.
The index continues to gain on the hopes that tariffs may not be as bad as first feared.
The weekly chart has also printed a morningstar candlestick pattern which is a strong reversal signal and does hint at further upside.
If sentiment continues to improve, immediate resistance rests at 100.617 before 101.180 comes into focus. Beyond that markets will focus on the 102.16 handle and then potentially the descending trendline may come into focus.
If a pullback is to develop then immediate support may be found at 99.57 before the 99.00 handle comes into focus. A break of these levels will ring the recent lows into focus around the 97.90 handle.
US Dollar Index (DXY) Daily Chart - May 2, 2025
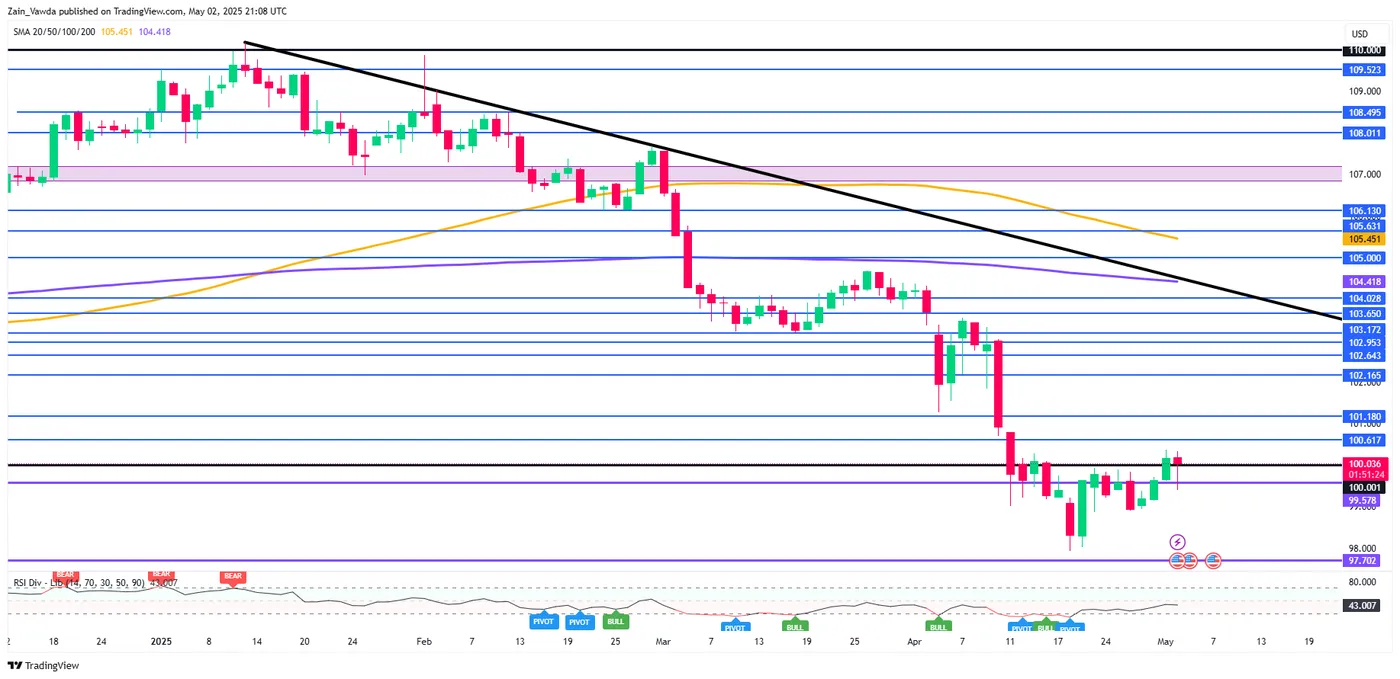
Source: TradingView.Com (click to enlarge)
The Weekly Bottom Line: Carney’s First 100 Days
Canadian Highlights
- The 2025 Federal Election outcome has potential to shape Canada’s economic path. Carney’s agenda both ambitious and expansive, decisively sidelining fiscal restraint.
- The latest GDP data reflects weather-related softness, with a decline in February and only modest growth in March’s flash estimate. We expect Q1 growth to come in close to our forecast, followed by a trade-related contraction in Q2.
- Having avoided direct attention from Washington in the days before the election, Canada remains subject to tariffs, so rebuilding a mutual understanding on trade remains a top priority for Carney’s first 100 days.
U.S. Highlights
- The U.S. administration is scheduled to change another tariff rule tonight, ending the so-called de minimis provision which has exempted small packages from most duties in the past.
- U.S. GDP contracted in the first quarter of 2025, ending a long streak of expansion. The contraction was mostly owed to a surge in imports, as consumers and businesses tried to get ahead of tariffs.
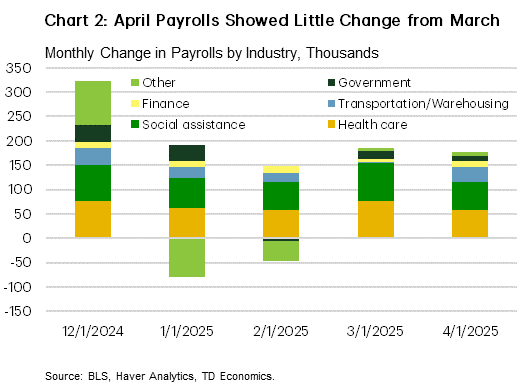
- The U.S. payrolls report for April came in stronger than expected, revealing little impact to the job market from tariffs so far.
Canada – Carney’s First 100 Days
Few events truly have the potential to shape a country’s economic path, and 2025 Federal Election provides a major opportunity to do just that. True to form, Canadian markets met the results with characteristic composure. The Canadian dollar dipped slightly right after the vote, but quickly recovered. Equity and bond markets were more attuned to global developments, with equities edging higher and yields slipping modestly on the week.
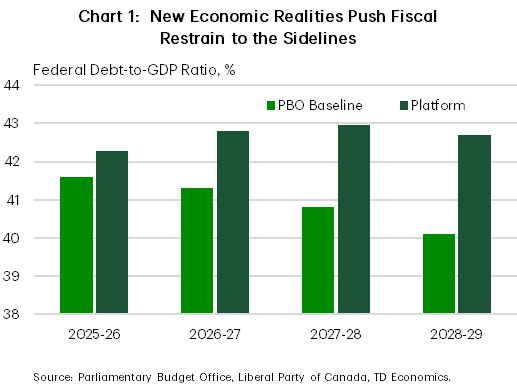
While there’s nothing inherently meaningful about a 100-day milestone, it remains a popular benchmark and this government’s first 100 days will be scrutinized intensely. Having won a fourth consecutive mandate, the Liberal party has no time to celebrate. Its agenda is both ambitious and expansive, spanning, infrastructure, defence, housing and more. The total price tag stands at C$130 billion in new spending, decisively sidelining fiscal restraint. The plan pushes the federal debt-to-GDP ratio from 42% to roughly 43% over the next three years, with a modest decline thereafter (Chart 1).
While many of these initiatives align with the proposals from rival parties and may be relatively easy to negotiate, the timing of their roll-out is hard to pin down. Once the Cabinet is formed, the government will recall Parliament and present a Speech from the Throne – it’s formal confidence test – before introducing the budget. That puts Carney’s government on a tight schedule, with the House set to adjourn for the summer season from June 20th to September 8th, unless recalled. Accordingly, the updated budget needs to focus on the most urgent economic challenges. Our forecast incorporates about 1% of GDP in additional outlays aimed at supporting the economy through the ongoing trade disruptions.
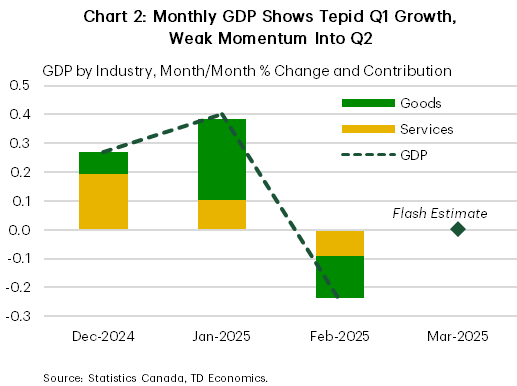
The latest GDP data highlights some softness. February’s GDP by industry declined 0.2%, while the flash estimate for March shows a modest 0.1% gain (Chart 2). But so far, this weakness was mostly weather, not trade-related. In fact, manufacturing posted a solid increased, with businesses likely advancing shipments ahead of tariff-related cost increases.
Meanwhile, the housing-related industries are proving to be the early warning signal of the impact of trade measures and uncertainty. Construction activity fell for the first time in four months and real estate, while rental and leasing activities posted the largest decline since April 2022. This reversal comes just as the sector had regained some modest traction, buoyed by the falling cost of borrowing. The GTA condo market, in particular, saw the sharpest slowdown. Accounting for this slowdown on the industrial level, we expect Q1 growth to land in line with our forecast of around 1.5%.
Still the strain of trade uncertainty will be increasingly felt in the Canadian economy’s bones and we expect Q2 to reflect that with a contraction. Canada remains subject to tariffs on steel & aluminum, all non-USMCA-compliant imports and non-U.S. built cars and trucks. A formal renegotiation of USMCA appears unlikely in the immediate term, with the White House signalling a preference to first engage with Asian countries. This could give Carney space to consult across political and business lines. Still, rebuilding a mutual understanding on trade with Washington remains a top priority – one that would have to return to the table within the first 100 days.
U.S. – Another Week, Another New Tariff
The U.S. economy has been showing resilience to tariffs so far, but will be increasingly pressure tested going forward under the weight of multiple tracks of tariffs. Tariffs, especially the very high 145 percent levy on imports from China, are about to start hitting even more goods; tonight is the deadline for the so-called de minimis provision to end. Under de minimis rules, small packages of $800 or less imported from China to the U.S. are exempt from tariffs. This provision has meant that e-commerce retailers that sell clothing and other goods online directly to U.S. consumers were able to do so without being affected by tariffs. Over 1.25 billion shipments entered the U.S. in 2024 under the de minimis provision, and its end will mean price increases for a wide swath of consumers. Some of the most affected companies, such as Temu and Shein, have already indicated some changes to their operations because of the change to de minimis rules; these changes could include price increases for customers, shifting some of the sourcing for U.S. sales away from China, and as a consequence possibly seeing their U.S. business shrink. These measures are set to occur as progress on removing tariffs remains elusive, though we did see indications of a willingness to negotiate from both China and the EU late this week.
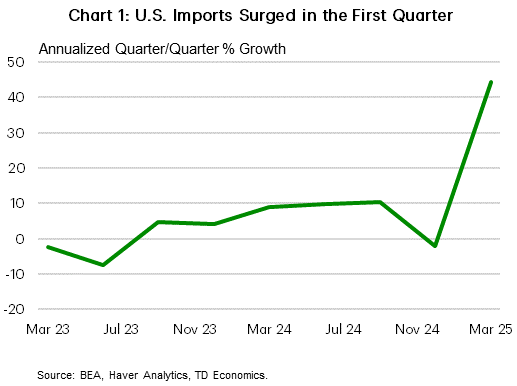
We long expected that roll-out of U.S. tariffs would create distortions in the data, notably the natural response of many U.S. businesses and consumers to get ahead of the higher levies. This week’s advance estimate of U.S. GDP growth for the first quarter of 2025 confirmed our expectation – U.S. GDP shrank in the quarter, weighed down heavily by a massive surge in imports ahead of tariffs being put in place, much of the import surge seemingly for companies to stockpile inventories. Inflation was also up for the quarter, but March showed some slowing from earlier in the year. Recent inflation readings are still above the Federal Reserve’s target, however, so we expect this mild softening to be received with great caution.
The vast majority of tariffs were put in place after April 2, so all of this data is just a warm-up, so to speak. Most of this 1st-quarter data is warped by expectations of tariffs in the future, rather than being an indication of underlying trends. The real question of how economic activity is holding up is going to come through the data after April 2. This morning’s jobs report for April, the first such data, was surprisingly resilient, and the unemployment rate remained unchanged at a fairly low 4.2 percent. We also saw April data for vehicle sales this morning come in strong, in part because dealers still have inventory that predates the auto tariffs. But that is still two points of hard data showing that activity did not take a big hit in April.
This week leaves us back in wait-and-see mode, as we have still seen very little data since tariffs were put in place. The economy has to pass through another deadline for tariffs to kick in tonight, and those will also take some time to filter through the economy. The Federal Reserve is set to meet next week, and we expect the central bank is still searching for more clarity on the outlook before contemplating rate cuts. Futures markets had been holding out hope for a June cut, but after today’s jobs report, odds have been dialed back to around 40%. However, given the expectation that a weaker economy will ultimately trump higher inflation as the Fed’s number one concern, investors are still anticipating between 3-4 cuts by year-end.
Weekly Economic & Financial Commentary: Steady Hiring, Wilting Confidence and a Yawning Trade Gap
Summary
United States: Steady Hiring, Wilting Confidence and a Yawning Trade Gap
- There was plenty of employment data to digest this week, and broadly speaking, there is not yet hard data to support the notion that the labor market is rolling over, though it's clearly losing momentum. Meanwhile, a pre-tariff spending spree partly explains why March consumer spending was also better than expected.
- Next week: ISM Services (Mon.), Trade Balance (Tue.), FOMC (Wed.)
International: Economics Is Like a Box of Chocolates
- Sometimes economics is like a box of chocolates, and this week's international news is very much a mixed bag. The Bank of Japan held rates steady but highlighted trade concerns, and we have pushed back our expected rate hike to the October meeting. In Canada, PM Carney's Liberal Party won this week's election but fell short of an outright majority. On the data front, China's April PMIs surprised to the downside, while in the Eurozone, GDP growth and inflation data were slightly firmer than expected.
- Next week: Brazil Selic Rate (Wed.), Riksbank Policy Rate (Thu.), Bank of England Policy Rate (Thu.)
Credit Market Insights: Vibe Check: How Resilient Is the U.S. Financial System?
- The Federal Reserve Board recently published its biannual Financial Stability Report, which provides an assessment of the U.S. financial system. The report—which reflects market conditions and data as of April 11—reviews vulnerabilities and near-term risks related to valuation pressures, borrowing by businesses and households, financial-sector leverage and funding risks.
Topic of the Week: Automakers Receive Some Tariff Relief
- This week, the White House issued an update to the administration’s 25% tariff policy on foreign-made auto imports, stating that the new 25% auto tariffs would not stack on top of other existing tariffs. Beyond the relief to domestic-based purchasers of U.S.-made autos, this provides some additional relief to foreign purchasers of these autos as well.
Trade and Employment Data to Show How Canadian Economy Reacted to Tariffs
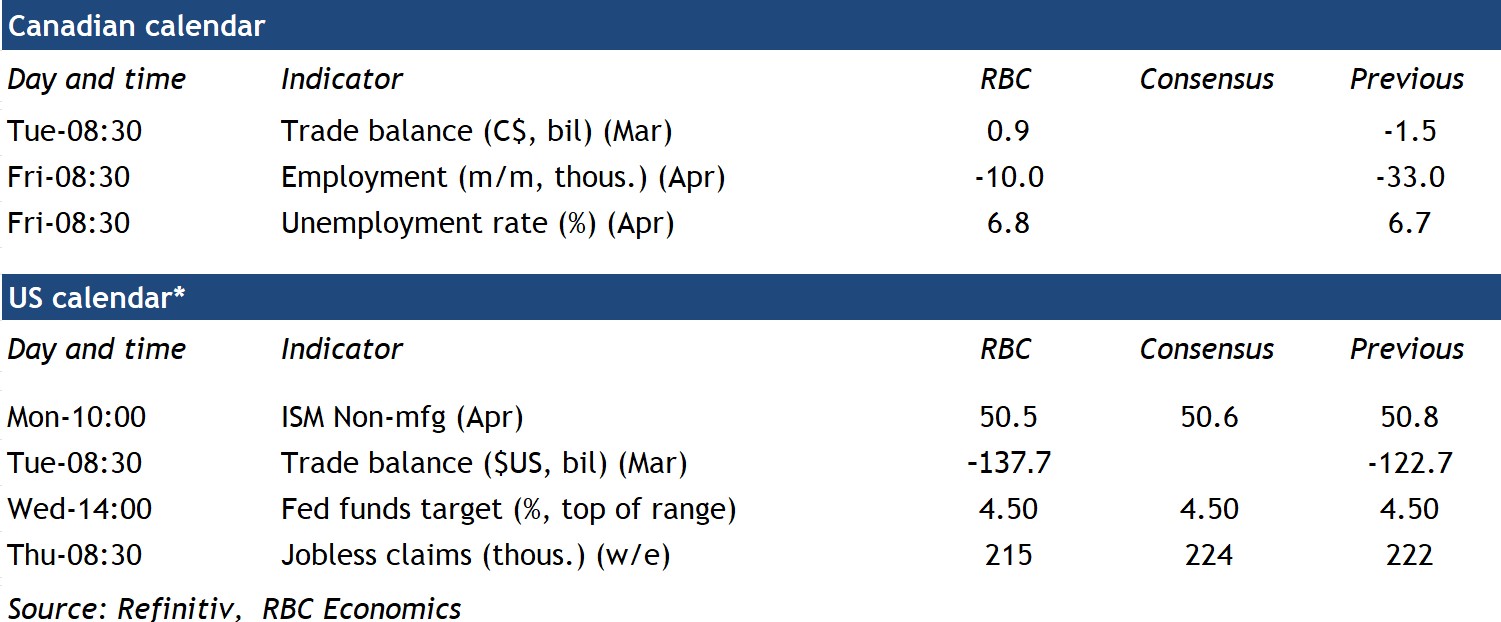
We expect Canada’s trade balance swung back to a surplus in March and the labour market shed more jobs in April as early signs of how the Canadian economy evolved with the onset of U.S. tariffs.
To recap, blanket 25% tariffs on virtually all U.S. imports from Canada were briefly imposed on March 4 before being rolled back for trade compliant with the CUSMA/USMCA free trade deal days later. Still, tariff fears drove a surge in U.S. imports as seen in the advance estimate of U.S. trade data for March. We expect those U.S. imports came partially from Canada as Canadian rail traffic bounced back in March after falling in February, but from other regions as well. China reported a rise in exports to the U.S. in March.
We expect exports from Canada rose in March, enough to flip the trade balance back into a surplus from a deficit in February. We’re also watching the share of trade that’s now categorized as compliant with USMCA. Only 38% of U.S. imports from Canada reportedly used the CUSMA/USMCA in 2024, but we expect that share will rise relatively quickly as traders rush to satisfy the rules of origin requirements under CUSMA to avoid paying substantial tariffs.
Outside of trade, tariffs also appear to be choking off early signs of improvement in the Canadian labour market with employment falling by 33,000 in March, while the participation rate dropped for a second consecutive month and unemployment rate ticked up to 6.7%. In April, we expect those trends persisted and look for another 10,000 decline in jobs, alongside a 6.8% unemployment rate.
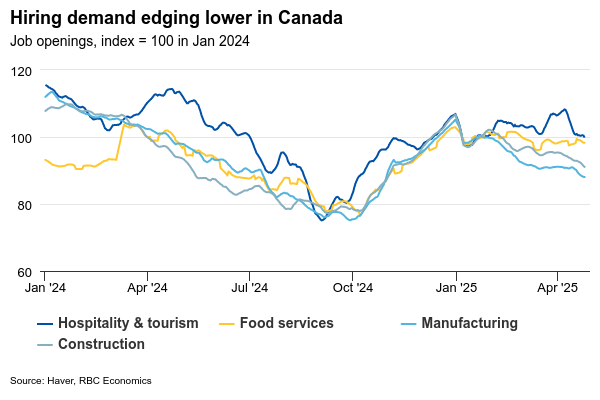
The bottom hasn’t fallen out yet in the labour market – the unemployment rate remains below the 6.9% peak late last year. But, softening hiring demand shown by a persistent decline in the number of job openings suggests more weakness is likely ahead. We expect the unemployment rate will continue to edge higher into the second half of this year.
Week ahead data watch
Weekly Focus – Powell in the Spotlight
Fed governor Jerome Powell will be in the spotlight again the coming week with the upcoming FOCM meeting on Wednesday where rates are widely expected to stay on hold (market prices only 7% probability of a rate cut). That is likely to draw the ire of US President Donald Trump who repeated this week that "he should reduce interest rates". Importantly, Trump earlier stated he will not fire Powell, which was crucial for restoring calm in US bond markets where bond yields have declined 20bp lower since then. We agree with markets that Fed's policy rate will be on hold on Wednesday but look for a cut in June.
The US news flow was skewed to the downside when it came to activity this week, although not yet pointing to a severe slowdown. GDP for Q1 showed a negative print of -0.3% q/q annualised, but mainly due to a sharp increase in imports related to front loading ahead of tariffs. Domestic demand growth was still healthy. A string of labour market data (ADP employment, job openings and jobs plentiful index) showed softening (non-farm payrolls released after deadline) and consumer confidence slipped further. On a positive note, consumer spending was robust in March, partly lifted by some front loading ahead of tariffs, and the ISM manufacturing surprised to the upside. We do expect to see a weakening US economy in coming months, with payback from frontloading on consumption and rising pain from the de facto trade embargo between China and the US.
There is still no sign of US and China initiating trade talks as both sides are waiting for the other to take the first step. We expect this to happen quite soon, though, as Trump could otherwise be facing empty shelves and steep price increases before long and China also faces growing pain on exporters. We look for talks to start within the next 4-6 weeks and expect that tariffs will be lowered to around 60% at an early stage to get trade rolling again. The US says it is close to making deals with Asian countries such as South Korea, Japan and India. The first deals will be key to watch as they will give a sense of whether tariff rates will stay at the current 10% for most countries or be lifted to say 15-20%. Trump will need tariffs at a certain level to be able to fund tax cuts with tariff revenue.
In the euro area inflation data was a bit to the high side with a rise in core inflation from 2.4% to 2.7% y/y (consensus 2.5% y/y). It was lifted by higher service inflation related to Easter, though, so it should not be a too big concern. Looking ahead ECB's wage tracker points to a clear decline in wage growth and we also look for falling commodity prices and more Chinese overcapacity to drive goods inflation lower leaving room for more ECB cuts.
Stock markets saw further upside this week driven by positive earnings reports from big US tech companies and as the trade war is in de-escalation mode, at least for now. S&P500 has pretty much erased all losses since 'Liberation Day' on 2 April and the USD has recouped some of its losses. We still expect a bumpy road ahead, though, as the pain from the trade war shows up in the data.
Apart from the FOMC meeting focus over the coming week will be on trade talks and the negotiations on the US budget bill. It is a very light calendar on the data side where we get Euro Sentix, German IP and factory orders and Japan labour earnings.
Bank of England Preview – A Cautious, But Dovish BoE
- We expect the Bank of England (BoE) to cut the Bank Rate to 4.25% on Thursday 8 May in line with consensus and market pricing.
- Inflation has surprised to the downside over the past months and combined with elevated uncertainty and downside risks to growth from the trade war, we expect the MPC to deliver a slightly dovish twist.
- We expect EUR/GBP to end the meeting higher on dovish commentary. We stay negative on GBP.
We expect the Bank of England to cut the Bank Rate to 4.25% on Thursday 8 May in line with consensus and market pricing. We expect the vote split to be 8-1 with the majority voting for a 25bp cut and dove Dhingra voting for a larger 50bp cut. Note, this meeting will include updated projections and a press conference following the release of the statement.
We expect the BoE to deliver a dovish twist to its guidance on Thursday signalling that the bar for consecutive rate cuts has been lowered. We think they will stick to the formal guidance repeating that a "gradual and careful approach to removing monetary policy restraint remains appropriate". Removing the notion of a "gradual" cutting cycle would be a strong signal of the MPC considering consecutive cuts. Inflation has surprised to the downside and with energy prices moving lower since the February meeting, the inflation forecast will likely be revised downwards although the conditional market implied rate path is significantly lower than in the February forecast. Wage growth has likewise been slightly lower than expected with private sector regular wage growth coming in at 5.9% (vs Boe forecast of 6.2% for Q1). Growth has been slightly better than expected and retail sales point to improvement in private consumption but the impact from tariffs poses a downward risk. We think the former will lift the 2025 forecast and the latter will be reflected in a downward revision of the GDP forecast in 2026. PMIs have shown tentative signs of a more stagflationary backdrop with price pressures accelerating and growth being more muted.
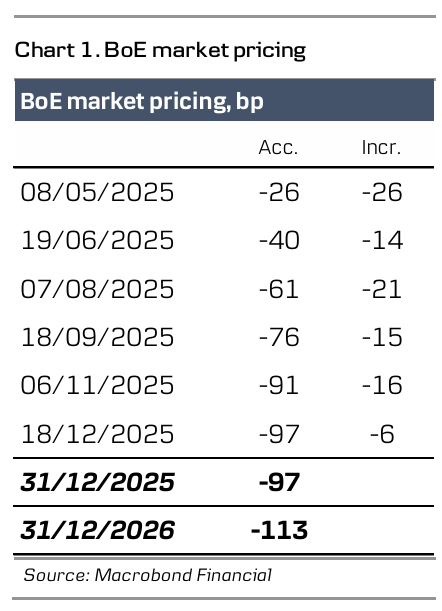
BoE call. We expect the BoE to stick to quarterly cuts, leaving the Bank Rate at 3.75% by YE 2025, which is a higher level than markets are expecting. Markets are pricing around 97bp for the remainder of the year. However, we highlight that the risk is skewed towards a swifter cutting cycle in 2025 given the downside risks to growth from the trade war.
Market reaction. We expect markets to react by sending UK yields lower and EUR/GBP higher on the dovish twist to the BoE's communication. More broadly, while we see domestic factors as GBP positives, we think the global investment environment will be in the driver's seat for EUR/GBP in the coming months. An investment environment characterised by elevated uncertainty, widening credit spreads and a positive correlation to a USD negative environment, in our view, favours a weaker GBP. We therefore expect EUR/GBP to move higher towards 0.88 on a 6-12-month horizon.