Sample Category Title
US NFP grows 177k in April, wage gains losing momentum
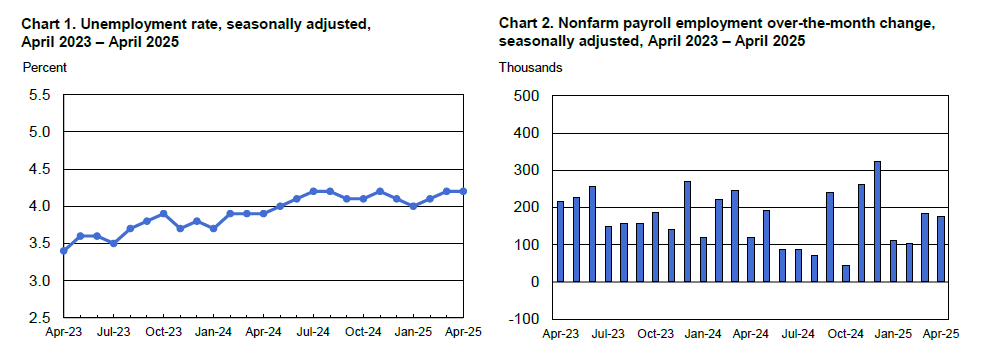
The US labor market delivered another month of solid job creation in April, with non-farm payrolls rising by 177k, beating forecast of 130k. However, the initial blowout March figure was revised down from 228k to 185k, tempering some of the headline strength.
Still, both readings came in above the 12-month average monthly gain of 152k, signaling continued resilience.
Unemployment rate held steady at 4.2%, in line with expectations, while labor force participation ticked up slightly to 62.6%.
Yet, wage pressures appear to be softening. Average hourly earnings rose just 0.2% mom, below the 0.3% mom forecast, bringing the year-over-year growth rate to 3.8%.
Dollar Index (DXY) Forming Elliott Wave Zig Zag Pattern
Hello fellow traders. In this technical article we’re going to look at the Elliott Wave charts of Dollar Index DXY published in members area of the website. As our members know, DXY is forming a correction against the 103.56 peak. In the following text, we’ll explain the Elliott Wave analysis and outline the target areas.
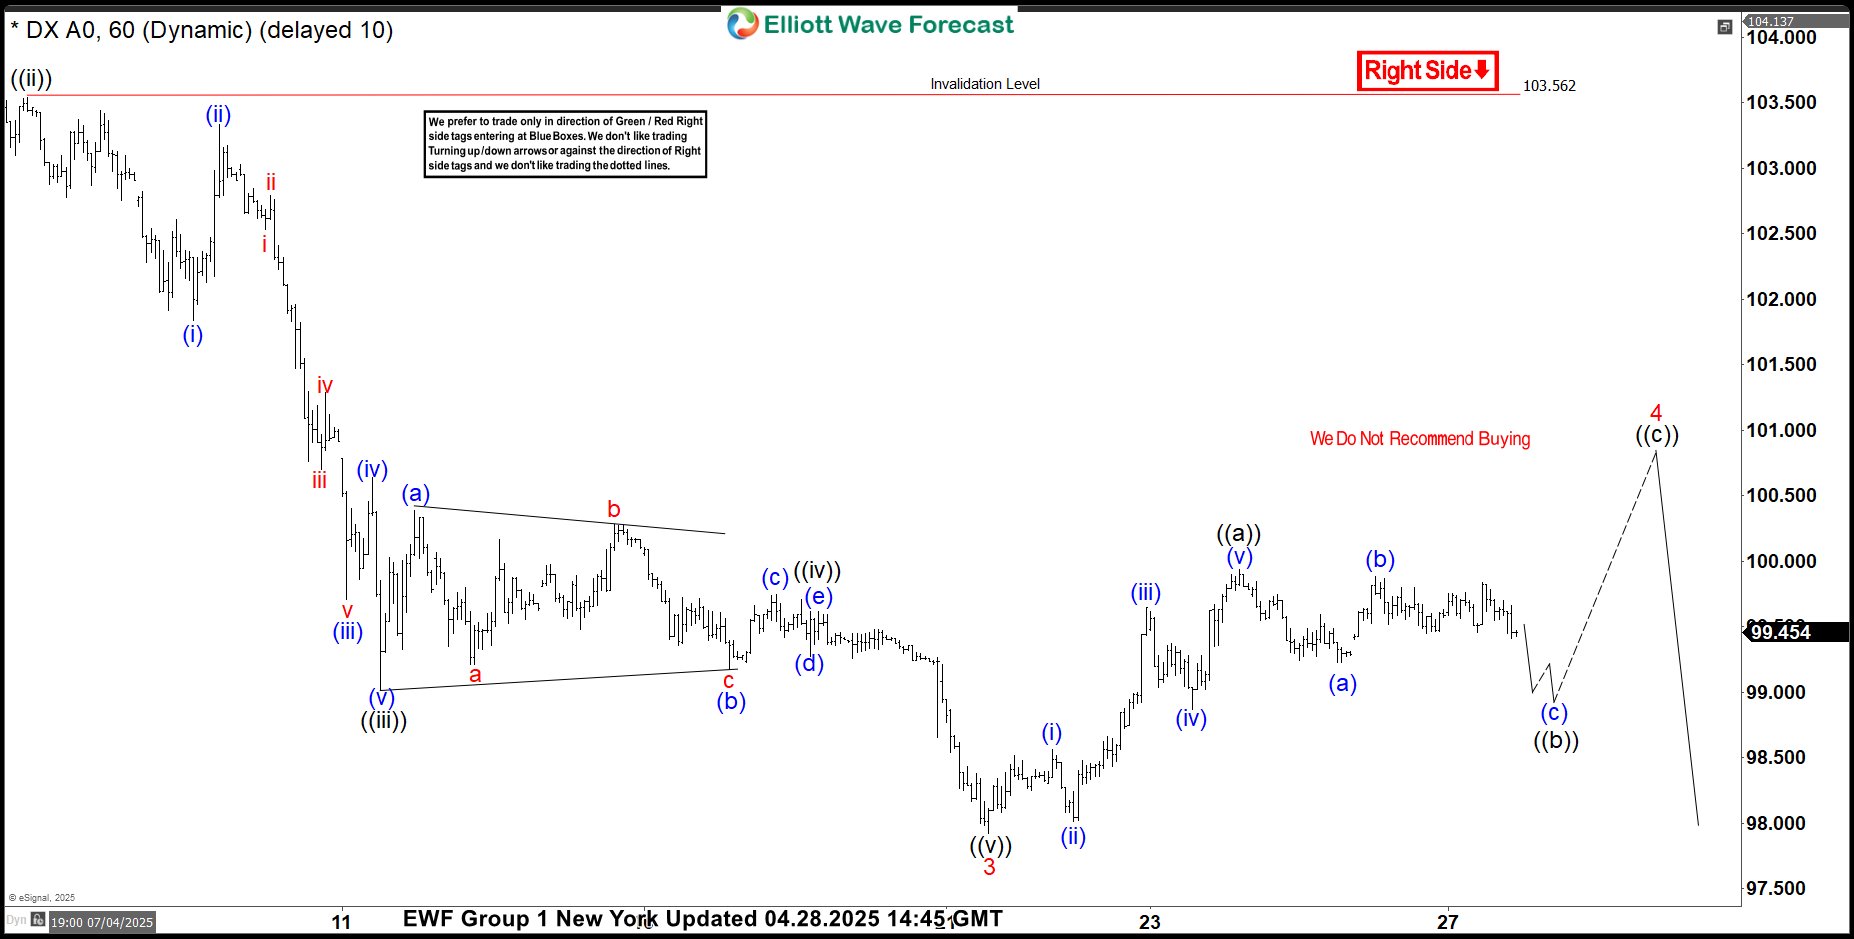
DXY Elliott Wave 1 Hour Chart 04.28.2025
The current view suggests that the US Dollar Index is correcting the cycle from the 103.56 peak.We count five waves in the rally from the low, indicating that we have completed only the first leg of a potential correction, labeled as wave ((a)) in black.
The market is currently forming wave ((b)), which could reach the 99.18–98.75 area.In this zone, we expect buyers to appear for a potential final push higher in wave ((c)), as proposed on the chart.
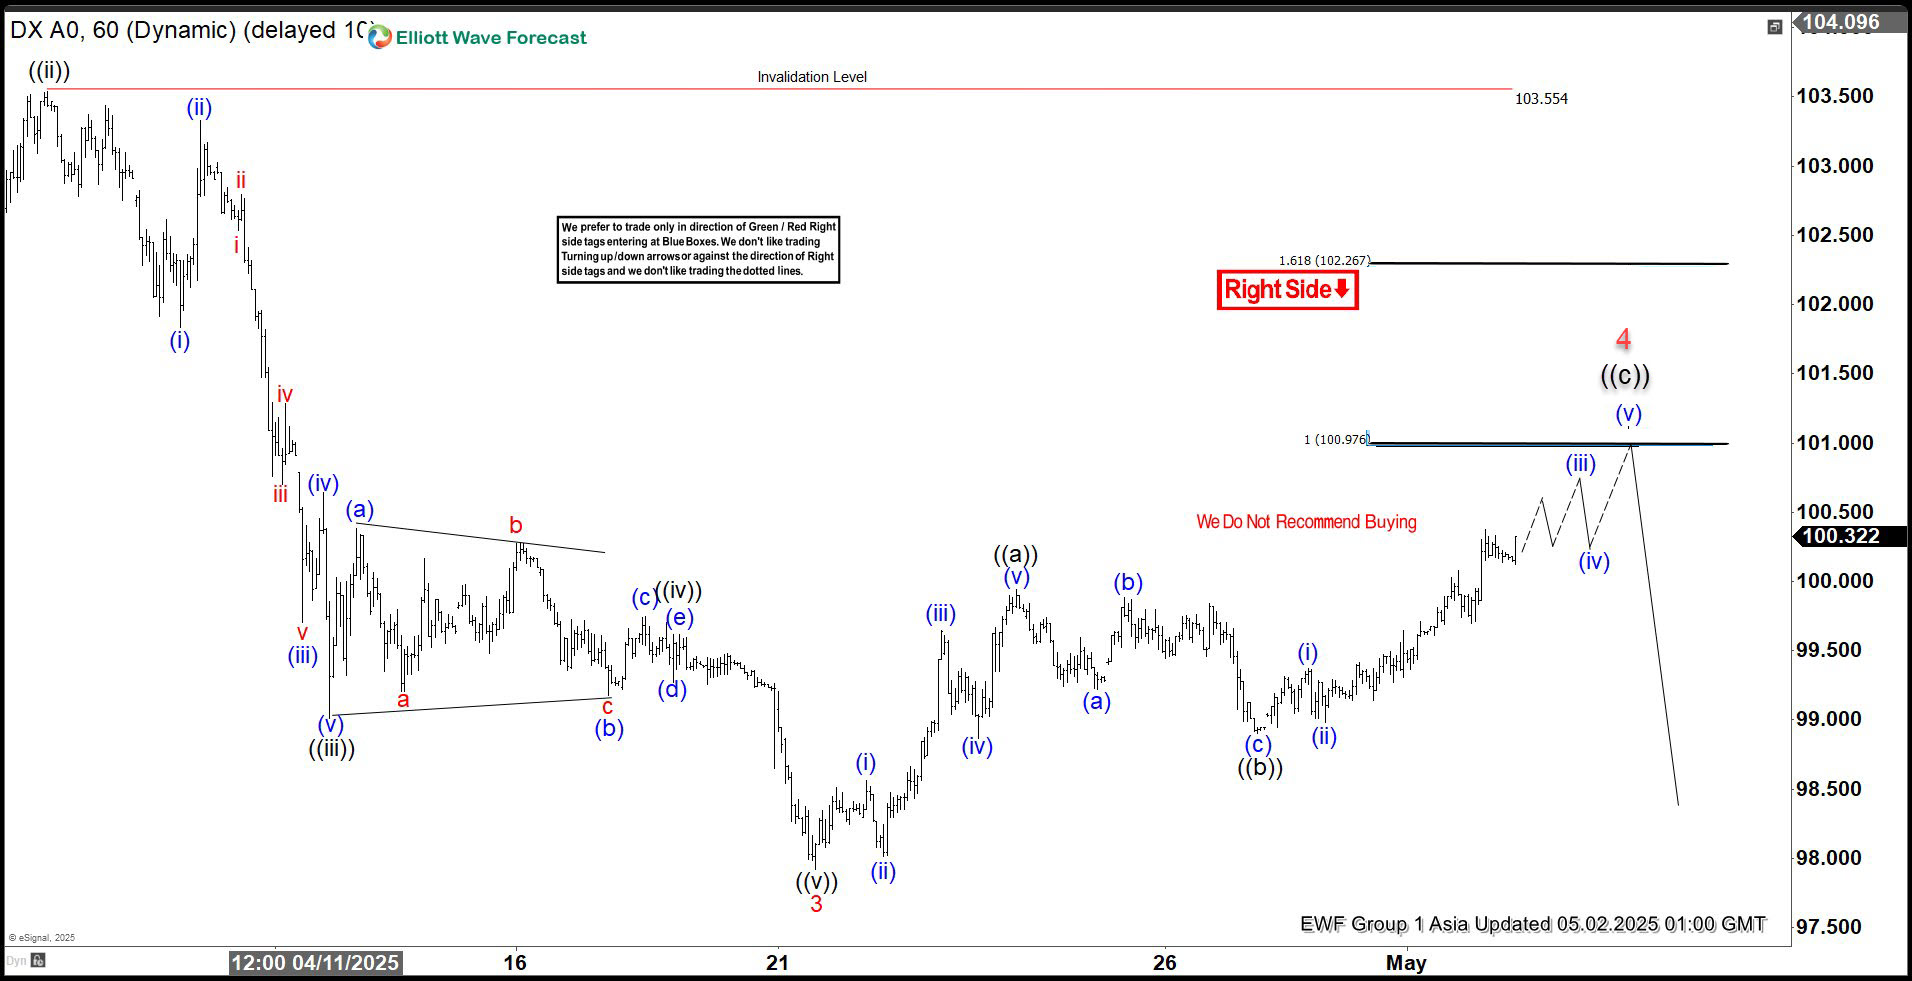
DXY Elliott Wave 1 Hour Chart 04.28.2025
Dollar found buyers at 99.18–98.75 area as expected. It made decent rally that broke the previous peak ((a)) , confirming that the next leg up is in progress – ((c)). Dollar can see 100.97-102.26 area before sellers appear again.
Australian Dollar Rises after PPI Accelerates, US Nonfarm Payrolls Next
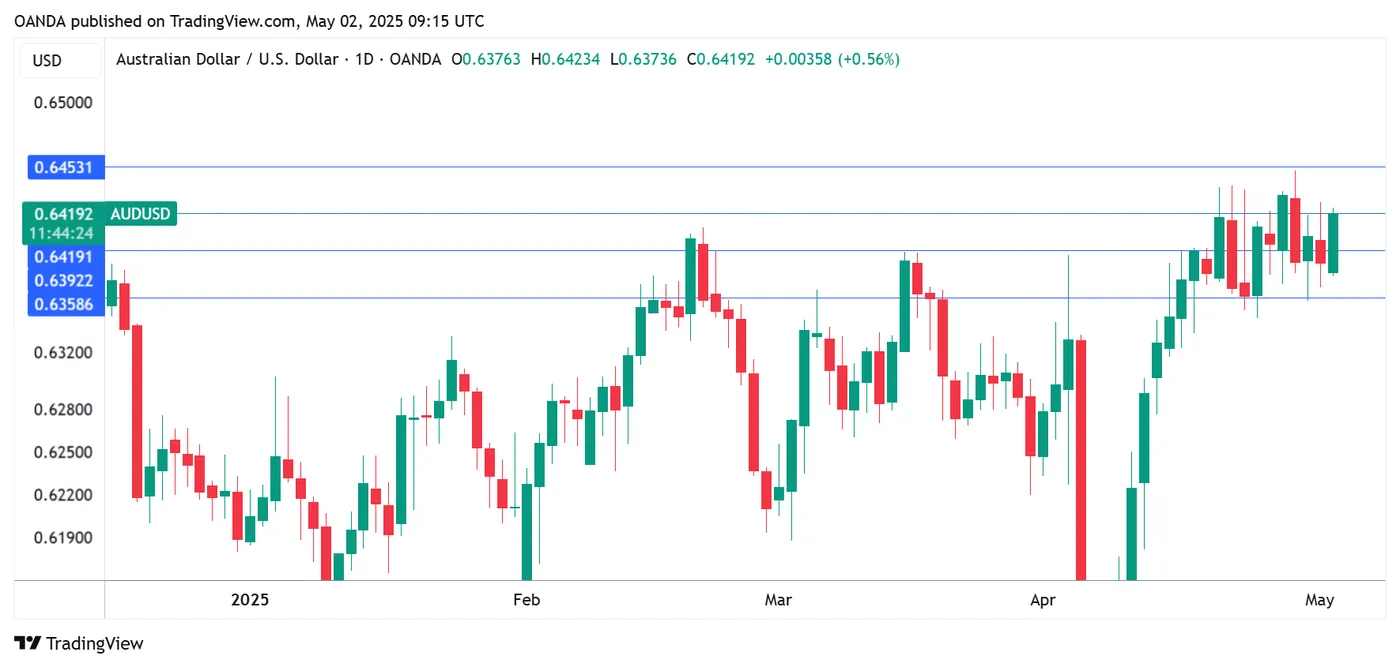
The Australian dollar has posted considerable gains on Friday. In the European session, AUD/USD is trading at 0.6417, up 0.55% on the day.
Australia's PPI rises but retail sales dip
Australia's Producer Price Index rose 0.9% in the first quarter, up from 0.8% in Q4 and edging above the market estimate of 0.8%. Annually, PPI remained at 3.7%, still the lowest level in three years.
Retail sales for March was a disappointment, with a gain of 0.3%. This followed a revised 0.8% in February and missed the market estimate of 0.4%. The weak report can partly be attributed to Cyclone Alfred, which caused damage of close to one billion dollars.
Retail sales were almost flat in the first quarter, reflecting consumer anxiety over the economy, as US tariffs have escalated global trade tensions.
Australia's core inflation rate dipped to 2.9% in the first quarter, the first time in three years that core CPI has been within the RBA's 1-3% target band. This is a significant milestone in the recovery and the fight against inflation.
The inflation report is good news for consumers and the markets have priced in a quarter-point cut from the Reserve Bank of Australia at the May 20 meeting. The National Australia Bank is more dovish and is projecting a jumbo half-point cut.
US nonfarm payrolls expected to fall sharply
With US inflation largely under control, the US labor market is under close scrutiny. The Federal Reserve could deliver a rate cut as early as June if employment numbers deteriorate. The May nonfarm payrolls report is expected to come in at just 130 thousand, following a surprisingly strong April release of 228 thousand. A surprise reading above or below the forecast could have a strong impact on the US dollar in the North American session.
Investors will also be monitoring wage growth, which is expected to inch higher to 3.9% y/y from 3.8%.
AUD/USD Technical
- AUD/USD has pushed above resistance at 0.6392 and is testing resistance at 0.6419. Above, there is resistance at 0.6453
- 0.6358 and 0.6331 are the next support levels
AUD/USD in a Range: Is a Bullish Breakout Next?
- AUD/USD extends sideways move within 0.6340-0.6448 area.
- Key resistance levels in focus as bullish breakout still likely.
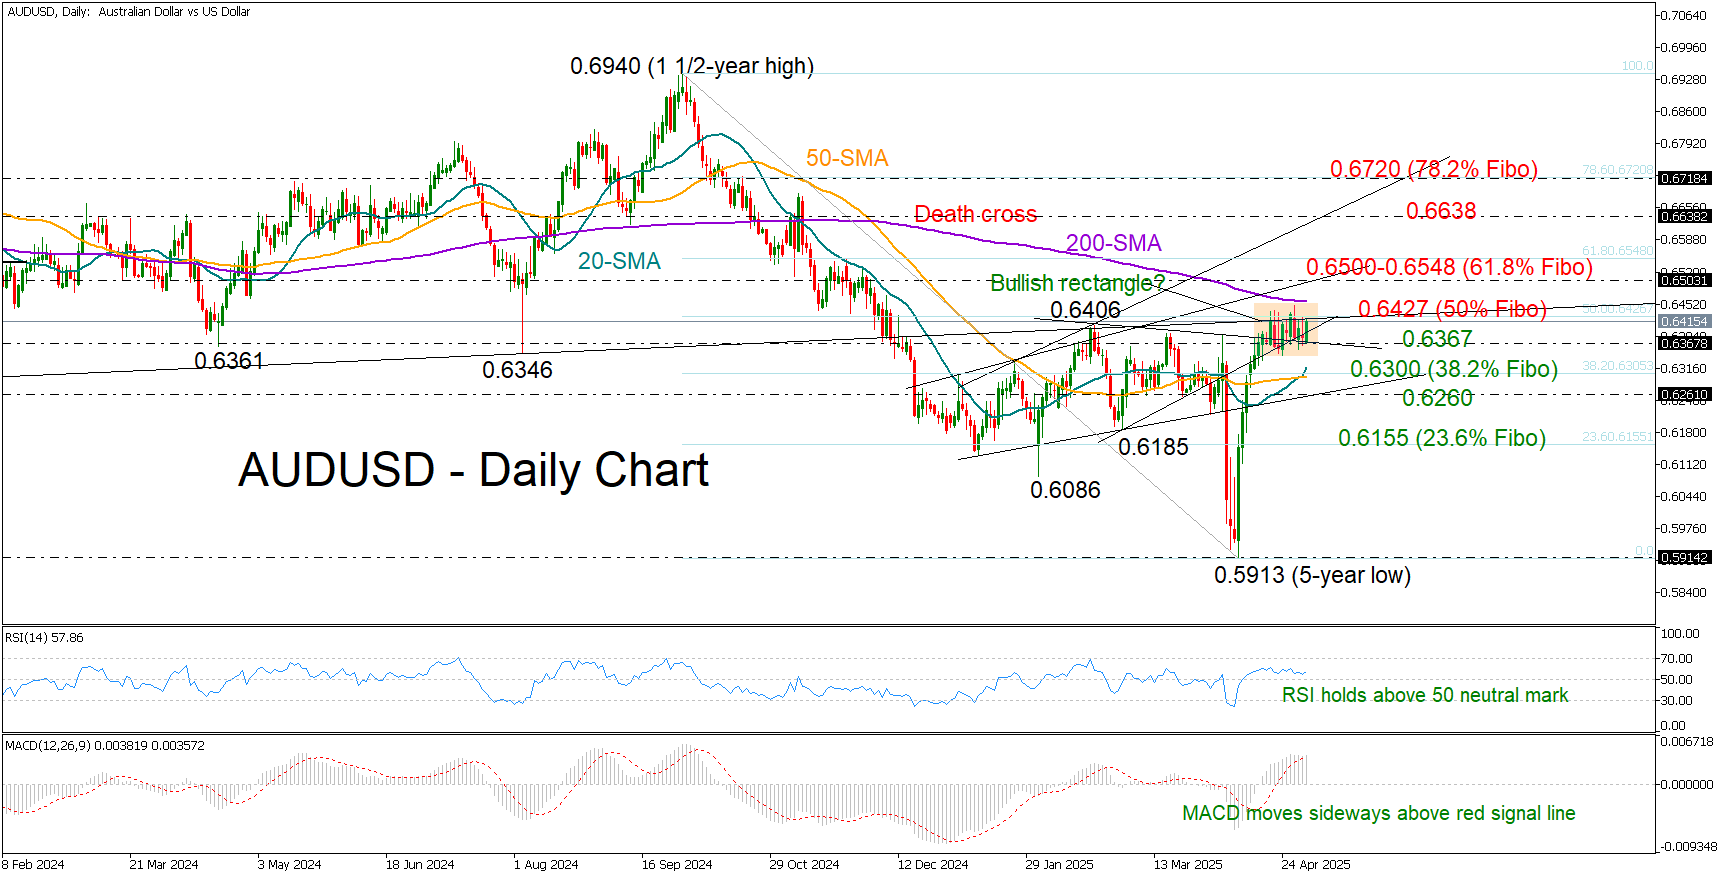
AUDUSD has been in a tight range for almost two weeks, consolidating its rapid rally from a five-year low below its 200-day simple moving average (SMA) and within the 0.6340-0.6448 area.
The 50% Fibonacci retracement of the September-April downtrend at 0.6427, along with the support-turned-resistance trendline from October 2023, has also posed a challenge for the bulls. However, with the RSI and the MACD fluctuating in the bullish area despite their sideways trajectory, hopes for an upward breakout remain alive ahead of the all-important US nonfarm payrolls. Additionally, the short-term sideways movement could be a bullish rectangle pattern, which typically resolves to the upside.
A move above the 200-day SMA at 0.6457 could initially stall somewhere between the 0.6500 psychological level and the 61.8% Fibonacci mark of 0.6548. A decisive break above the latter could trigger significant momentum toward the 0.6638 barrier, and potentially further to the 78.6% Fibonacci level at 0.6720.
In the bearish scenario, where the pair closes below 0.6367, the 20- and 50-day SMAs may help limit downside pressures near the 38.2% Fibonacci of 0.6300. Further congestion could occur around the 0.6260 area before a sharper decline toward the 23.6% Fibonacci level at 0.6155.
In a nutshell, although AUDUSD is maintaining a neutral short-term outlook, the technical indicators suggest that buyers remain active, likely awaiting a close above 0.6427 to regain control.
Eurozone core CPI jumps to 2.7% as services inflation accelerates
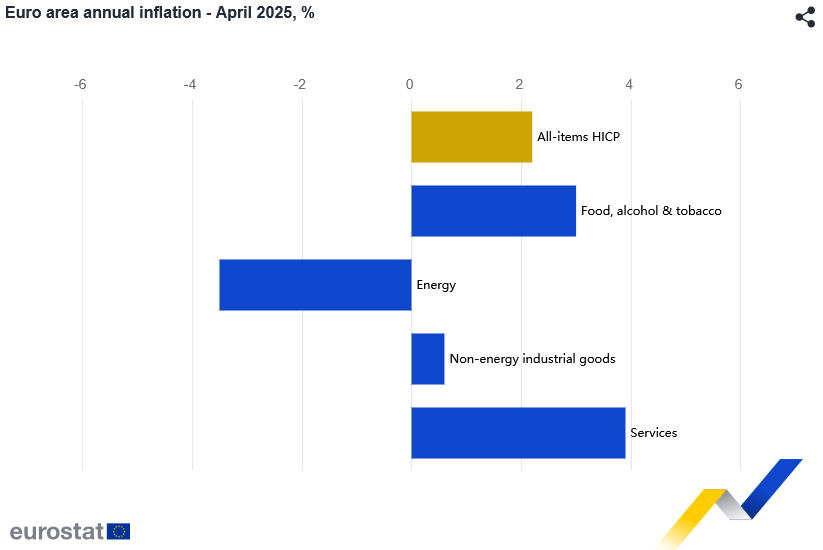
Eurozone headline CPI held steady at 2.2% yoy in April, slightly above expectations of 2.1% yoy. CPI core, which excludes energy, food, alcohol & tobacco, surged sharply from 2.4% yoy to 2.7% yoy, surpassing the forecast of 2.5%.
The acceleration in services inflation to 3.9% from 3.5% drove much of the upside surprise, highlighting persistent domestic price pressures. Meanwhile, energy prices fell more steeply at -3.5%, and non-energy industrial goods inflation was stable at 0.6%.
Eurozone PMI manufacturing finalized at 49.0, at risk if Chinese exports divert toward Europe
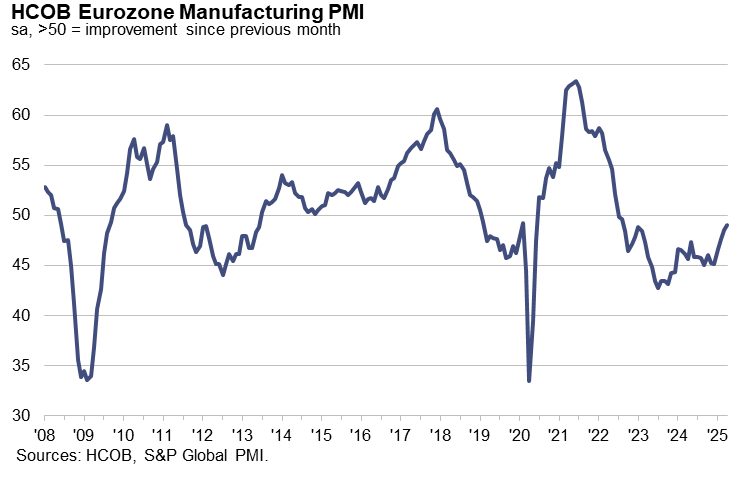
Eurozone manufacturing sector showed further signs of stabilization in April, with PMI Manufacturing Index finalized at 49.0, its highest reading in 32 months. Output growth was a standout, reaching a 37-month high at 51.5, reflecting a modest but encouraging improvement in activity.
Country-level data revealed a mixed picture, with Greece (53.2) and Ireland (53.0) leading the expansion, while Spain (48.1) and Austria (46.6) lagged behind. Notably, Germany (48.4) and France (48.2), two core economies, continued to show.
According to Cyrus de la Rubia at Hamburg Commercial Bank, the stabilization is somewhat unexpected given recent shocks, but optimism is holding up, aided by prospects of ECB rate cuts and the announced increase in EU defense spending.
Still, challenges remain. While manufacturers expanded margins in April, thanks to falling input costs and faster price hikes, this may not be sustainable. The risk of Chinese goods being redirected to Europe due to US tariffs could intensify competitive pressures, particularly on price.
Dollar Strengthens Ahead of Employment Data
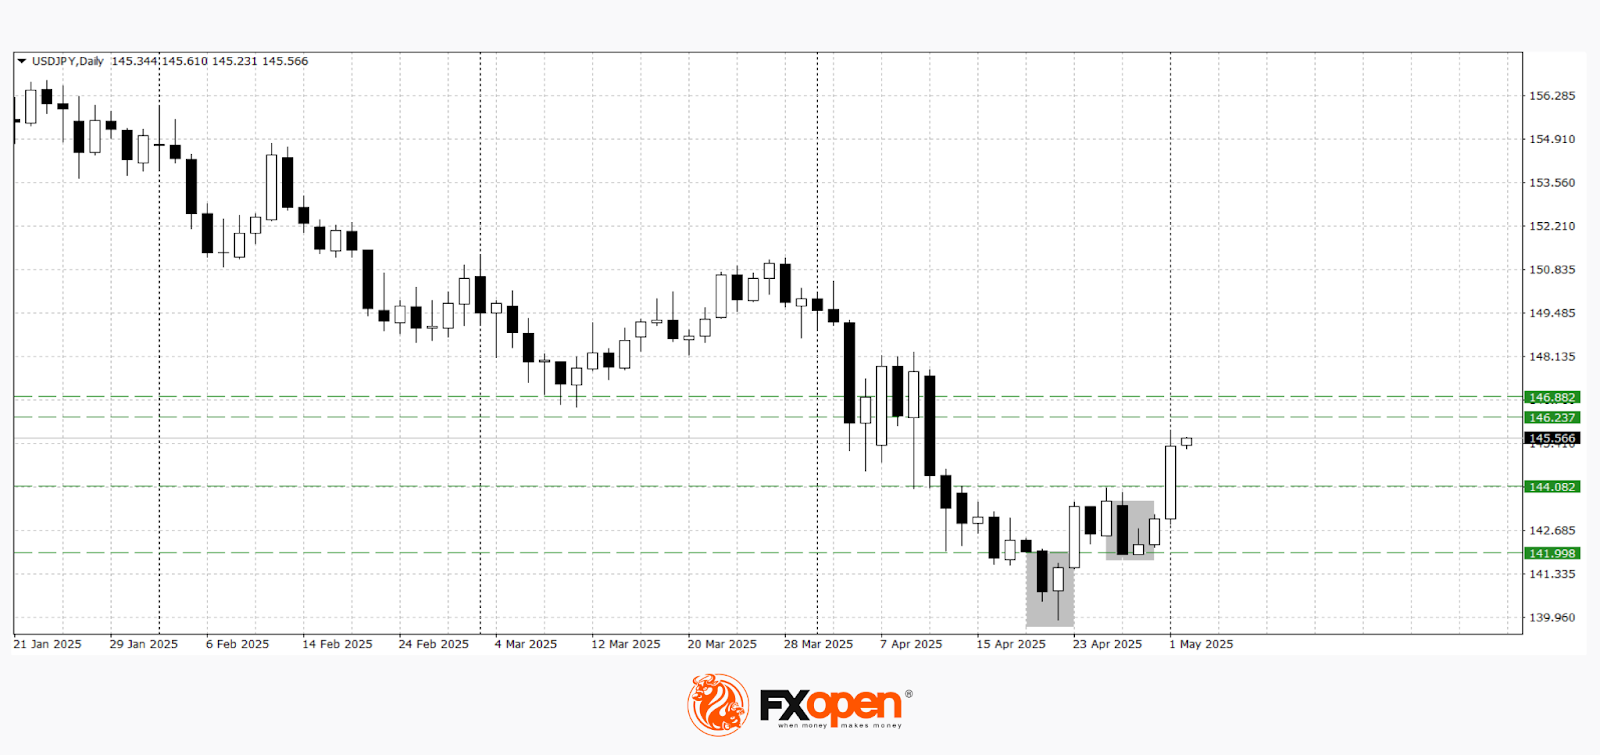
The USD/JPY and USD/CAD currency pairs are showing an upward trend, supported by the strengthening US dollar, which is backed by a number of factors. At yesterday's meeting, the Bank of Japan kept the key interest rate unchanged, disappointing "yen bulls" who had hoped for signals of a possible tightening of monetary policy. This decision by the Japanese regulator contributed to the weakening of the yen, causing the USD/JPY pair to update local highs, approaching key resistance levels.
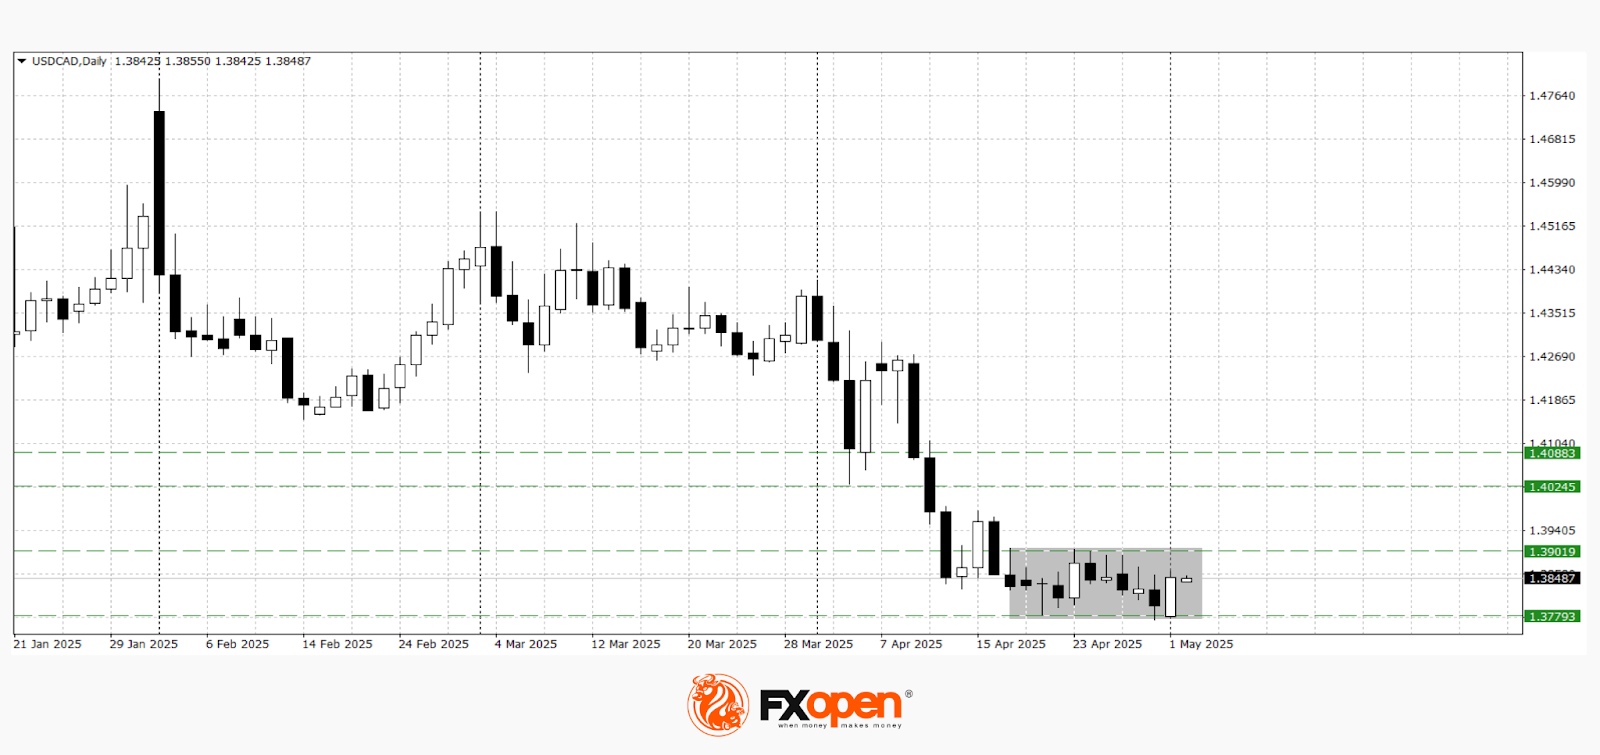
The USD/CAD pair continues to trade near local lows, holding above support around 1.3780, indicating stabilisation in demand for the dollar. An additional factor is the weak performance of oil prices, which remain in a sideways range, limiting the potential for strengthening the Canadian dollar.
Today, investors' attention is focused on the publication of the Non-Farm Payrolls report — a key employment indicator in the US. The consensus forecast expects job growth in April to be between 135,000 and 145,000, which is significantly lower than the March figure of 228,000. The unemployment rate is expected to remain at 4.2%, while the average hourly earnings growth is forecast to be 0.3% month-on-month. However, deviations from the forecast should be taken into account.
Stronger-than-expected data could bolster the US dollar, as it would reduce the likelihood of an imminent rate cut by the Federal Reserve.
The emerging uncertainty and speculative sentiment ahead of the Non-Farm Payrolls release are contributing to heightened trader activity and could lead to false breakouts and mixed price "spikes."
USD/JPY
Technical analysis of USD/JPY suggests potential growth of the pair towards 146.80-146.30, within the framework of previously formed reversal patterns such as the "piercing candle" and "bullish harami." A rebound from these or current levels could lead to a decline towards 145.00-144.00.
The following events could influence the pricing of USD/JPY:
- Today at 15:30 (GMT+3): US unemployment rate;
- Today at 15:30 (GMT+3): US average hourly earnings;
- Today at 15:30 (GMT+3): Change in US non-farm payrolls.
USD/CAD
For the second consecutive week, buyers of the USD/CAD pair are preventing the price from falling further near 1.3800-1.3770. According to technical analysis, the USD/CAD pair is in sideways movement within the range of 1.3900–1.3870. If the price consolidates above 1.3900, it may test the 1.4000 level. A move below 1.3780 could trigger the resumption of a downward momentum towards 1.3200-1.3100.
The following events could influence the direction of USD/CAD:
- Today at 17:00 (GMT+3): US industrial orders;
- Today at 22:30 (GMT+3): CFTC net speculative positions on CAD.
Trade over 50 forex markets 24 hours a day with FXOpen. Take advantage of low commissions, deep liquidity, and spreads from 0.0 pips. Open your FXOpen account now or learn more about trading forex with FXOpen.
This article represents the opinion of the Companies operating under the FXOpen brand only. It is not to be construed as an offer, solicitation, or recommendation with respect to products and services provided by the Companies operating under the FXOpen brand, nor is it to be considered financial advice.
US Stock Indices Futures Extended Gains While Gold (XAU/USD) Recent Losses Found Support at the 20-day MA
In today’s Asian session, US stock index futures reversed early losses. The S&P 500 and Nasdaq 100 E-mini futures initially fell 0.4% and 0.3% following cautious outlooks from Apple and Amazon despite upbeat Q1 earnings. However, both rebounded to post intraday gains of 0.6% and 0.3%, respectively, after China’s Commerce Ministry announced it is evaluating the possibility of trade talks with the US.
The Hong Kong stock market re-opened today after its Labour Day break on a jovial mood, where the Hang Seng Index rallied by 1.6% to hit nearly a one-month high on the backdrop of easing US-China trade tensions.
Separately, Japan concluded its second round of trade talks with the US. Economy Minister Akazawa declined to comment on specifics, including China or exchange rates, and noted the next meeting is planned for after mid-May. The Nikkei 225 added 1.1% in early trade and is poised for a seventh straight session of gains.
The US dollar rebounded, led by a sharp decline in the Japanese yen after the Bank of Japan held rates steady but slashed its fiscal year growth forecast to 0.5% from 1.1%, citing trade tariff uncertainty. The yen tumbled 1.6% to 145.40 per dollar on 1 May, its steepest drop this year. USD/JPY extended gains slightly today, rising to an intraday high of 145.93 in the Asian early session, with the 50-day moving average acting as an intermediate resistance at around 147.05.
Gold (XAU/USD) fell for a third straight session, shedding 1.5% to a near two-week low of $3,201 as easing US-China tensions dampened safe haven demand. However, it has since rebounded 0.5% in early Asian trading to $3,254, following a retest of its 20-day moving average, as markets await key US jobs data due later today.
Economic data releases
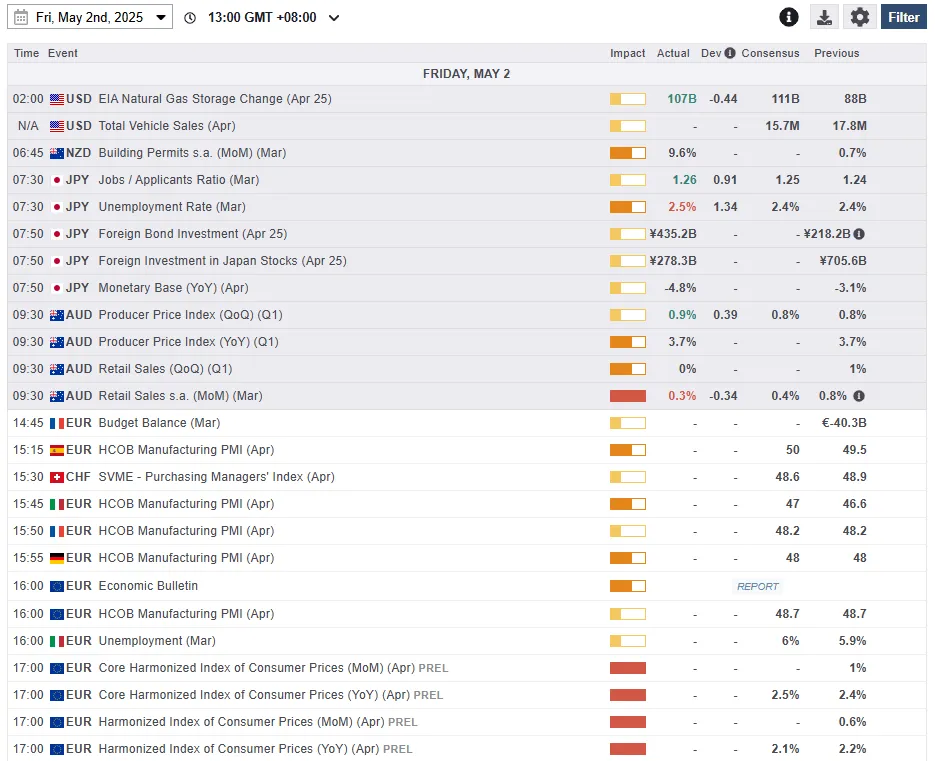
Fig 1: Key data for today’s Asian mid-session (Source: MarketPulse)
Chart of the day – Potential bullish reversal for Gold (XAU/USD) at 20-day MA
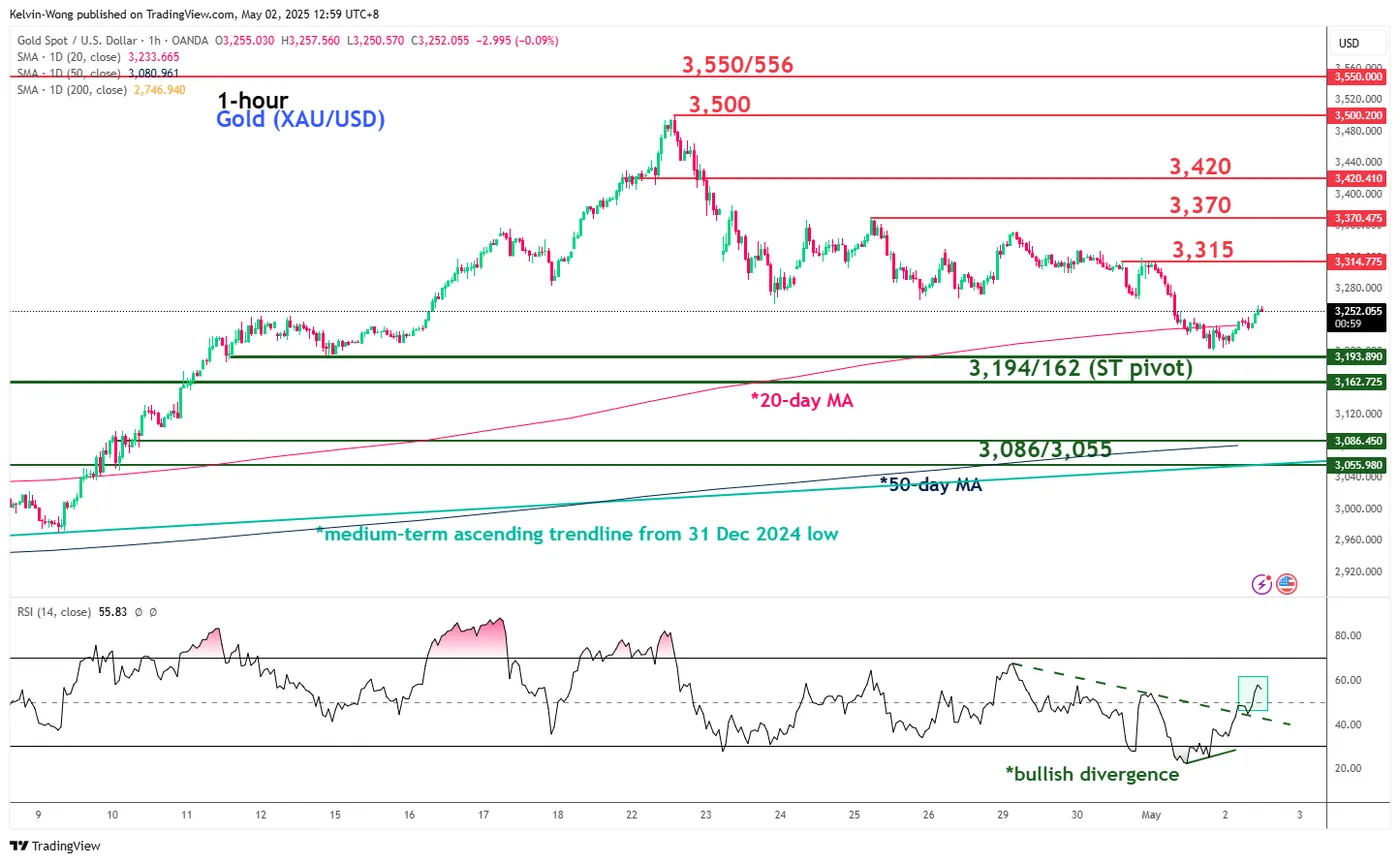
Fig 2: Gold (XAU/USD) minor trend as of 2 May 2025 (Source: TradingView)
The 8% decline seen in the price actions of Gold (XAU/USD) since its current all-time high of US$3,500 printed on 22 April 2025 has reached its 20-day moving average.
In addition, the downside momentum of the last three sessions has started to show signs of easing as indicated by the hourly RSI momentum indicator, where it has flashed out a bullish divergence condition at its oversold region in yesterday’s 1 May European session coupled with a bullish breakout above its 50 level in today’s first half of the Asian session.
Watch the US$3,194/3,162 key short-term pivotal support, and a clearance above the US$3,315 near-term resistance may see the next intermediate resistances coming in at US$3,370 and US$3,420 in the first step.
However, failure to hold above at US$3,162 invalidates the short-term recovery scenario for a potential multi-week corrective decline sequence to unfold that may expose the next intermediate support at US$3,086/3,055 (also the 50-day moving average).
GBP/JPY Daily Outlook
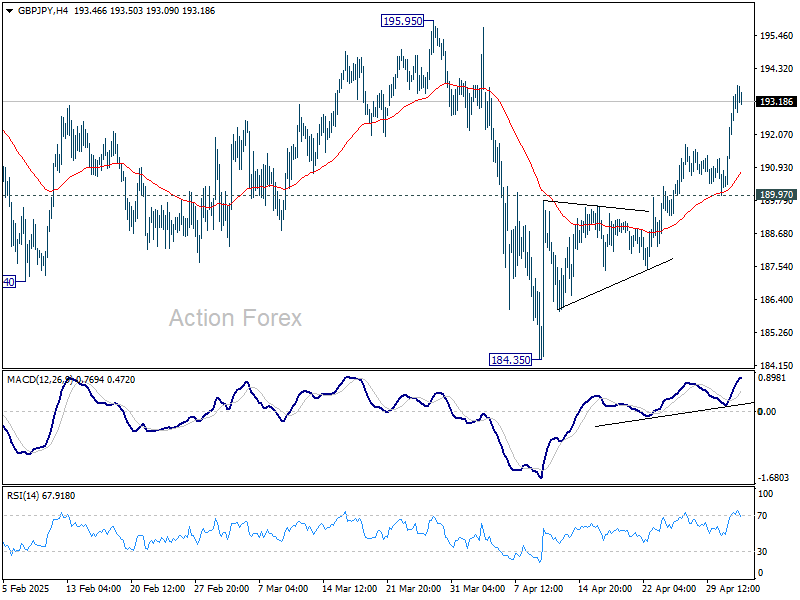
Daily Pivots: (S1) 190.05; (P) 190.66; (R1) 191.33; More...
Intraday bias in GBP/JPY remains on the upside for 195.59 resistance. Firm break there will argue that whole choppy decline from 199.79 has completed at 184.35. Rise from 180.00 could then be ready to resume through 199.79. For now, break of 189.97 support is needed to indicate short term topping. Otherwise, further rise will remain in favor in case of retreat.
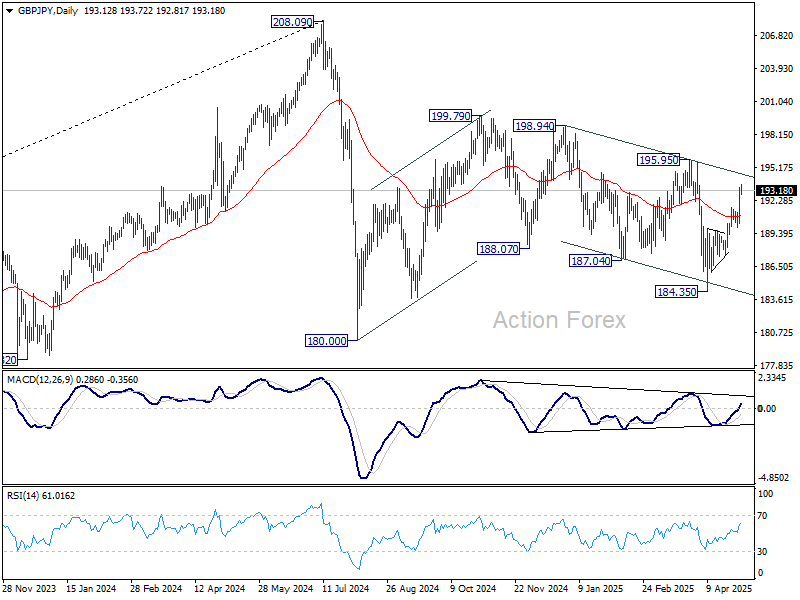
In the bigger picture, price actions from 208.09 are seen as a correction to rally from 123.94 (2020 low). Strong support should be seen from 38.2% retracement of 123.94 to 208.09 at 175.94 to contain downside. However, sustained break of 175.94 will bring deeper fall even still as a correction.
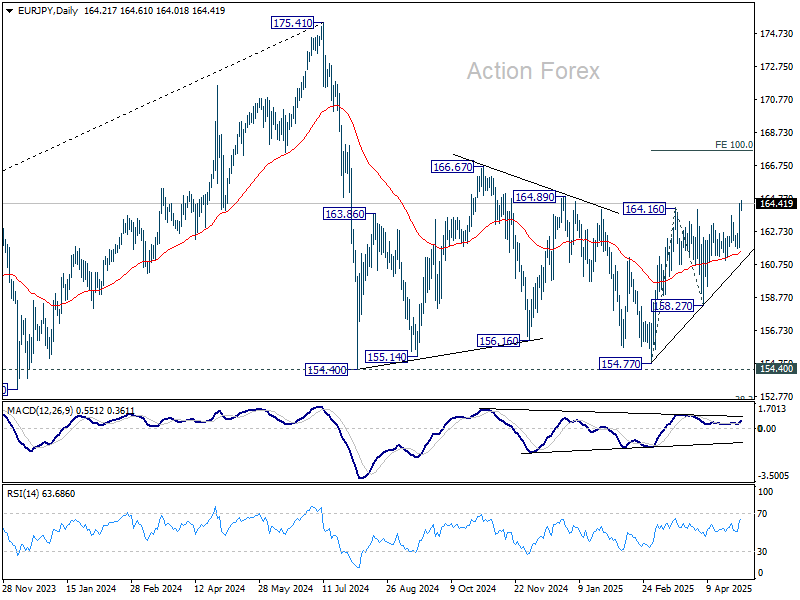
EUR/JPY Daily Outlook
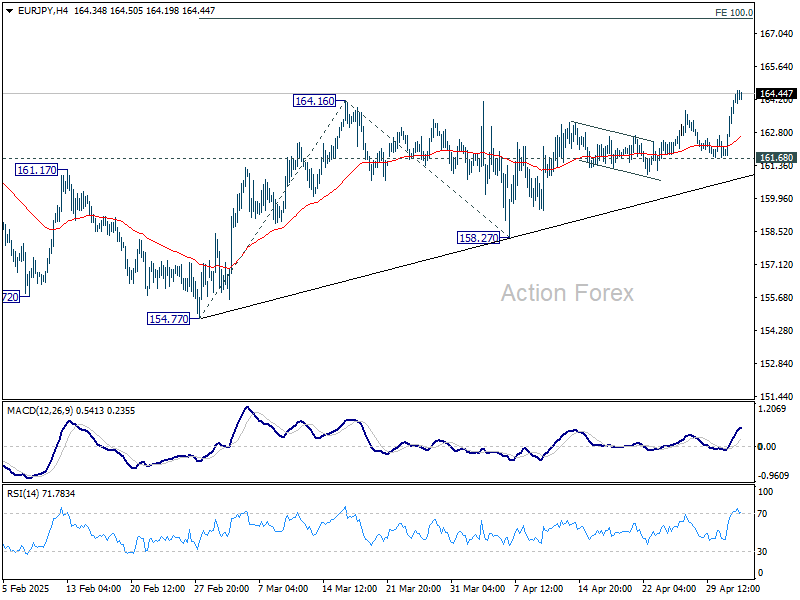
Daily Pivots: (S1) 162.52; (P) 163.49; (R1) 165.18; More...
EUR/JPY's break of 164.16 indicates resumption of whole rise from 154.77. Intraday bias is now on the upside for 100% projection of 154.77 to 164.16 from 158.27 at 167.66. For now, further rally will remain in favor as long as 161.68 support holds, in case of retreat.
In the bigger picture, price actions from 175.41 are seen as correction to rally from 114.42 (2020 low). Strong support should be seen from 38.2% retracement of 114.42 to 175.41 at 152.11 to contain downside. However, sustained break of 152.11 will bring deeper fall even still as a correction.