Sample Category Title
Powell Fed Has a Track Record of Wanting to be Very Sure and Then Going Fast
Markets
Markets took a slow start to the trading week as the risk rally fizzled and with UK markets closed for May Day holiday. The German Dax’s outperformance (+1.1%) was exception to the rule. The index is just a session away from breaking the previous all-time high set in March, implying full retracement on the 20% (!!) hit from the build-up to and aftermath of US President Trump’s Liberation Day. At least according to this metric, it’s becoming clear that the impact of the new German government’s policies (announcements on fiscal/defense spending expected before summer) will offset the damaging impact from tariff wars. Yesterday’s sole data point was a consensus-beating April Services ISM (51.6 from 50.8 vs 50.2 expected). It’s a welcome sign after last month’s sudden collapse in the ISM (53.5 to 50.8). Details showed lower business activity (53.7 from 55.9), but an acceleration in new orders (52.3 from 50.4). Businesses cut jobs for a second month straight, though at a slower pace (49 from 46.2). The prices paid index rose to its highest level since January 2023 (65.1 from 60.9). The ISM triggered some underperformance of US Treasuries vs German Bunds. The intraday bear flattening isn’t reflected in the daily close because of performance in the run-up to the release. Daily changes on the US curve eventually ranged between 0.8 bps (2-yr) and +4.6 bps (30-yr). German yields closed between flat (30-yr) and 2 bps lower (5-yr). The US dollar erased earlier losses following the ISM with EUR/USD dipping from an intraday high at 1.1360 back to opening levels just above 1.13. Short term, we expect more underperformance of US Treasuries in combination with a stronger dollar (testing EUR/USD 1.1276/74 support). The ISM further reduced Fed rate cut bets at the June meeting, from around 33% to 25%. The US central bank is expected to keep rates steady at tomorrow’s meeting and signal no intent to break the deadlock any time soon. The trade-off between downside risks to the maximum employment goal and upside risks to price stability clearly tilt to the latter. Not only because of the expected impact from tariffs on already above target inflation, but also from the self-fulfilling risk coming from surging inflation expectations for consumers and companies. We stick to the view that the Fed rate cut pause will last at least over summer. The Powell Fed has a track record of wanting to be very sure and then going fast. If the labour market breaks, they’ll be inclined to use the ample policy room towards neutral levels as soon as possible. They showcased that last September by kicking off with a 50 bps rate cut. That contrasts hugely with the US money market view of pre-emptive 25 bps rate cuts. Today’s eco calendar is razor thin apart from a $42bn 10-yr Note auction. The success will be indicative on the return of market calm following last month’s violent sell-off at the long end of the curve (US risk premium). The real test comes on Thursday with a $25bn 30-yr bond auction. Yesterday’s $58bn 3-yr Note sale was solid.
News & Views
The European Commission will today announce a plan to fully end gas imports from Russia. European officials familiar with the matter said companies will have to stop all spot market gas contracts with Russian suppliers by the end of the year while long-term contracts are due to be severed by 2027. Doing so would wean the bloc off almost fully from Russian fossil fuels. Before the invasion of Ukraine in 2022, the EU imported more than 40% of its pipeline gas imports and almost 30% of crude oil from Russia. Both significantly decreased on face value since then but in the case of gas, there has been a shift from pipeline transit to LNG. The EU last year imported a record amount of Russian LNG. The Commission’s plan is also intended as a signal to Washington that the EU stands ready to buy more US LNG as a way to reduce its trade deficit.
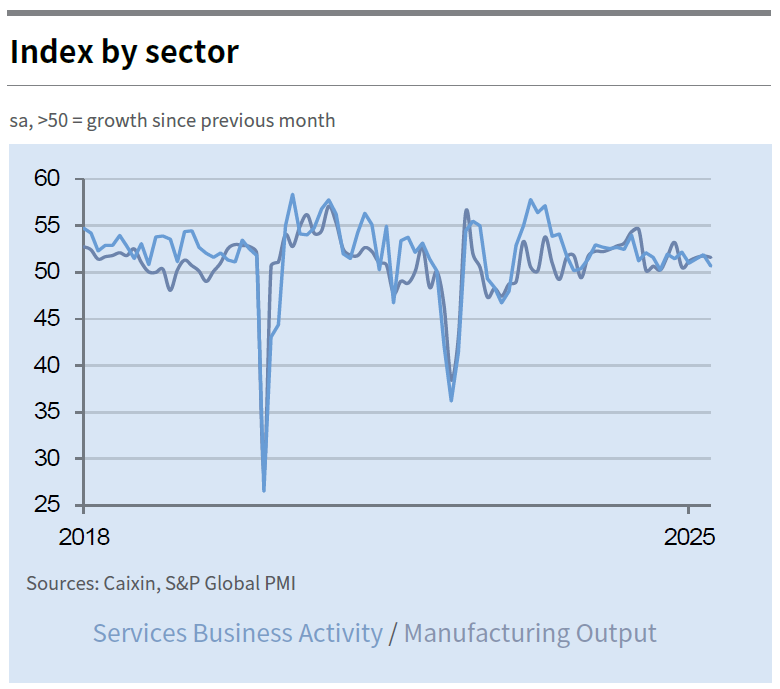
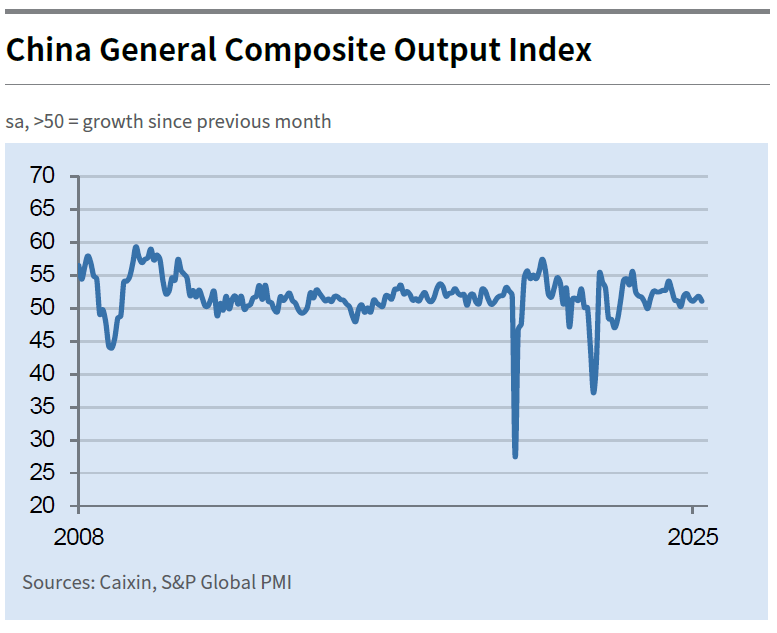
China’s services sector barely grew in April, the Caixin private sector PMI suggests this morning. The headline index retreated from 51.9 to 50.7, the lowest in seven months. Weak details included the slowest rise in business orders since December 2022 and staff reduction for a second month straight. Concerns over the negative impact of shifting trade policies also weighed on sentiment. Business confidence among service providers slipped to the second-lowest level recorded since data collection began in November 2005. This concerning outlook for sales led service companies to reduce their charges again despite stronger cost inflation. Despite the poor PMI, China’s onshore yuan rallies nevertheless during the first session of the month this morning. It’s mostly a catch-up move with the offshore CNH’s performance over the last couple of days, in turn linked rising trade deal hopes.
PMIs Take Center Stage, Lifting the Veil on Recent Trade Uncertainty
In focus today
Today, focus turns to the final euro area PMI data for April. Revised manufacturing data has already revealed manufacturing rising to 49.0 from the preliminary print of 48.7. The index thus stands at the highest level since August 2022, which is much better than feared given the trade uncertainty that mainly affects sales of goods. Overshadowing this however, preliminary services PMI dipped into contraction territory for the first time since November, as it declined to 49.7 from 51.0, so it will be interesting to see whether this is also revised up in the final print.
In Sweden, at 8.30 CET we will receive the services and composite PMIs for April. As for the manufacturing sector, both the PMI and the NIER survey for April posted gains, while the services sector indicator in the NIER survey was more or less unchanged in April (98.0 vs 97.7). Thus, the overall impression from these surveys is that a marked downturn in today's PMI figures seems unlikely.
Economic and market news
What happened yesterday
In the euro area, the Sentix investor confidence index clawed back above expectations to -8.1 from -19.5 in April (cons: -12.5). While the index remained in negative territory, this also underlines that investors view the recent movements in the trade war as less aggressive compared to a month ago.
In the US, the ISM report on US non-manufacturing sector revealed a PMI of 51.6 in April up from 50.8 in March (cons: 50.6). The non-manufacturing business activity index declined to 53.7 from 55.9, but continued to remain well above 50, while new orders, prices and employment all moved higher. Overall, a hawkish data print that moved EUR/USD somewhat lower.
In Switzerland, inflation surprised significantly to the downside with headline inflation at 0.0% y/y (prior: 0.3%, cons: 0.2%) in April and core at 0.6% y/y (prior: 0.9%, cons: 0.8%). This comes while the SNB has an expectation 0.3% for Q2. EUR/CHF jumped higher on release and markets are increasingly pricing a cut of 50bp for the upcoming meeting in June, currently pricing in 30bp. We continue to expect a cut to 0% in June with the SNB commencing on FX intervention to weaken the CHF before negative territory is reached. After today's release however, the risk of a move to negative rates has definitely increased.
Equities: Yesterday, we saw a decline in equity markets, breaking the recent upward streak that has persisted over the past couple of weeks. Notably, this movement occurred without any significant changes in the news flow. It is worth highlighting that US equities underperformed relative European equities, where cyclical stocks continued to lead. In contrast, defensives outperformed in the US. In the US yesterday, Dow -0.2%, S&P 500 -0.6%, Nasdaq -0.7%, Russell 2000 -0.8%. Turning to Asia this morning, markets are generally in positive territory, while futures in both Europe and especially the US are pointing lower.
FI&FX: Stronger-than-expected US economic data sent bond yields higher while the USD is stabilising versus EUR and JPY. The oil price continued to decline as OPEC keeps raising output. In Asia there has been a weakening of the USD relative to some of local currencies such as the Taiwan dollar.
USD/CHF Daily Outlook
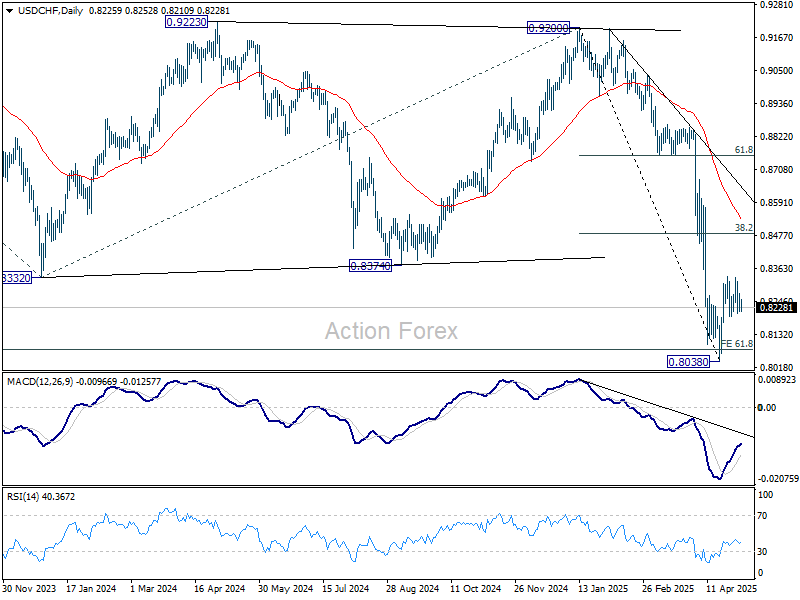
Daily Pivots: (S1) 0.8200; (P) 0.8237; (R1) 0.8261; More….
USD/CHF is still bounded in range below 0.8333 and intraday bias stays neutral at this point. On the upside, above 0.8333 will resume the rebound from 0.8038. However, upside should be limited by 38.2% retracement of 0.9200 to 0.8038 at 0.8482. On the downside, below 0.8196 minor support will bring retest of 0.8038. Firm break there will resume larger down trend.
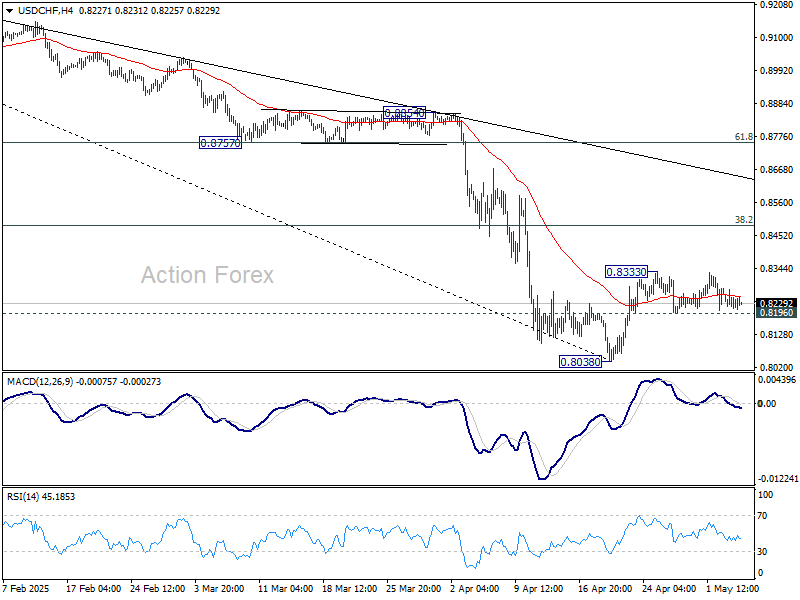
In the bigger picture, long term down trend from 1.0342 (2017 high) is still in progress and met 61.8% projection of 1.0146 (2022 high) to 0.8332 from 0.9200 at 0.8079 already. In any case, outlook will stay bearish as long as 55 W EMA (now at 0.8763) holds. Sustained break of 0.8079 will target 100% projection at 0.7382.
Dollar and Loonie Soft Ahead of Carney-Trump Meeting
Dollar remains on the soft side today, although losses are so far limited. Currency market activity is subdued as traders remain cautious ahead of the upcoming FOMC rate decision. While no policy changes are expected from the Fed tomorrow, markets are watching closely for any forward guidance. Notably, expectations for a June rate cut have continued to fade, with implied probabilities falling below 30%, reflecting the resilience of recent economic data, particularly on jobs.
However, the bigger driver of sentiment remains progress, or the lack thereof, on the trade front. Canadian Prime Minister Mark Carney is scheduled to meet President Donald Trump in Washington on Tuesday — the first face-to-face since Carney’s April 28 election victory. Trade and security are set to top the agenda. Canada is expected to bring proposals linked to energy and critical minerals, hoping to secure relief from US tariffs. Still, Carney has emphasized that substance will take precedence over speed.
Meanwhile, US Treasury Secretary Scott Bessent hinted on Monday that deals with some trading partners were “very close,” echoing Trump's remarks over the weekend. Yet no concrete agreements have been announced. A Bloomberg report suggested India is willing to offer zero tariffs on selected goods, but details remain sparse. Overall, market optimism over trade progress exists but is tempered by repeated delays and lack of formal announcements.
So far this week, Dollar is the weakest performer, though still above last week's lows. Loonie is also under pressure as markets await Carney's Washington visit. Euro is lagging as well. Yen leads the gainers, followed by Kiwi and Swiss Franc. Sterling and Aussie are holding in the middle of the pack.
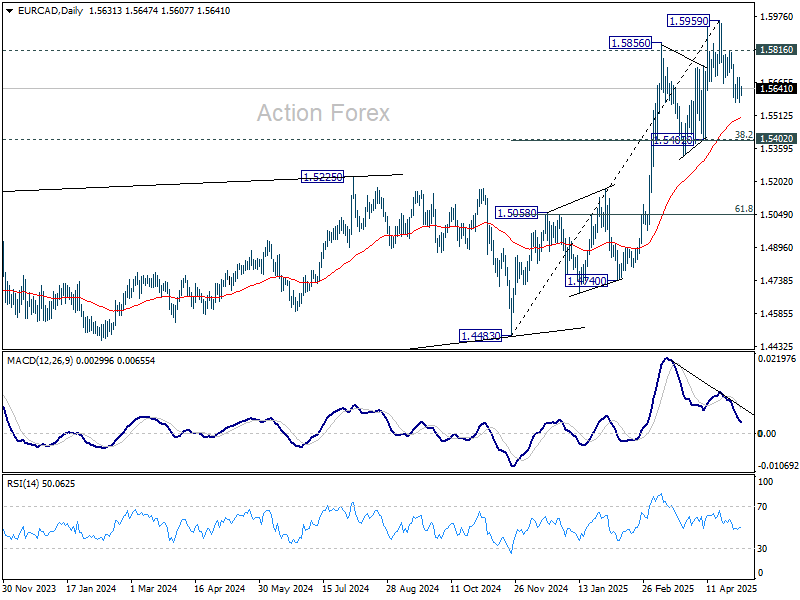
Technically's EUR/CAD's decline from 1.5959 is currently seen as part of a corrective pattern to the rally from 1.4483. Deeper fall is expected as long as 1.5816 resistance holds, to 55 D EMA (now at 1.5505) and possibly below. But strong support should be seen from 1.5402 cluster support (38.2% retracement of 1.4483 to 1.5959 at 1.5395) to contain downside.
In Asia, Japan is still on holiday, Hong Kong HSI is up 0.62%. China Shanghai SSE is up 0.93%. Singapore Strait Times is up 0.20%. Overnight, DOW fell -0.24%. S&P 500 fell -0.64%. NASDAQ fell -0.74%. 10-year yield rose 0.021 to 4.343.
Looking ahead, Swiss unemployment rate, France industrial production, Eurozone PMI services final and PPI, and UK PMI services final will be released in European session. Later in the day, Canada and US will publish trade balance.
Gold breaks higher, eyes on 3500 and beyond
Gold's extended rebound and break of 3352.97 resistance argues that correction from 3449.79 has already completed at 3201.70. Further rise is now expected to 3499.79 and then 61.8% projection of 2956.61 to 3449.70 from 3201.70 at 3537.38. Decisive break of 3537.38 could prompt upside acceleration towards 100% projection at 3744.88. However, break of 55 4H EMA (now at 3287.46) will resume the corrective fall from 3499.79 with another downleg.
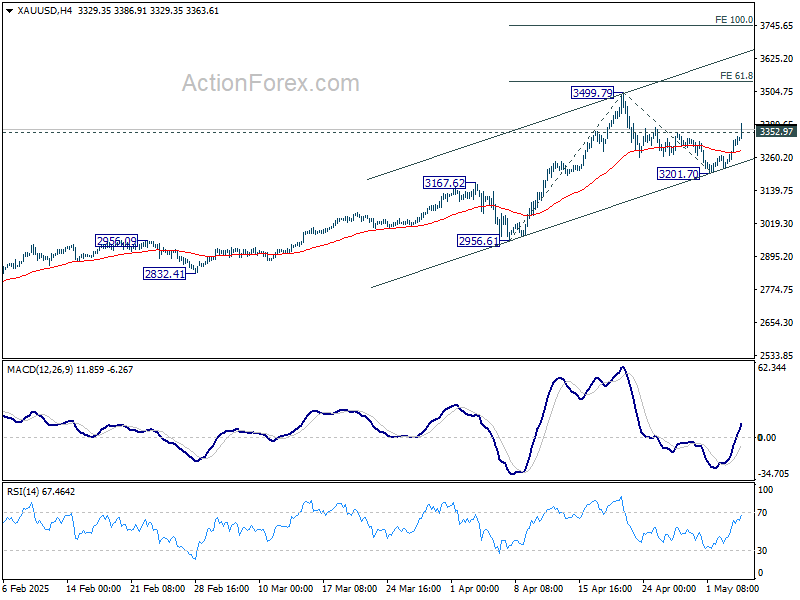
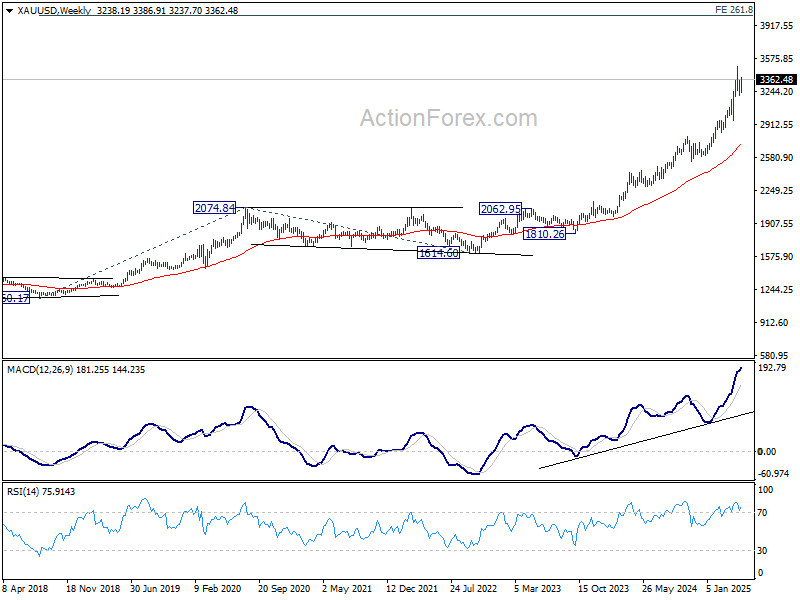
In the bigger picture, the long term up trend remains intact and there is no sign of loss of momentum in W MACD, despite overbought condition in W RSI. Next medium term target remains at 261.8% projection of 1160.17 to 2074.84 from 1614.60 at 4009.20, which is close to 4000 psychological level.
China's Caixin PMI composite falls to 51.1, tariff impact to deepen in Q2–Q3
China’s Caixin PMI Services dropped to 50.7 in April, down from 51.9 and missing expectations of 51.7. PMI Composite also slipped from 51.8 to 51.1, signaling weaker momentum across both manufacturing and services.
According to Caixin’s Wang Zhe, the expansion in supply and demand has decelerated amid growing trade friction. Export-driven sectors remain under particular pressure, while job losses and muted pricing power continue to squeeze business margins. The employment component of the composite index also contracted.
Perhaps most concerning, expectations for future activity plunged to the lowest levels on record, reflecting rising uncertainty among firms. "The ripple effects of the ongoing China-US tariff standoff will gradually be felt in the second and third quarter", Wang added.
USD/CHF Daily Outlook
Daily Pivots: (S1) 0.8200; (P) 0.8237; (R1) 0.8261; More….
USD/CHF is still bounded in range below 0.8333 and intraday bias stays neutral at this point. On the upside, above 0.8333 will resume the rebound from 0.8038. However, upside should be limited by 38.2% retracement of 0.9200 to 0.8038 at 0.8482. On the downside, below 0.8196 minor support will bring retest of 0.8038. Firm break there will resume larger down trend.
In the bigger picture, long term down trend from 1.0342 (2017 high) is still in progress and met 61.8% projection of 1.0146 (2022 high) to 0.8332 from 0.9200 at 0.8079 already. In any case, outlook will stay bearish as long as 55 W EMA (now at 0.8763) holds. Sustained break of 0.8079 will target 100% projection at 0.7382.
Trade Suspense Becomes Discouraging
The week kicked off on a positive note for German stocks. Rheinmetall – a defense stock – was the top winner in the DAX index as the company extended gains for a fourth consecutive session to a record high, while enthusiasm was much less visible in the US markets. The S&P 500 gapped lower; although the index spent the session trying to rebound, it ended 0.64% lower on no major trade news. The buying that had been driven by hopes of a turnaround in trade winds over the past nine sessions is gently losing momentum. Still, there are some minor developments: India is considering zero tariffs on sectors including steel and auto parts, and Trump keeps saying that trade deals will be announced as soon as this week. So, we wait.
In FX, the US dollar remains softer across the board; its rapid selloff against Asian peers was particularly in focus over the past two sessions and raised concerns about the dollar’s status as a safe haven and reserve currency. It’s now said that Asian countries may be rushing to convert their dollar-denominated export revenues into local currencies to avoid holding USD in an increasingly uncertain trade and geopolitical environment. Taiwan, on the other hand, denied rumours of any FX agreement that would allow the US dollar to depreciate to improve US companies' price competitiveness abroad. As mentioned, there's still chatter that some trade deals could be announced this week, but the week began with Trump’s latest threat of 100% tariffs on foreign-made films to save the ‘dying Hollywood’—not actual trade deals.
As such, Netflix and Disney gapped lower at Monday open. Although prices recovered as the session advanced, Netflix ended the day nearly 2% lower, and Ford became the latest company to warn that tariffs will hurt. Palantir, on the other hand, stood out from the crowd of worried companies, calling AI demand a ‘ravenous whirlwind,’ announcing better-than-expected earnings, and raising its full-year revenue forecast. Alas, the results fell short of expectations, and even Palantir dropped more than 9% in after-hours trading.
From here, the lack of good news on the trade front will likely discourage bulls from extending the latest rally. Yet, I firmly believe that optimistic investors are positioning to catch the moment when potential tariff deals pop and trigger a rebound—they just don’t want to miss the rally by coming in too late. That mindset could help limit losses if the suspense doesn’t last long and trade deals really materialize.
Data-wise, the latest ISM services report showed a faster-than-expected expansion in US activity in April and accelerating price pressures. Combined with relatively strong jobs data last month and an improved Atlanta Fed growth estimate for Q2, this has tempered expectations for US rate cuts. In fact, the Atlanta Fed’s GDPNow forecast points to 1.1% Q2 growth, thanks in part to an improved trade deficit after Q1 imports surged in anticipation of tariffs, pushing Q1 growth into negative territory. We’ll see if—and by how much—Q2 growth improves after the initial tariff-led frontloading.
It’s clear the Federal Reserve (Fed) will want to wait and see how tariffs affect growth and inflation before making its next move. As such, this week’s policy meeting is not expected to bring any rate changes. Fed funds futures pricing suggests an almost 99% chance of no cut this week—but traders still expect three cuts this year, with the first potentially coming this summer.
For now, though, the current data pushes against expectations of a June cut. As the Fed begins its two-day meeting, the probability of a June rate cut is under 30%. Chair Powell’s post-decision press conference will be key to gauging whether the FOMC leans toward cutting in June due to economic headwinds or opts to wait for clarity on tariffs and inflation. So far, the rebound in the US 2-year yield suggests markets are giving more weight to the "wait and see" approach.
Last week’s yield rebound—along with renewed hope for trade deals—helped the dollar recover, yet a hesitant Fed could still weigh on US growth expectations and keep the dollar under pressure. The EURUSD remains bid below the 1.13 mark, the USDJPY is back below 144, and the Swiss franc couldn’t weaken despite a softer-than-expected inflation reading yesterday, which supports expectations that the Swiss National Bank (SNB) will cut rates to zero in June.
For equities, central bank stances will continue to shape risk appetite, and for now, European equities remain in a better position than their US peers.
Earnings season, meanwhile, has been fairly strong for S&P 500 companies, but solid results have been overshadowed by downward revisions to earnings forecasts. Analysts also cut their own EPS estimates for Q2 by a larger-than-average margin during April. FactSet notes that analysts usually reduce estimates in the first month of a quarter, but this year’s 2.4% decline exceeds the five-year average of 1.8%. In short, the S&P 500’s gains won’t be solidified until there’s more clarity on trade, and large US companies with international exposure will continue to struggle under the weight of uncertainty.
Gold breaks higher, eyes on 3500 and beyond
Gold's extended rebound and break of 3352.97 resistance argues that correction from 3449.79 has already completed at 3201.70. Further rise is now expected to 3499.79 and then 61.8% projection of 2956.61 to 3449.70 from 3201.70 at 3537.38. Decisive break of 3537.38 could prompt upside acceleration towards 100% projection at 3744.88. However, break of 55 4H EMA (now at 3287.46) will resume the corrective fall from 3499.79 with another downleg.
In the bigger picture, the long term up trend remains intact and there is no sign of loss of momentum in W MACD, despite overbought condition in W RSI. Next medium term target remains at 261.8% projection of 1160.17 to 2074.84 from 1614.60 at 4009.20, which is close to 4000 psychological level.
WTI Crude Oil Down – Energy Markets Brace for Extended Volatility
Key Highlights
- WTI Crude Oil prices started a major decline below $62.00 and $60.00.
- A connecting bearish trend line is forming with resistance at $60.20 on the 4-hour chart.
- Gold prices might aim for a fresh increase above the $3,350 resistance.
- EUR/USD is holding the 1.1265 zone and could start a decent increase.
WTI Crude Oil Price Technical Analysis
WTI Crude Oil price started a major decline from $65.00 against the US Dollar. It declined heavily below the $62.00 and $60.00 support levels.
Looking at the 4-hour chart of XTI/USD, the price settled well below the $58.50 level, the 100 simple moving average (red, 4-hour), and the 200 simple moving average (green, 4-hour). The bears even pushed the price below the $56.5 mark. Finally, the price found some support near the $55.50 level.
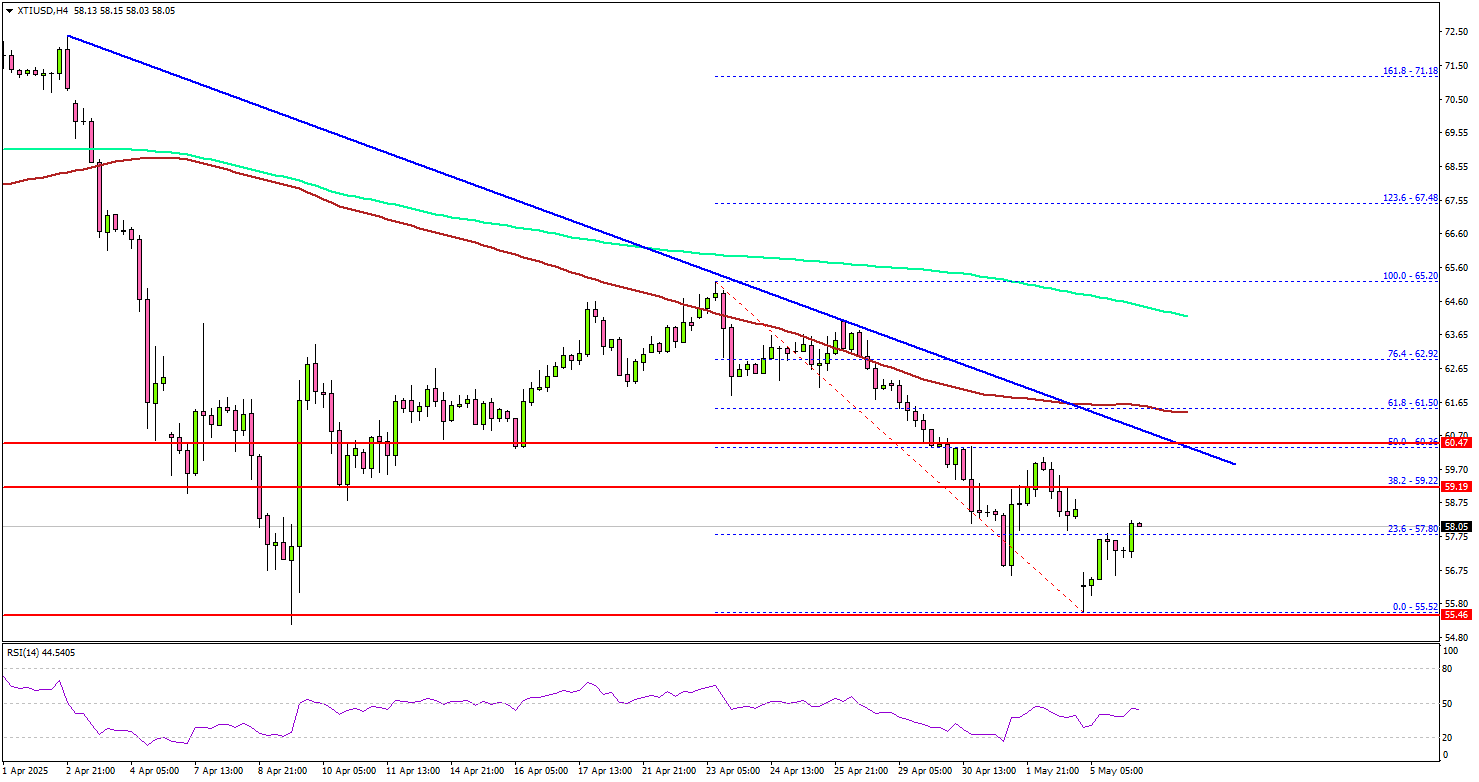
The price started a consolidation zone and tested the 23.6% Fib retracement level of the downward move from the $65.20 swing high to the $55.52 low.
On the upside, the price is facing hurdles near the $59.20 level. The first key resistance sits near the $60.00 level. There is also a connecting bearish trend line forming with resistance at $60.20 on the same chart.
The main hurdle is now near the $61.50 zone, above which the price may perhaps accelerate higher. In the stated case, it could even visit the $62.50 resistance. Any more gains might call for a test of the $65.00 resistance zone in the near term.
On the downside, the first major support sits near the $55.50 zone. A daily close below $55.50 could open the doors for a larger decline. The next major support is $52.50. Any more losses might send oil prices toward $50.00 in the coming days.
Looking at Gold, there was a recovery wave, and the bulls might aim for a fresh move above the $3,350 resistance.
Economic Releases to Watch Today
- Germany’s Services PMI for April 2025 - Forecast 48.8, versus 48.8 previous.
- Euro Zone Services PMI for April 2025 – Forecast 49.7, versus 49.7 previous.
- UK Services PMI for April 2025 – Forecast 48.9, versus 48.9 previous.
China’s Caixin PMI composite falls to 51.1, tariff impact to deepen in Q2–Q3
China’s Caixin PMI Services dropped to 50.7 in April, down from 51.9 and missing expectations of 51.7. PMI Composite also slipped from 51.8 to 51.1, signaling weaker momentum across both manufacturing and services.
According to Caixin’s Wang Zhe, the expansion in supply and demand has decelerated amid growing trade friction. Export-driven sectors remain under particular pressure, while job losses and muted pricing power continue to squeeze business margins. The employment component of the composite index also contracted.
Perhaps most concerning, expectations for future activity plunged to the lowest levels on record, reflecting rising uncertainty among firms. "The ripple effects of the ongoing China-U.S. tariff standoff will gradually be felt in the second and third quarter", Wang added.
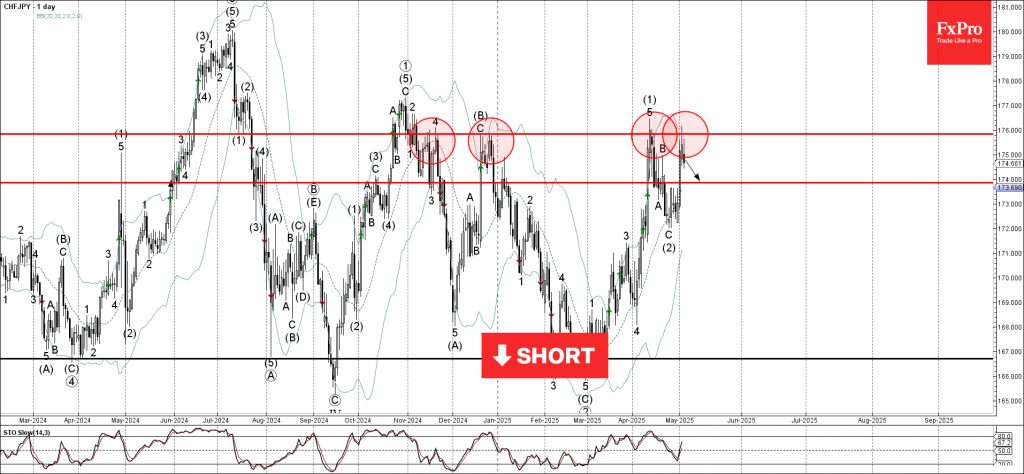
CHFJPY Wave Analysis
CHFJPY: ⬇️ Sell
- CHFJPY reversed from the resistance zone
- Likely to fall to support level 174.00
CHFJPY currency pair recently reversed down from the resistance zone between the pivotal resistance level 175.85 (which has been steadily reversing the price from November) and the upper daily Bollinger Band.
The downward reversal from this resistance zone stopped the previous sharp upward impulse wave (3) from the end of April.
Given the strength of the resistance level 175.85, CHFJPY currency pair can be expected to fall to the next support level 174.00.
Brent Crude Oil Wave Analysis
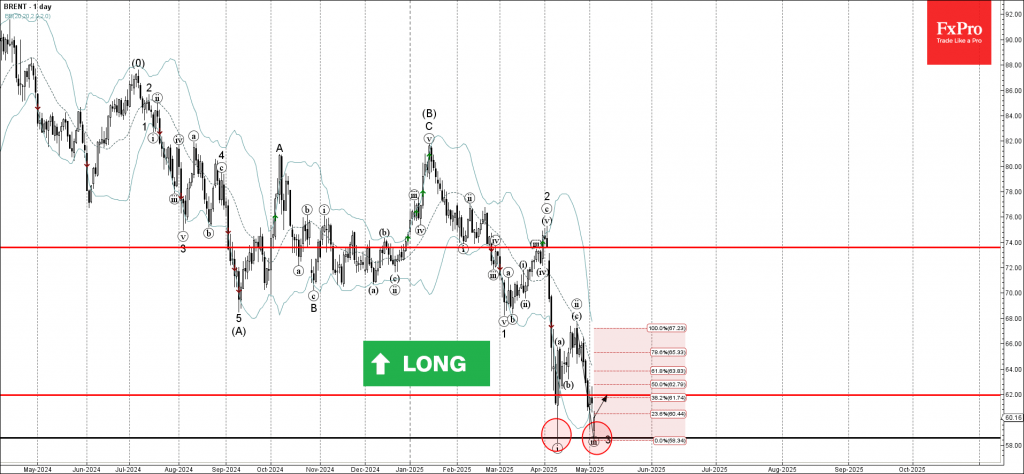
Brent crude oil: ⬆️ Buy
- Brent crude oil reversed from support zone
- Likely to rise to resistance level 62.00
Brent crude oil recently reversed up sharply from the support zone between the key support level 58.60 (which stopped the previous sharp impulse wave i) and the lower daily Bollinger Band.
The upward reversal from this support zone formed the daily Japanese candlesticks reversal pattern Hammer, which highlights the strength of this support area.
Brent crude oil can be expected to rise to the next resistance level 62.00 (38.2% Fibonacci correction of the previous sharp downward impulse from April).