

Sample Category Title
GBP/USD Struggles To Recover As Losses Continue To Linger
Key Highlights
- GBP/USD started a major decline below 1.3450 and 1.3420.
- It traded below a contracting triangle with support at 1.3410 on the 4-hour chart.
- EUR/USD dipped heavily before the bulls appeared near 1.1500.
- Gold extended losses below $4,400 and tested $4,280.
GBP/USD Technical Analysis
The British Pound failed to surpass 1.3520 against the US Dollar. GBP/USD started a fresh decline below 1.3460 and 1.3450 to move into a bearish zone.
Looking at the 4-hour chart, the pair traded below a contracting triangle with support at 1.3410. The pair settled well below the 100 simple moving average (red, 4-hour) and the 200 simple moving average (green, 4-hour).
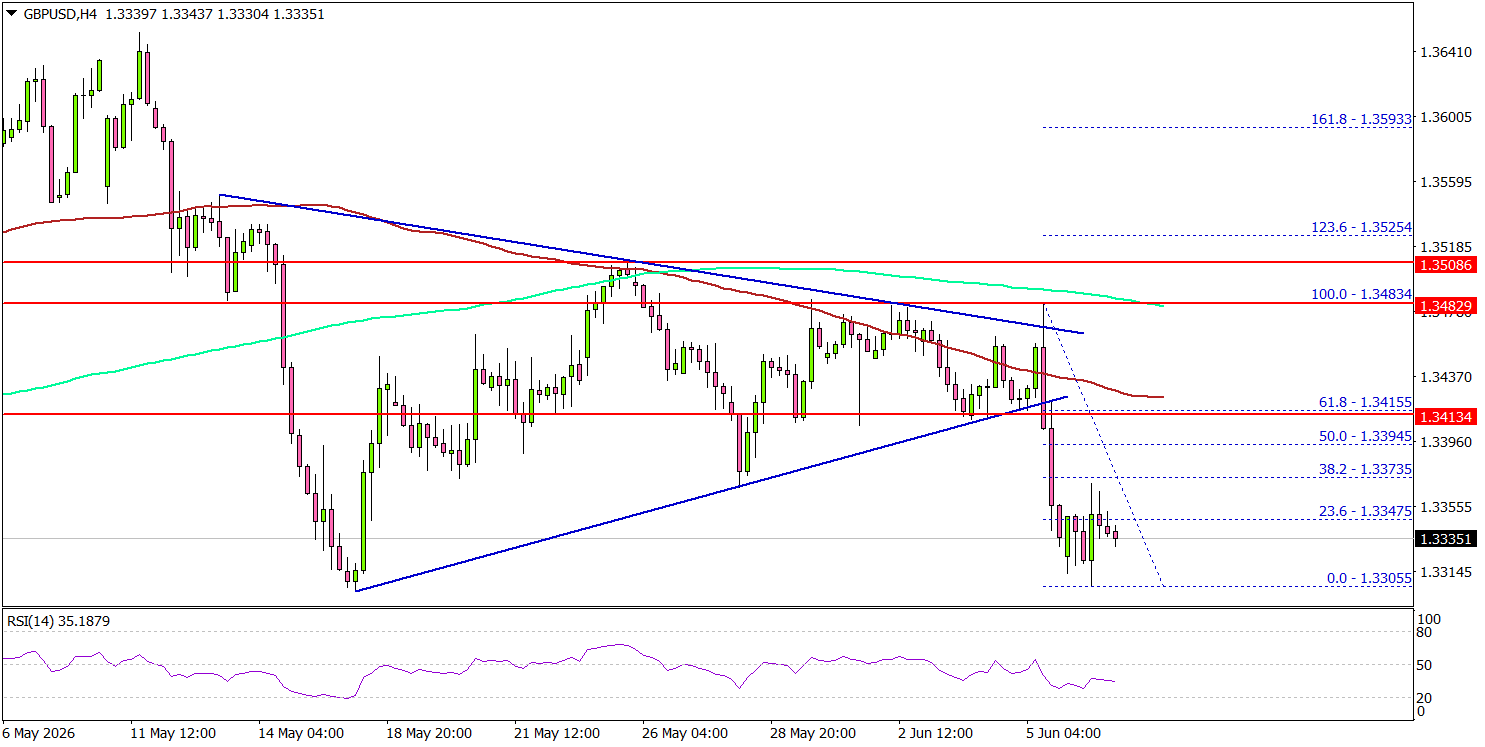
It even tested 1.3300 before the bulls took a stand. The pair is now consolidating losses above 1.3300. On the upside, an immediate resistance could be 1.3375. The next major resistance might be 1.3400.
A close above 1.3400 could open doors for gains. The main hurdle for the bulls could be 1.3420 and the 100 simple moving average (red, 4-hour). If there is a close above 1.3420, the pair could rise toward the 1.3480 level.
Immediate support could be 1.3300. The first major support might be 1.3280. A close below 1.3280 could open the doors for a larger decline toward 1.3220. Any more losses might set the pace for a test of 1.3150.
Looking at EUR/USD, the pair found support near 1.1500, started a consolidation phase, and might soon attempt a recovery wave.
Upcoming Key Economic Events:
- US Existing Home Sales for May 2026 (MoM) - Forecast +0.1%, versus +0.2% previous.
Bitcoin Wave Analysis
Bitcoin: ⬆️ Buy
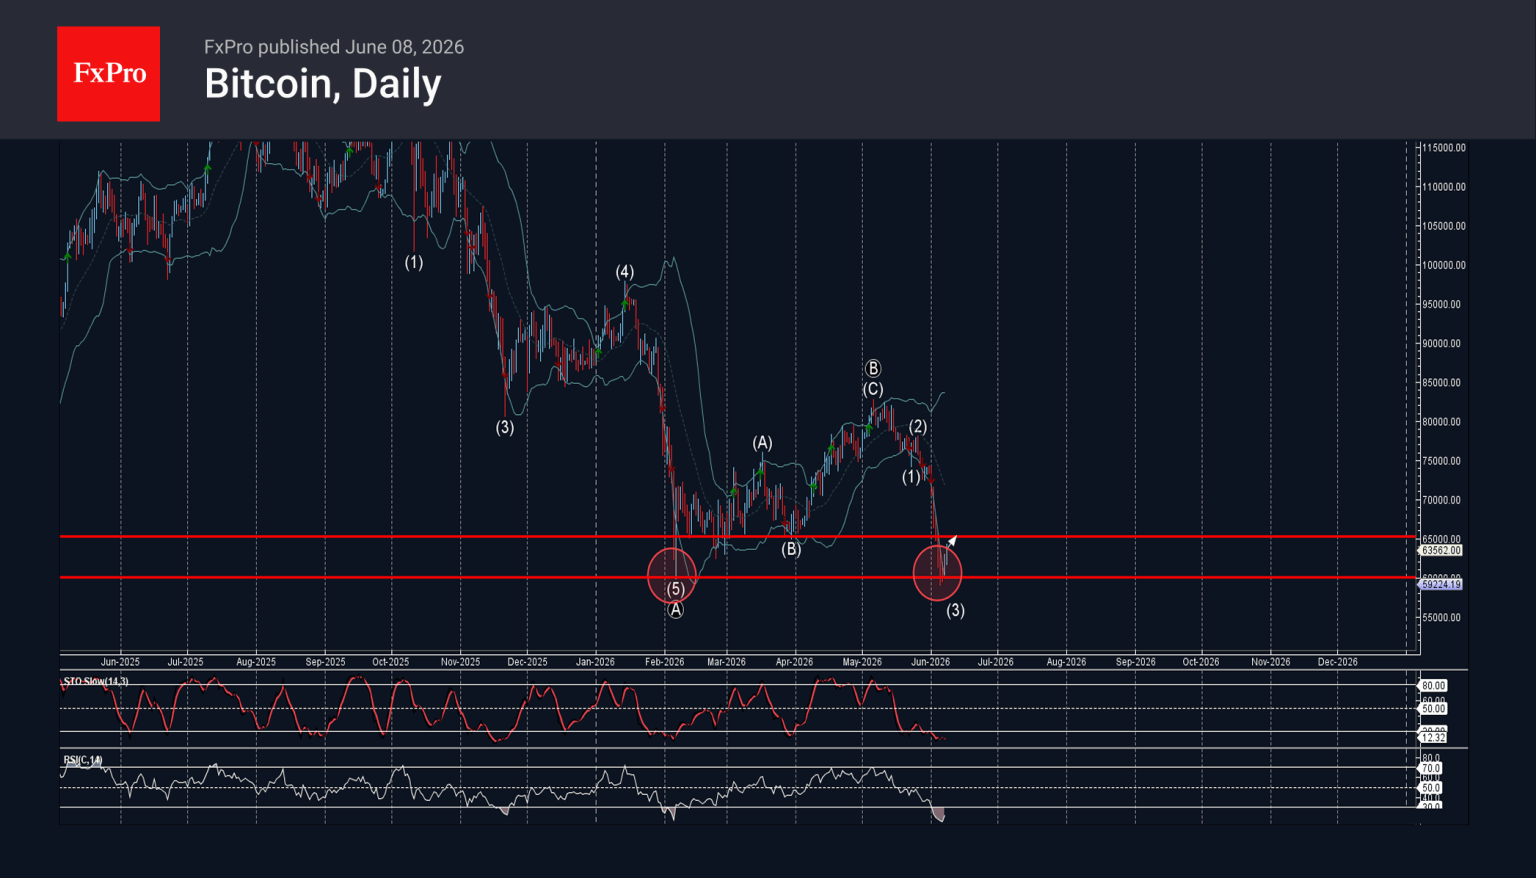
- Bitcoin reversed from powerful support level 60000.00
- Likely to rise to resistance level 65000.00
Bitcoin cryptocurrency recently reversed up from the powerful support level 60000.00 (which stopped the previous sharp downward impulse wave (A) at the star of February).
The support zone near the support level 60000.00 was strengthened by the lower daily Bollinger Band
Given the strength of the support level 60000.00 and the oversold daily Stochastic and RSI indicators, Bitcoin cryptocurrency can be expected to rise to the next resistance level 65000.00 (former support from March).
Eco Data 6/9/26
| GMT | Ccy | Events | Act | Cons | Prev | Rev |
|---|---|---|---|---|---|---|
| 22:45 | NZD | Manufacturingles Q1 | 2.80% | -0.50% | 0.80% | |
| 23:01 | GBP | BRC Like-For-Like Retail Sales Y/Y May | 3.40% | -3.40% | ||
| 23:50 | JPY | Money Supply M2+CD Y/Y May | 2.50% | 2.30% | ||
| 00:30 | AUD | Westpac Consumer Confidence Jun | -2.90% | 3.50% | ||
| 01:30 | AUD | NAB Business Confidence May | -14 | -24 | ||
| 01:30 | AUD | NAB Business Conditions May | 3 | 3 | ||
| 03:00 | CNY | Trade Balance (USD) May | 105.4B | 88.7B | 84.8B | |
| 06:00 | EUR | Germany Industrial Production M/M Apr | 0.40% | 0.50% | -0.70% | -0.10% |
| 06:00 | EUR | Germany Trade Balance (EUR) Apr | 14.5B | 15.4B | 14.3B | 14.7B |
| 10:00 | USD | NFIB Business Optimism Index May | 95.3 | 96 | 95.9 | |
| 12:30 | CAD | Trade Balance (CAD) Apr | 2.7B | 2.5B | 1.8B | |
| 12:30 | USD | Trade Balance (USD) Apr | -55.9B | -55.5B | -60.3B | -56.6B |
| 14:00 | USD | Existing Home Sales May | 4.17M | 4.05M | 4.02M |
| 22:45 | NZD |
| Manufacturingles Q1 | |
| Actual | 2.80% |
| Consensus | |
| Previous | -0.50% |
| Revised | 0.80% |
| 23:01 | GBP |
| BRC Like-For-Like Retail Sales Y/Y May | |
| Actual | 3.40% |
| Consensus | |
| Previous | -3.40% |
| 23:50 | JPY |
| Money Supply M2+CD Y/Y May | |
| Actual | 2.50% |
| Consensus | |
| Previous | 2.30% |
| 00:30 | AUD |
| Westpac Consumer Confidence Jun | |
| Actual | -2.90% |
| Consensus | |
| Previous | 3.50% |
| 01:30 | AUD |
| NAB Business Confidence May | |
| Actual | -14 |
| Consensus | |
| Previous | -24 |
| 01:30 | AUD |
| NAB Business Conditions May | |
| Actual | 3 |
| Consensus | |
| Previous | 3 |
| 03:00 | CNY |
| Trade Balance (USD) May | |
| Actual | 105.4B |
| Consensus | 88.7B |
| Previous | 84.8B |
| 06:00 | EUR |
| Germany Industrial Production M/M Apr | |
| Actual | 0.40% |
| Consensus | 0.50% |
| Previous | -0.70% |
| Revised | -0.10% |
| 06:00 | EUR |
| Germany Trade Balance (EUR) Apr | |
| Actual | 14.5B |
| Consensus | 15.4B |
| Previous | 14.3B |
| Revised | 14.7B |
| 10:00 | USD |
| NFIB Business Optimism Index May | |
| Actual | 95.3 |
| Consensus | 96 |
| Previous | 95.9 |
| 12:30 | CAD |
| Trade Balance (CAD) Apr | |
| Actual | 2.7B |
| Consensus | 2.5B |
| Previous | 1.8B |
| 12:30 | USD |
| Trade Balance (USD) Apr | |
| Actual | -55.9B |
| Consensus | -55.5B |
| Previous | -60.3B |
| Revised | -56.6B |
| 14:00 | USD |
| Existing Home Sales May | |
| Actual | 4.17M |
| Consensus | 4.05M |
| Previous | 4.02M |
BRENT OIL – Daily Cloud Base Came Under Increased Pressure Again After Short-Lived Recovery Attempts
Brent oil price jumped on Monday morning following an escalation in the Middle East (Israel attacked Iran’s energy infrastructure and Iran responded by a wave of attacks on Israel) but gains were short-lived, as the price fell on Iran’s announcement of an end to attacks that calmed the markets.
In addition, OPEC+ approved a fourth increase in oil output to stabilize oil markets that added pressure on prices.
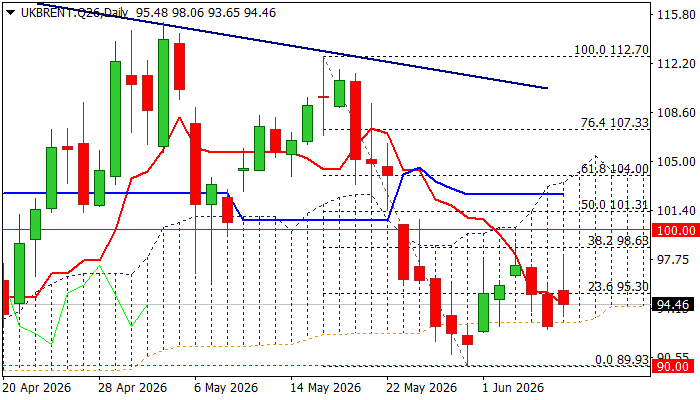
Brent price was down 4.5% on Thursday and Friday with strong fall being contained by daily Ichimoku cloud base ($93.14) which continues to provide solid support (probe below cloud base on May28 / June1 period resulted in a false break).
Daily studies remain predominantly bearish and contribute (in addition to weakening fundamentals) to scenario of renewed attack at cloud base, firm break of which to generate fresh bearish signal and open way towards $90 zone (psychological / May 29 low / 100DMA).
Near-term bias is expected to remain with bears while the price stays below significant barrier at $98.63 (Fibo 38.2% of $112.70/$89.93) which has so far capped two attempts and guards another important resistance at $100 (psychological).
Caution on potential repeated failure at cloud base that may keep near term action in extended sideways mode.
Res: 97.41; 98.63; 99.70; 100.00
Sup: 93.14; 91.76; 90.81; 89.93
Bank of England Preview – On Hold Amid Growing Policy Divide
- We expect the Bank of England on hold, but hawkish voices are growing louder.
- Data has come in on the soft side since the April meeting, but the inflation risks remain pronounced.
- Data releases ahead of the meeting could push more votes back in the hawkish camp but are not likely to change the hold decision.
Since the April meeting, data has supported our call for maintaining Bank Rate unchanged. That said, it remains too early to make any conclusions on inflation spillovers. We get fresh inflation and labour market data ahead of the meeting.
May PMI data suggest the economy came to a marked slowdown following a solid April print, as the service sector index took its steepest decline in four years. The manufacturing sector on the other hand remains quite solid with sustained growth in output and orders. Q1 growth was relatively high at 0.6%, although uncertainty on the seasonal pattern suggests momentum might be weaker. Retail sales reflected the deteriorating consumer sentiment in April with the biggest monthly decline in a year.
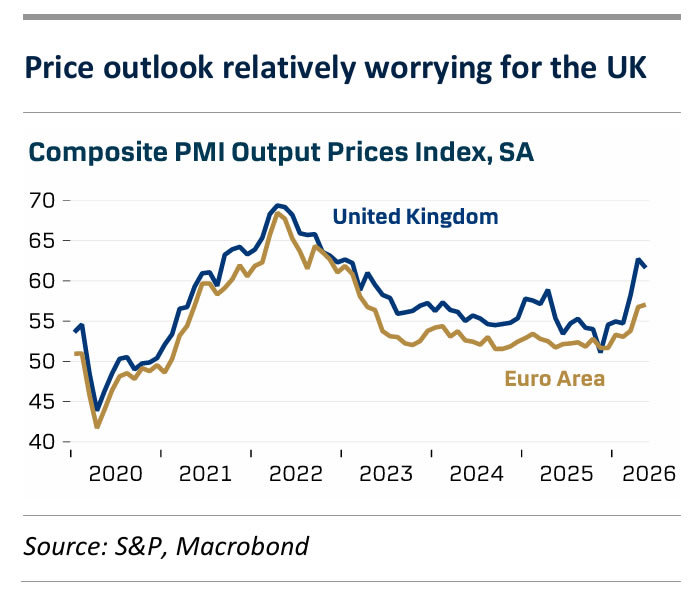
Job loss accelerated to -100K in April and the unemployment rate increased to 5.0%. At the same time, wage pressures remain on a weakening trend and according to the BoE decision maker panel (DMP), firms also expect slower wage growth going forward, which is key to the prospects of sustaining service inflation at acceptable levels. CPI inflation was lower than expected in April as core inflation continues lower. Producer prices, on the other hand, are on the rise and the PMI survey suggests businesses are raising prices, particularly in the manufacturing sector but also in service. Reported price increases are much steeper than in the euro area. According to the DMP, businesses largely expect compressed margins, though, suggesting more modest feed through of energy costs.
We continue to see Governor Bailey's stance as the key to pin down the policy outlook. His remarks have been mostly dovish leaning as he has argued that allowing inflation to run above target is justified given the uncertainty about the impact of the Iran war on the economy and the weak pace of growth. We could quickly be back in a situation with a completely split MPC with recent hawkish remarks not least from Meghan Greene, who is more worried about second round price effects than what the official BoE risk scenarios imply.
BoE call. Hiking rates will have to be weighed against a considerable risk of exacerbating a looming economic contraction. We think it is most likely the BoE will remain sidelined for the foreseeable future, but the vote split could soon be back where only a slim majority stands in the way of hiking rates.
Market reaction. We will keep a close eye on the updated views of MPC members and the vote split. The relatively weak UK growth outlook and our dovish stance on BoE compared to market pricing weighs on our GBP call. We forecast EUR/GBP to move higher towards 0.89 on a 6-12-month horizon.
Sunset Market Commentary
Markets
The Iran headline roulette has been doing overtime the past days. Over the weekend, it spit out news about fighting between Israel and Hezbollah which triggered retaliation by Iran against Israel and afterwards the other way around. The escalation prompted a complete ban by Houthis (part of the “axis of resistance”) on Israel in the Red Sea mainly by control over de Bab-el-Mandeb straight. Brent crude jumped from a $93/close last week to $98/b, before US president Trump stepped in. He claimed that he is calling all shots and that Israel and Iran would look for an immediate cease-fire. Later, both Israel and Iran declared an end to military operations which pulled the oil price back towards $94/b. However, Israel simultaneously indicated that it hasn’t reached its objectives towards dismantling Hezbollah suggesting that the risk of escalation remains extremely high. Intraday moves in oil prices drove action on other markets with core bonds yields initially adding up to 5 bps. As US trading gets going, changes on yield curves are negligible. EUR/USD tested the 1.15 big figure following Friday’s break below 1.16 before rebounding to 1.1544 as oil prices drop and Friday’s equity market correction didn’t continue after the opening bell. The EuroStoxx 50 started over 1% weaker following Friday’s heavy AI-correction, but is currently flat. US equities open up to 1.5% for the Nasdaq with investors apparently taking Nvidia CEO Jensen Huang’s advise to “buy the dip”. For the time being, we err on the side of a more profound correction especially if this week’s US inflation numbers (Wednesday) trigger more hawkish Fed repositioning bets. The US mid-month refinancing operation (3, 10, 30) is another risk factor. Today and tomorrow’s empty eco calendars nevertheless leave space for more headline-swings with the impact of Friday’s SpaceX IPO also added to the equation. They provide some kind of smoke screen to underlying economic developments.
News & Views
Czech industrial production and orders continued to grow slightly in April. Industrial production in real terms increased by 1.4% M/M and 1.5% Y/Y. The increase was driven by manufacturing of motor vehicles and their spare parts and by computer, electronics and optical products amongst others. A negative impact on production was registered from mining and quarrying, and repair and installation of equipment and in Food and beverages production. The value of new orders at current prices increased by 3.3% M/M and 2.7% Y/Y. New non-domestic orders increased by 3.5% Y/Y. Domestic new orders recorded an increase by 1.1%. The average registered number of employees in industry decreased by 1% Y/Y. At the same time, construction activity remained in strong April rising 0.6% M/M and 7.7% Y/Y. The number of building permits granted increased by 14.7% and the number of started dwellings even increased by 89.7% Y/Y.
In an interview with Reuters, National Bank of Hungary (MNB) deputy governor Kurali indicated that the central bank received better-than expected inflation data of late together with an improvement in risk premia. "As a result, potentially the required rate to achieve and maintain price stability might be lower.". At the same time, Kurali said that the prospect of major central banks (ECB, Fed, Bank of Japan) raising interest rates remains a reason for caution. As the MNB evaluates the potential trajectory of policy rates, it will have to uphold positive real rates to achieve and maintain price stability. Asked whether any easing would be a one-off or the start of a cycle, the deputy governor indicated that it's difficult to talk about cycles in this environment. Kurali also said that the MNB will launch a regular review of its 3% medium term inflation target in the summer as the government aims to meet euro adoption criteria by 2030. The review is said to examine the impact of a lower target closer to euro zone levels, and the strategy and timing for any change, which could come in one or two steps. The MNB expects this analysis to be fully prepared and discussed by autumn.
GOLD May Take a Breather Above Bear-Channel Support Line to Position for Fresh Push Lower
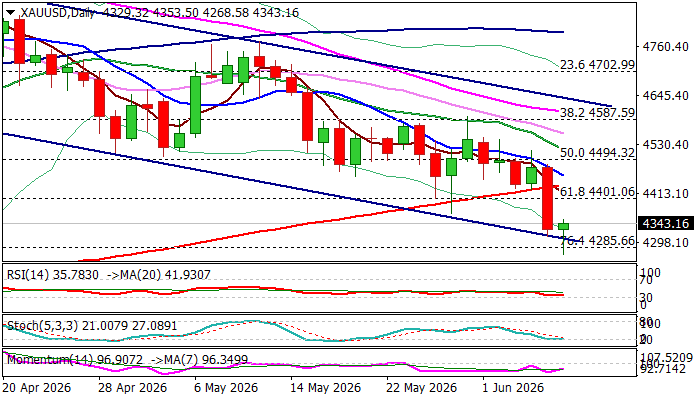
Gold remains firmly in red on Monday and hit 2 ½ month low on Monday, in extension of Friday’s 3.2% drop (the biggest daily loss since March 19).
Upbeat US May jobs data added to growing Fed rate hike expectations while fresh escalation in the Middle East fuels inflation.
Friday’s break of 200DMA (which recently contained several attacks) and Fibo support at $4401 (61.8% of $4099/$4889 upleg) generated strong bearish signal and opened way for today’s attack at bear-channel support line ($4305), where bears faced headwinds.
Near-term action may slow here, due to significance of support, as well as partial profit taking after Friday’s heavy losses.
Upticks are likely to be limited and provide better selling levels, as overall technical picture is bearish and strong post-NFP rise in bets for Fed rate hike fuels demand for dollar and keeps the yellow metal under pressure.
Broken 200DMA ($4432) offers solid resistance (as falling 10DMA is approaching and on track to form 10/200DMA death-cross) which should ideally cap upticks.
Firm break of bear-channel support line should further strengthen bearish structure for attack at key support at $4099 (2026 low, posted on Mar 23).
Only bounce above $4500 zone (former strong support, now resistance) would sideline bears.
Res: 4366; 4401; 4432; 4500
Sup: 4305; 4285; 4200; 4099
Nasdaq: The beginning of the Correction?
- Stock indices reacted negatively to the Fed’s rate hike.
- The dollar was once again boosted by escalating geopolitical tensions.
The US dollar has benefited from the escalating geopolitical situation in the Middle East, increased demand for safe-haven assets and an improvement in the US labour market. Employment growth of 172K in May and upward revisions to March and April figures point to temporary weakness at the end of 2025. As a result, the chances of a federal funds rate hike in 2026 have risen to 76%, and the probability of two or more hikes has jumped to 32%.
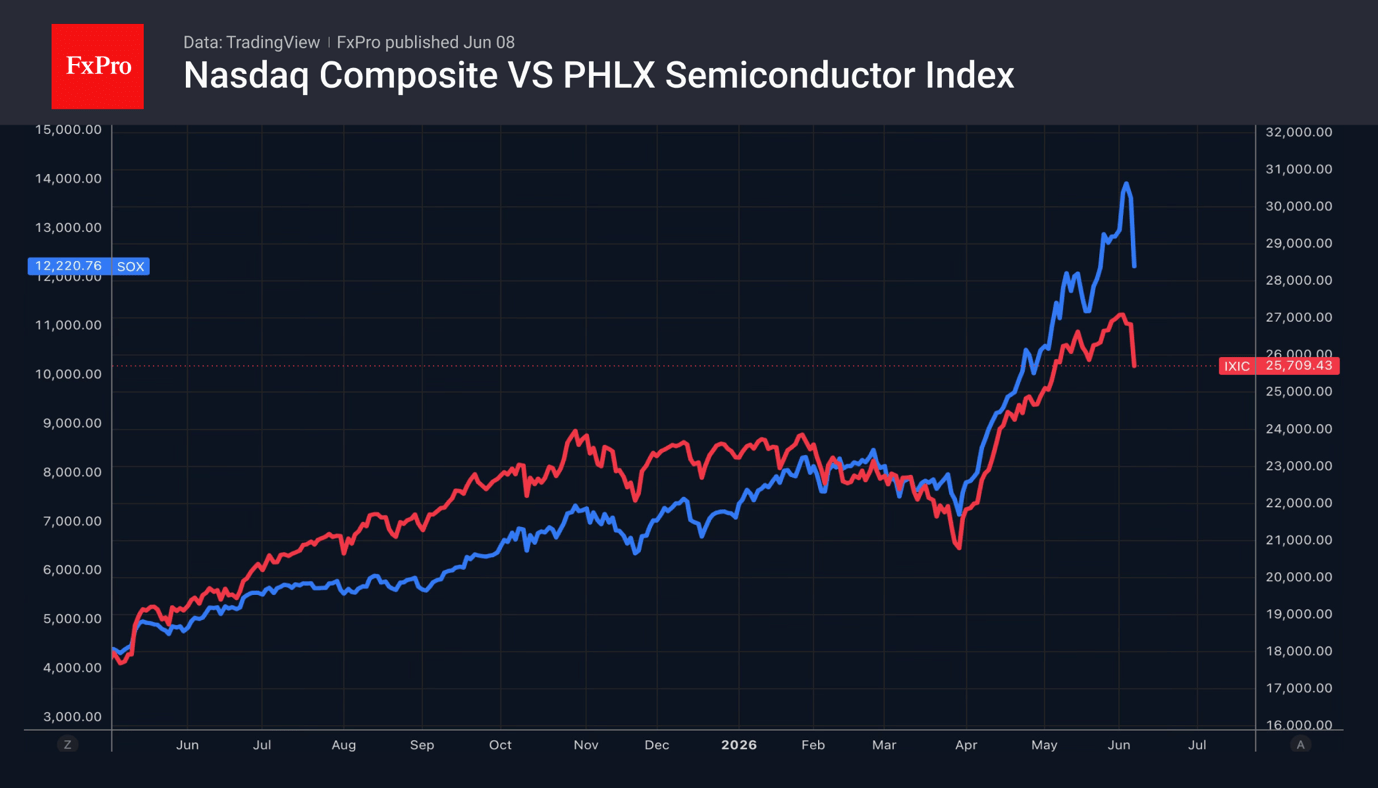
Stock indices fell sharply. The Nasdaq Composite recorded its worst weekly and daily decline in over a year. Yesterday’s leaders, chipmakers’ shares, were caught up in the wave of the most extensive sell-off. The market capitalisation of the Philadelphia Stock Exchange’s semiconductor index slumped by $1 trillion.
The rout in US shares drew criticism from Donald Trump. The US President stated that strong employment figures should have led to a rally in stock indices, not the opposite. Economic growth does not mean inflation. Investors are spooked by rumours of rate hikes, yet in reality, rates need to be cut.
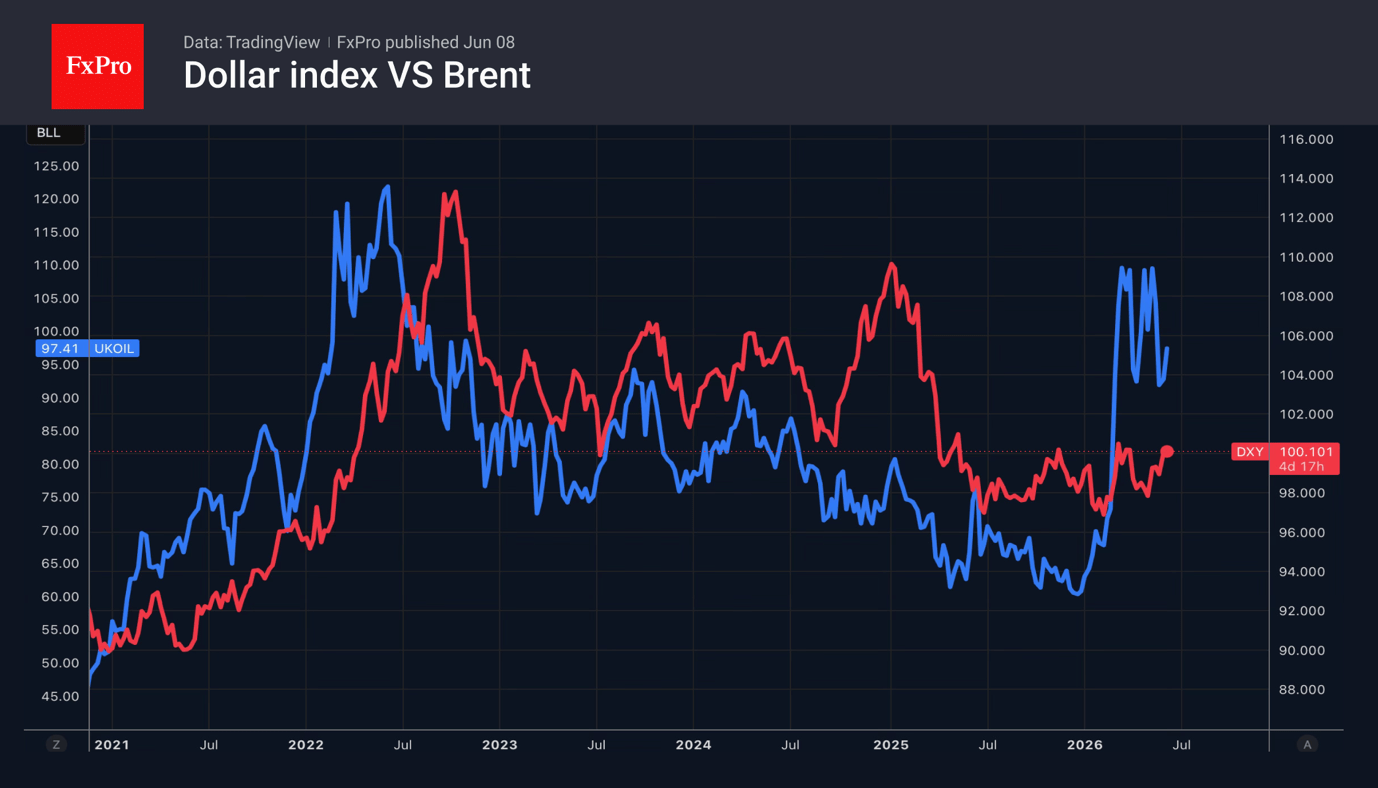
The slump in the Nasdaq Composite has dampened global risk appetite and boosted demand for the US dollar as a safe-haven asset. This is all the more so given that the exchange of strikes between Iran and Israel points to an escalation of the conflict in the Middle East. Brent opened the week with an upward gap, which supported the rally in the USD index. The US is a net energy exporter, so rising oil prices have a positive impact on its currency.
A strong jobs report allowed Goldman Sachs to abandon its forecast of a federal funds rate cut in December 2026 and March 2027. The timing of the anticipated monetary easing has been pushed back to June and December of next year.
Meanwhile, there is a growing conviction in the Forex market that any tightening of the ECB’s monetary policy would be a political mistake. Parallels are being drawn not only to the global economic crisis of 2008 but also to the events of 2011. In both cases, the weakness of the eurozone economy forced the central bank to cut rates after initially raising them.
If the Fed and the ECB raise borrowing costs once each in 2026, the interest rate differential will not narrow. This will provide support for the bears on EURUSD.
Markets Find Relief as Iran Ends First Wave of Strikes. But What About the Second?
Markets breathed a sigh of relief on Monday after Iran's military declared its first wave of attacks against Israel complete, helping Brent crude retreat from above $98 to below $95. Yet the pullback in oil may be telling only part of the story. While investors rushed back into risk assets, crude prices remain firmly above $90, suggesting traders are still demanding a substantial geopolitical risk premium.
The improvement in sentiment followed comments from Iran indicating that its latest military operation had concluded, while also warning that attacks could resume if Israel continued military actions in Lebanon. The absence of immediate escalation helped stabilize financial markets after a volatile start to the session. Commodity-linked currencies such as New Zealand Dollar and Australian Dollar outperformed, while safe havens including Dollar gave back some recent gains.
However, the broader geopolitical picture remains fragile. There has been no formal response from Israel, leaving open the possibility of further retaliation. Moreover, Iran's description of its operation as the "first wave" was notable. The wording appeared designed to signal that military capabilities remain intact and that additional strikes remain an option if circumstances change. Equally important, the current ceasefire framework is highly conditional rather than comprehensive, linking future restraint directly to developments in Lebanon.
For oil markets, these unresolved risks remain significant. If traders genuinely believed a durable de-escalation was underway, Brent would likely have surrendered a much larger portion of its recent gains. Instead, prices remain elevated above $90, indicating continued concerns over supply disruptions and regional instability. The retreat from $98 therefore looks more consistent with short-term profit taking than a wholesale removal of geopolitical risk premium. After all, the US and Iran are no closer to a peace deal than President Donald Trump claimed.
The implications extend well beyond energy markets. Elevated oil prices increase the likelihood that inflation pressures will continue filtering through the global economy over coming months. That dynamic has become increasingly important following last week's stronger-than-expected US nonfarm payrolls report, which reinforced the view that Fed has room to focus on inflation rather than labor market weakness.
As a result, investors are paying close attention to Wednesday's US CPI report. A further acceleration in inflation, particularly in the core measure, would strengthen expectations that Fed may need to tighten policy again later this year. Such an outcome could push Treasury yields and Dollar higher while renewing pressure on risk assets.
For now, market sentiment has stabilized. Yet the recovery rests on fragile foundations. Geopolitical tensions remain unresolved, oil prices remain elevated, and inflation risks continue to build. If US CPI surprises to the upside, the market's relief rally may prove as temporary as the latest ceasefire arrangement.
Eurozone Sentix Confidence Extends Recovery, but Inflation Concerns Stay Elevated
Eurozone investor confidence improved for a second consecutive month in June as concerns over a sharp economic slowdown continued to fade. Yet while global growth prospects have brightened, higher energy prices are keeping inflation pressures elevated, reinforcing expectations that ECB will maintain a vigilant stance at this week's meeting. Read More.
Gold's Downside Acceleration Points to Crucial $4,000 Battle Zone
Gold's selloff has accelerated as strong US economic data and rising oil-driven inflation risks push investors toward Dollar and Treasury markets. The next major battleground lies near $4,000, a level that could determine whether Gold remains in a bull market or enters a more significant downturn. Read More.
US CPI Leads High-Stakes Week as Fed Hike Expectations Build
Markets enter the week with one question dominating the outlook: has the oil shock become large enough to force central banks into a more aggressive stance? US CPI, ECB forecasts and the Bank of Canada decision could provide the answer, with major implications for rates, currencies and risk assets. Read More.
Japan Growth Downgraded to 1.8% as Capital Spending Weakens
Japan's economy grew more slowly than first reported in the first quarter as business investment unexpectedly contracted. While consumer spending, housing activity and exports were revised higher, the downgrade in capital expenditure suggests corporate confidence may not be keeping pace with broader economic recovery. The figures offer a mixed signal for markets assessing Japan's growth outlook and Bank of Japan normalization prospects. Read More.
EUR/JPY Daily Outlook
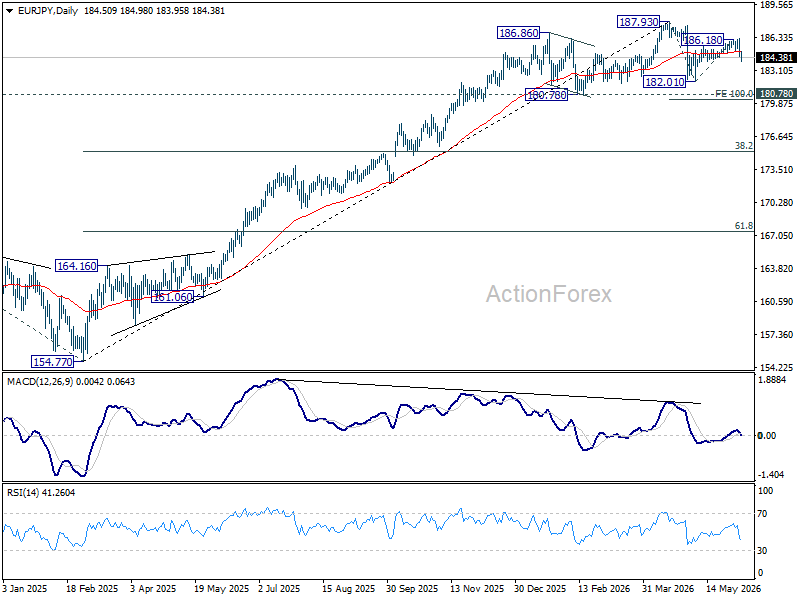
EUR/JPY's break of 184.42 support suggests that rebound from 182.01 has completed with three waves up to 186.18. Fall from there is seen as the third leg of the pattern from 187.93. Intraday bias is back on the downside for 182.01 support next. For now, risk will stay on the downside as long as 186.18 holds, in case of recovery.
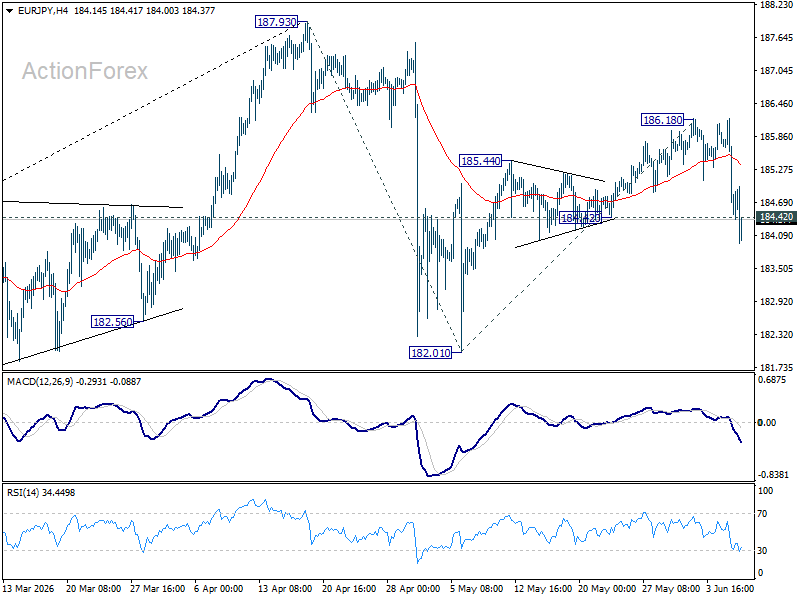
In the bigger picture, there is no sign of reversal yet. Uptrend from 114.42 (2020 low) is still expected to resume at a later stage to 78.6% projection of 124.37 (2022 low) to 175.41 (2025 high) from 154.77 at 194.88. However, sustained break of 55 W EMA (now at 178.95) will argue that it's already in a medium term down trend to 175.41 resistance turned support and below.
Will Bitcoin’s Historic $60K Support Hold?
Market Overview
The crypto market capitalisation has lost 12.5% over the past seven days. However, the sharp sell-off that began in June paused on Friday near the $2.05T level, and the market has now rebounded to $2.16T at the time of writing.
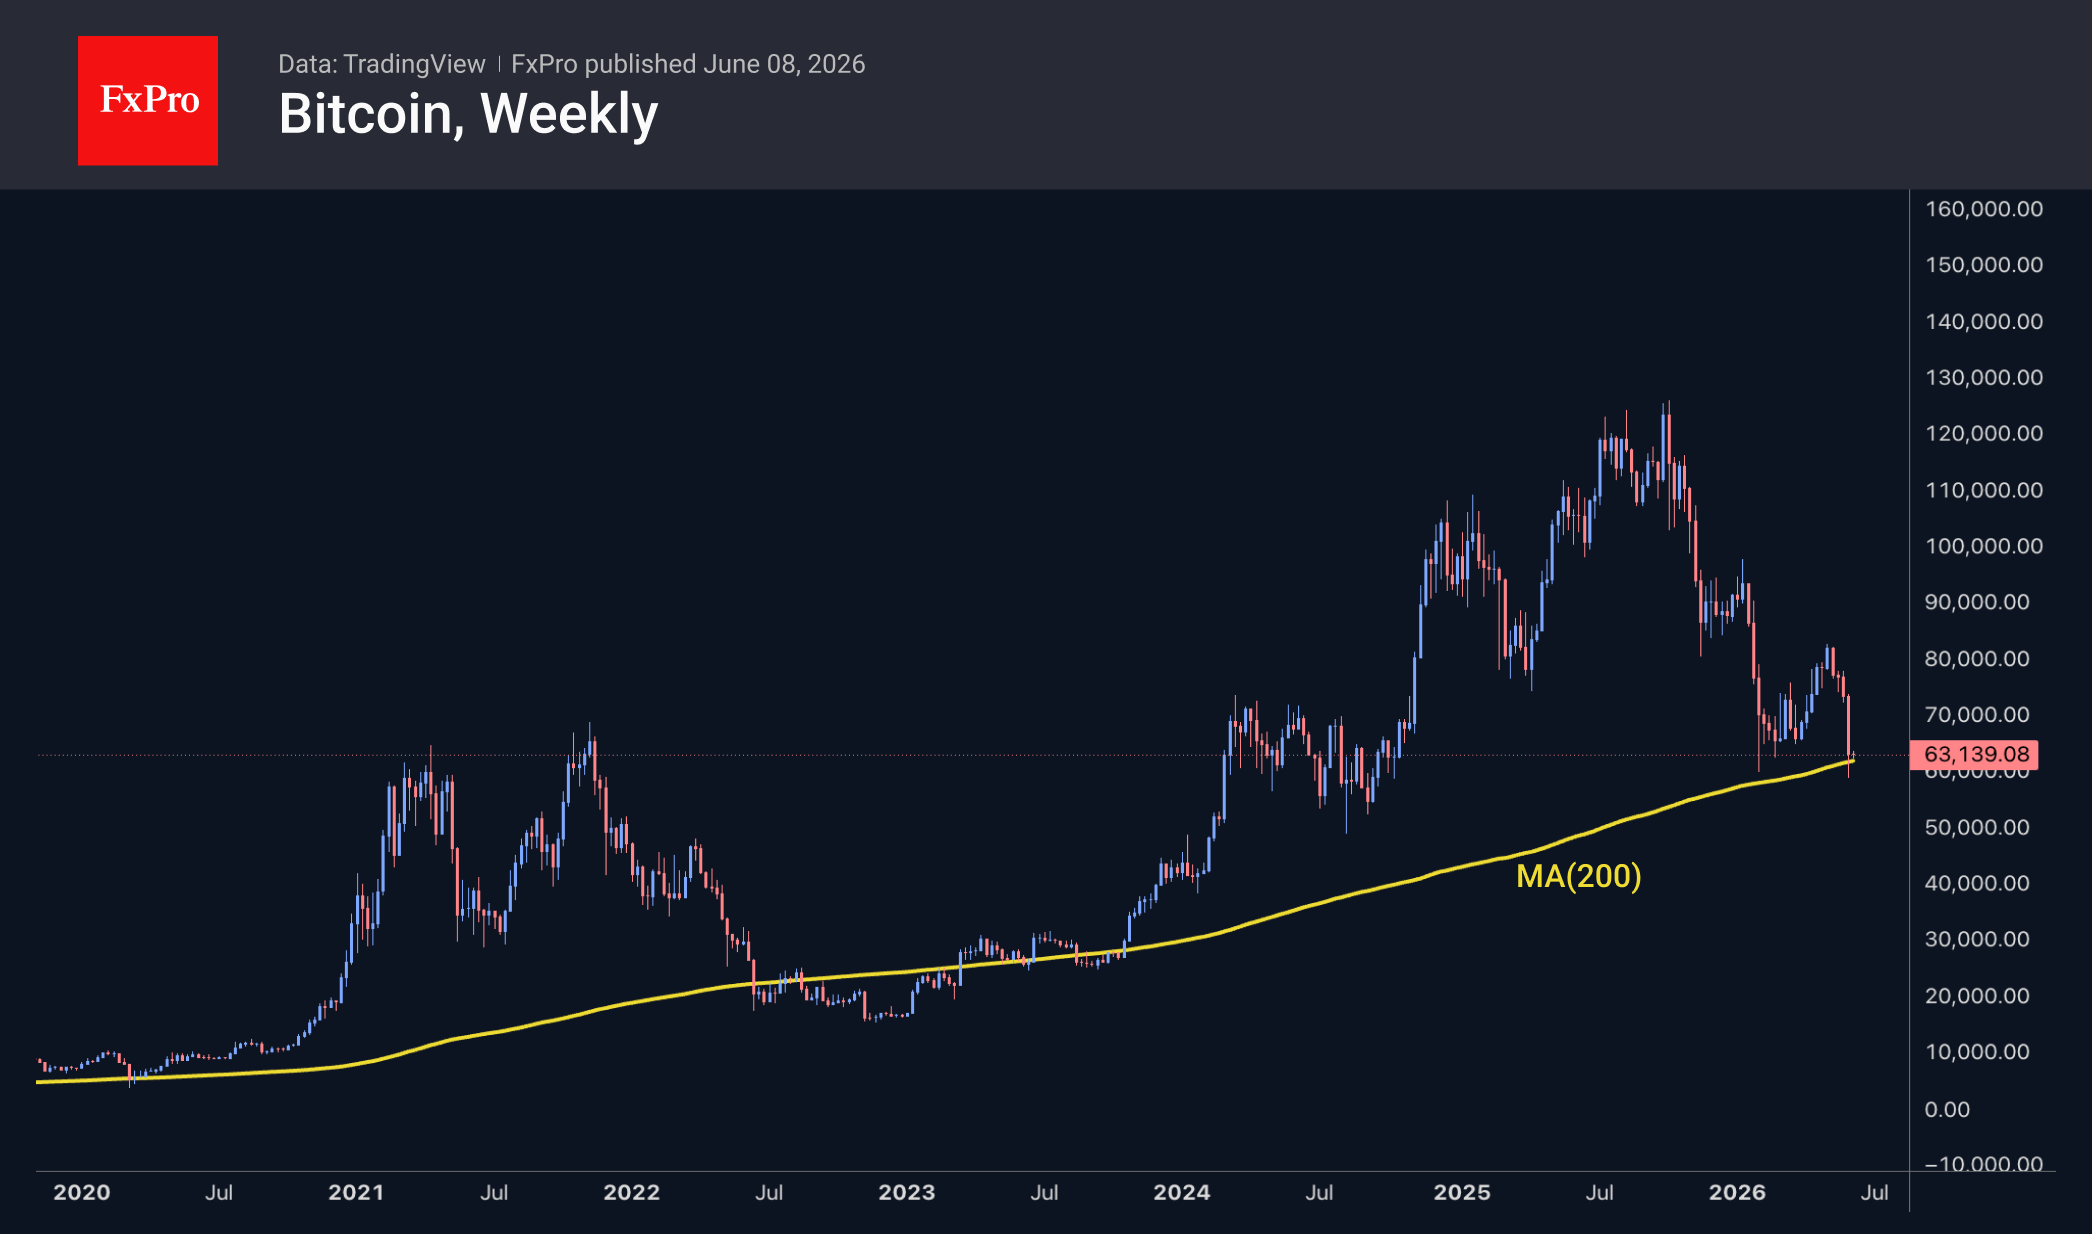
At the end of last week, Bitcoin fell below the 200-week moving average and the $60K round figure. At present, bulls are hopeful they have halted the decline below the historical support level that paused selloffs during the bear market of 2017–2020. Later, in 2022–2023, the price dipped as much as 30% below this line, but there was a clear increase in buying on dips. Clearly, optimists are trying to seize the chance to buy the leading cryptocurrency for less than half the price reached between July and October last year.
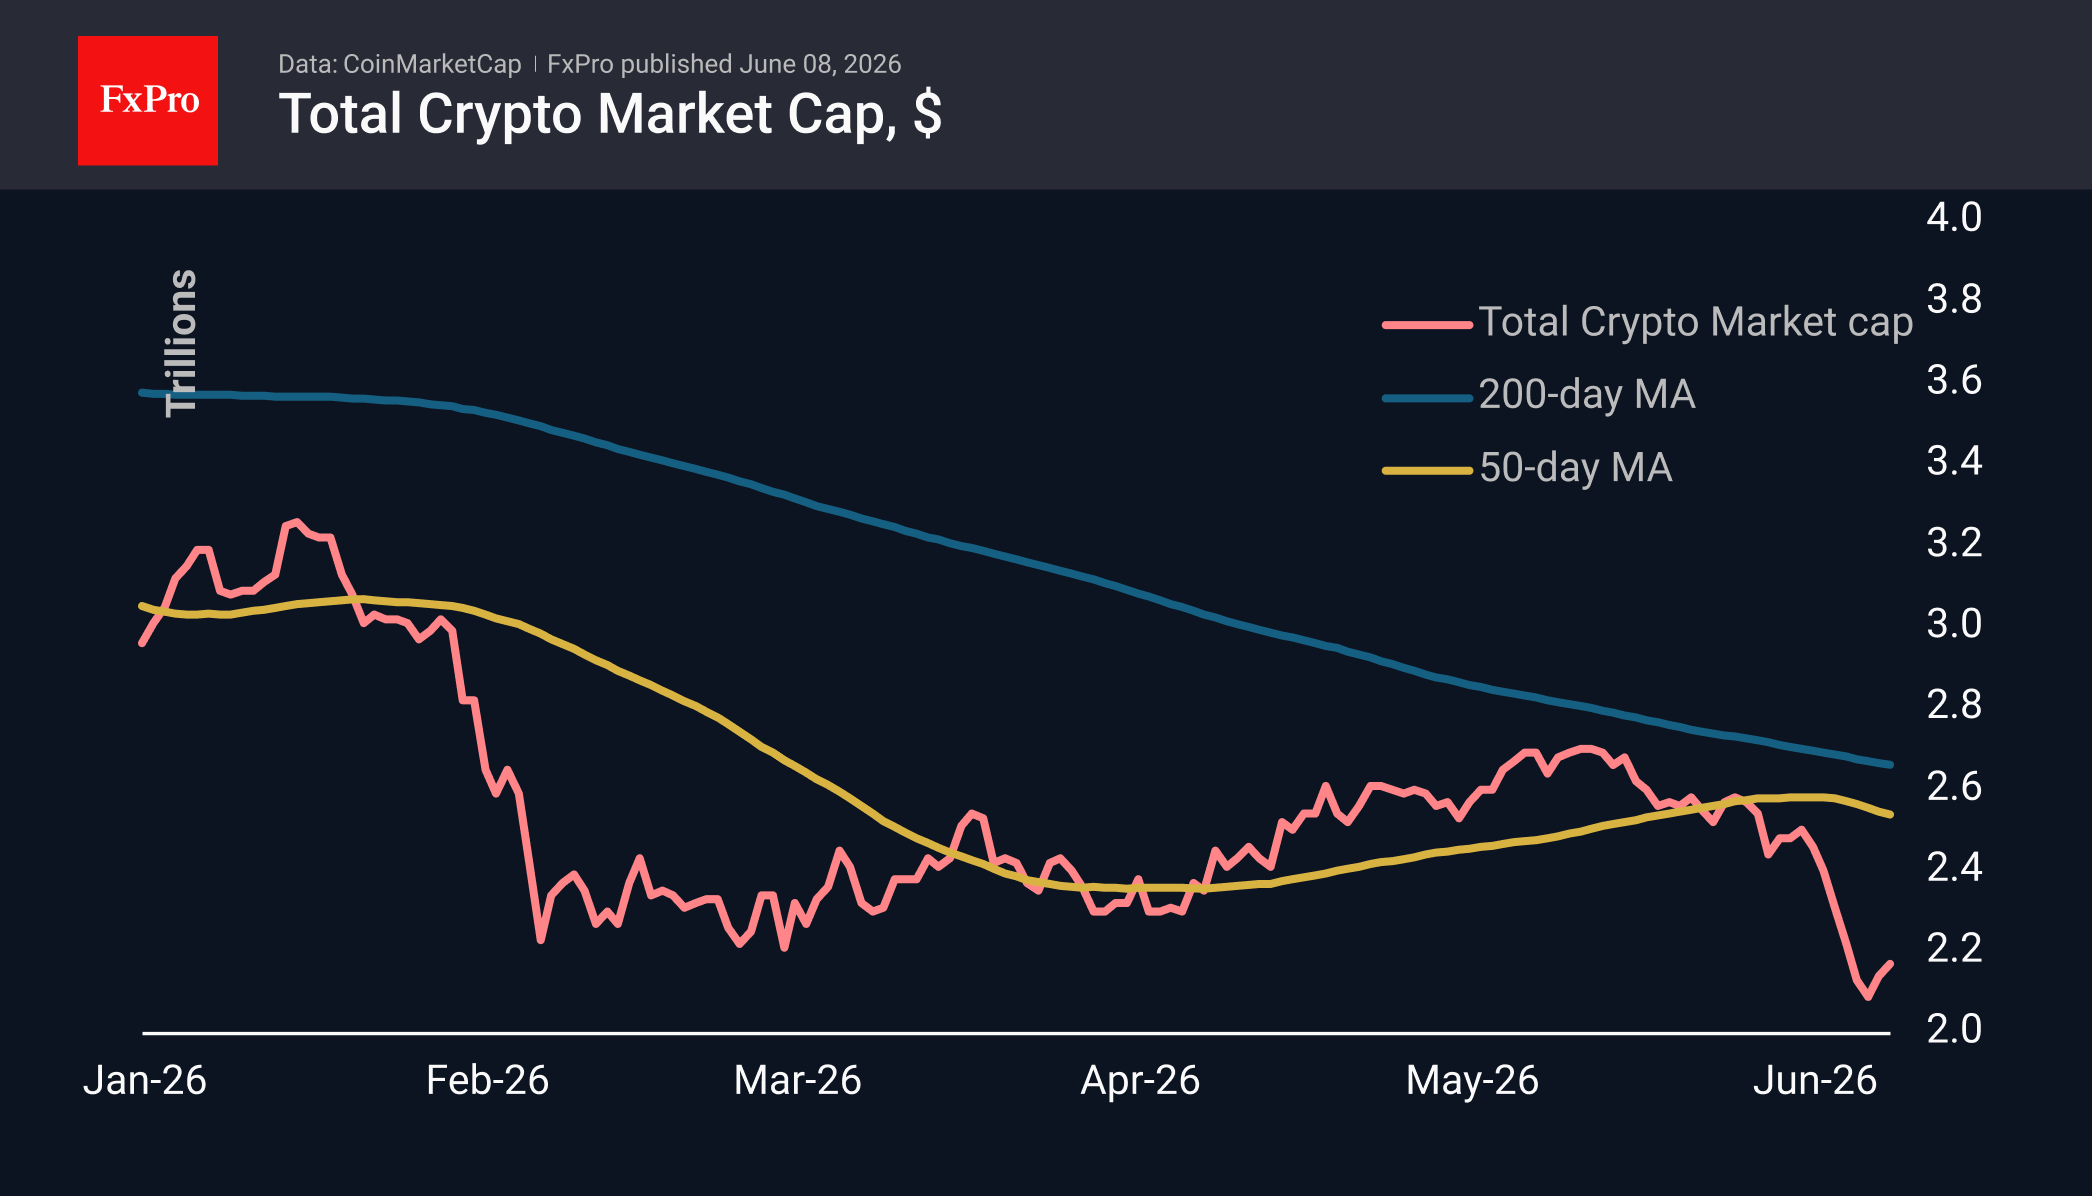
The sentiment index plummeted to 8, once again showing single-digit values on Monday, following a two-month hiatus and failed attempts to consolidate in positive territory. Judging by the dynamics near Bitcoin’s 200-week moving average and the sentiment index, the situation resembles mid-2022. Under similar conditions at that time, the downward momentum weakened, but a full-fledged reversal did not occur until many months later.
News Background
On Friday, Bitcoin fell below the $60K mark for the first time in 20 months amid a slump in US stock indices. The tech-heavy Nasdaq-100, which BTC often correlates with, plummeted by nearly 5% on Friday following the release of strong US labour market data.
Outflows from US spot Bitcoin ETFs have continued to accelerate for a fourth week, reaching a record $1.72 billion. Outflows from US spot Ethereum ETFs have persisted for four consecutive weeks. Net weekly outflows from ETH ETFs exceeded $170 million.
The crypto market is experiencing not just a crash, but a ‘loss of faith’ and a systemic crisis of the narratives on which it has been built over the last 10–15 years, according to Bloomberg. The notion of Bitcoin as a hedge against inflation has been called into question, and the arrival of institutional players has stripped the industry of its aura as a revolutionary technology.
The number of active addresses on the Bitcoin network has fallen to a seven-year low, notes Bitcoin Magazine. BTC user activity has been declining for several years due to intensifying competition from other layer-one networks used for payments with stablecoins.
The number of Bitcoin millionaires in dollar terms fell by 29% to 111,659 during Donald Trump’s second presidential term, according to figures from BitInfoCharts. This was largely due to a drop in BTC’s market value and does not necessarily reflect sales of the asset.
The privacy-focused cryptocurrency Zcash plummeted by 50% after a critical vulnerability was discovered, allowing fake coins to be created indefinitely and undetected. Zcash developers have fixed the vulnerability and claim that it was unlikely to have been exploited, as it was too complex to detect.