Sample Category Title
Chart Alert: SPX 500 Weak Market Breadth and Fed Rate Hike Fears Signal Further Downside Risk
Key Takeaways
- The S&P 500 faces growing downside risks amid deteriorating market breadth. Despite a sharp rebound in semiconductor stocks, only three of the eleven S&P 500 sectors advanced, highlighting narrow leadership and a lack of broad-based participation in the rally.
- Rising expectations of Fed rate hikes are tightening financial conditions. Following a stronger-than-expected US jobs report, markets are increasingly pricing in Fed rate hikes starting as early as October 2026, which could pressure valuations, particularly in AI infrastructure and semiconductor-related sectors.
- Technical indicators point to further near-term weakness. The S&P 500 remains capped below its 20-day moving average, while the NYSE Advance/Decline line has broken below key support and flashed a bearish divergence, suggesting underlying distribution rather than accumulation.
The S&P 500, one of the four major US benchmark stock indices, posted a 2.6% weekly decline, halting its 9-week streak of consecutive gains, and recorded its worst weekly performance since the week of 23 March 2026 during the depths of the US-Iran war.
The bulk of last week’s losses came on Friday, 5 June, ex-post US non-farm payrolls induced a plunge of 2.64%, reinforcing a tighter liquidity condition ahead as Fed funds futures traders start to position for a more hawkish US Federal Reserve.
Based on the latest data from the CME FedWatch tool as of 9 June 2026, the increased odds of 63% that the Fed may start to enact its first 25 basis points (bps) rate hike as soon as the October 2026 FOMC meeting and another hike of 25 bps (63% chance) to come in April next year.
This hawkish Fed funds rate repricing is likely to dampen the earlier optimistic revenue guidance reported during the first-quarter US earnings reporting session, especially in the AI-infrastructure and semiconductor sectors, in turn, triggering a negative feedback loop into the S&P 500.
Weak Market Breadth

Fig. 1: S&P 500 medium-term trend with cumulative AD line as of 8 Jun 2026 (Source: TradingView). The information presented is historical information, and past performance is not indicative of future performance.
The “buy-the-dip” behaviour seen in US semiconductor stocks on Monday, 8 June, when the PHLX Semiconductor index surged by 5.6% to lead the intraday recovery, could be a “bull trap” as market breadth was weak.
Out of the 11 S&P 500 sectors, only three of them managed to notch gains on Monday: Technology (+1.5%), Energy (+1.1%), and Consumer Discretionary (+0.5%).
Also, the cumulative Advance/Decline line of all stocks traded on the New York Stock Exchange (NYSE) has broken below a former medium-term ascending support after a bearish divergence condition, indicating a distribution pattern underneath rather than an accumulation after yesterday’s rally in US semiconductor stocks (see Fig. 1).
Let’s now decipher the short-term trajectories (1 to 3 days) of the SPX 500 CFD (a proxy of the S&P 500 E-mini futures).
Capped Below the 20-Day Moving Average
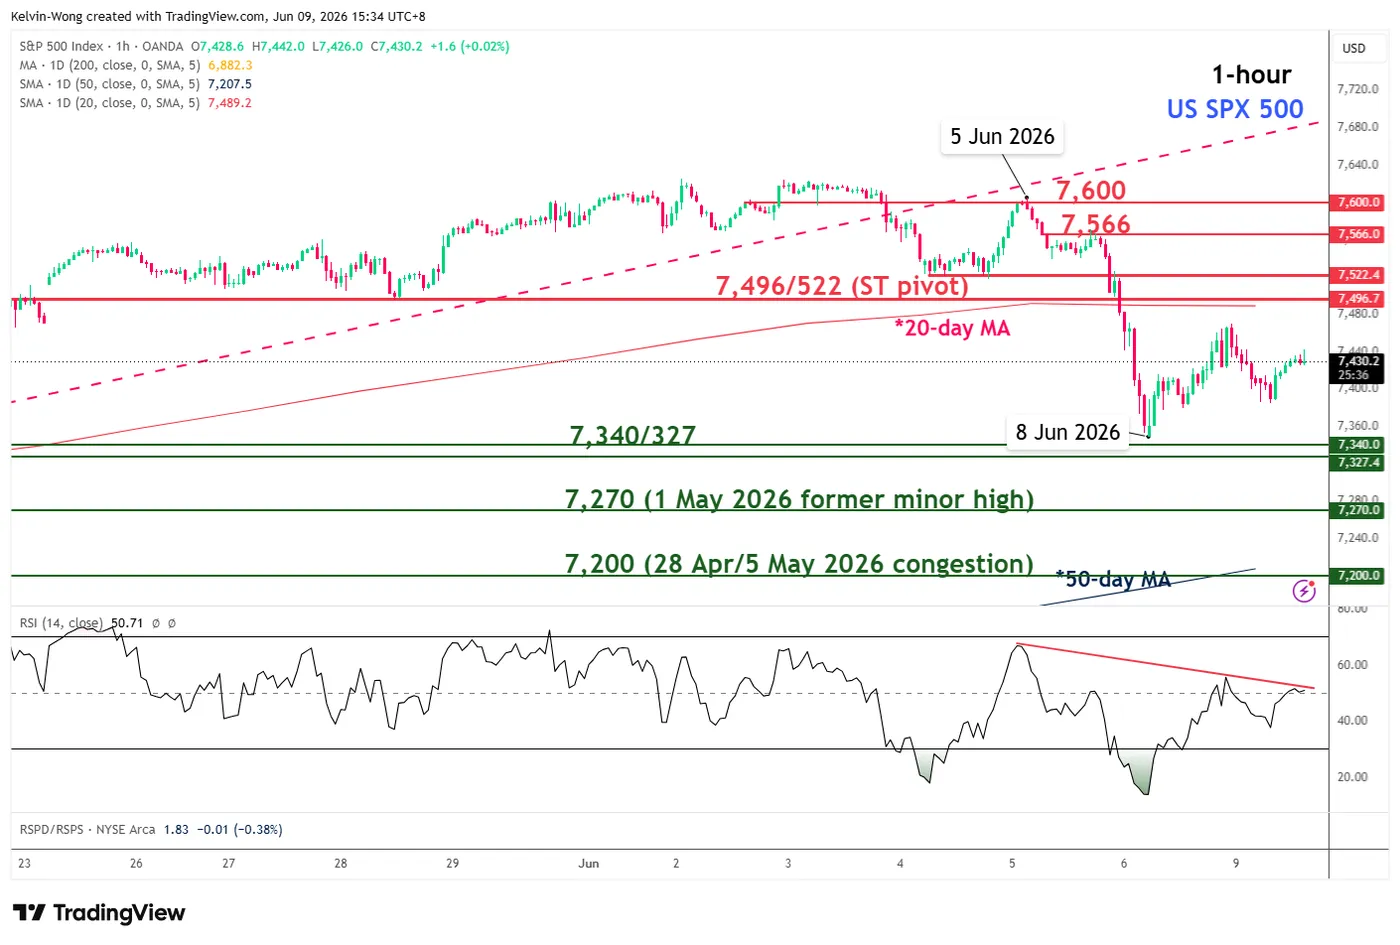
Fig. 2: US SPX 500 CFD minor trend as of 9 Jun 2026 (Source: TradingView). The information presented is historical information, and past performance is not indicative of future performance.
Trend bias: Bearish reversal of medium-term uptrend, 7,496/522 key short-term pivotal resistance (see Fig. 2).
Supports: 7,340/327 (8 May/19 May 2026 minor lows), 7,270 (1 May 2026 former minor high & Fibonacci extension), 7,200 (28 April/5 May 2026 congestion & Fibonacci extension).
Next resistances: 7,566 (5 June 2026 minor high), 7,600 (2/5 June 2026 congestion).
Key Elements to Support the Short-Term Bearish Bias on SPX 500 CFD
- Yesterday’s rebound stalled at around 50% Fibonacci retracement of the prior minor drop from the 5 June 2026 high to the 8 June 2026 low.
- Price actions remain below the 20-day moving average.
- The hourly RSI momentum indicator remains capped below a descending resistance at around the 50 level.
Dollar Gains Fresh Momentum: Market Assesses the Impact of the NFP Report
The US dollar strengthened against its major counterparts after the release of a robust US labour market report. Non-farm payrolls increased by 172K in May, well above the forecast of 85K, confirming the resilience of the US economy and reducing expectations of an imminent easing of monetary policy by the Federal Reserve. Additional support for the greenback comes from rising geopolitical tensions in the Middle East, which continue to boost demand for safe-haven assets.
Investors remain focused on developments in the conflict between Israel and Iran. Over the weekend, both sides exchanged large-scale strikes, leading to a further escalation of tensions in the region. The increase in geopolitical risks is contributing to persistent uncertainty across global financial markets and strengthening demand for the US dollar as a safe-haven currency. Against this backdrop, market attention is gradually shifting towards upcoming US economic releases, which are expected to either confirm or challenge the sustainability of the current bullish momentum in the dollar.
USD/CAD
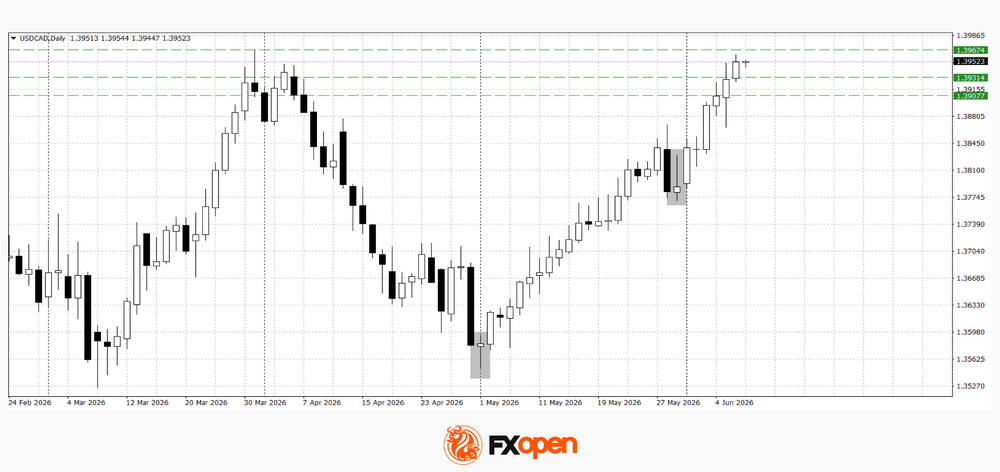
Previously identified reversal patterns in USD/CAD played out successfully, allowing buyers to test a key resistance level on the daily timeframe near 1.3960.
From a technical perspective, USD/CAD has approached a resistance zone formed at the end of March. Following the sharp rally, the market may enter a profit-taking phase, particularly if upcoming macroeconomic data fail to support further dollar strength. However, as long as the pair remains above nearby support levels, the upward momentum is likely to remain intact. A decisive break and close above 1.3960 could pave the way for further gains towards the 1.4000–1.4050 area.
Key events for USD/CAD:
- Today at 15:15 (GMT+3): US ADP Employment Change;
- Today at 15:30 (GMT+3): Canadian Trade Balance;
- Today at 17:00 (GMT+3): US Existing Home Sales.
USD/CHF
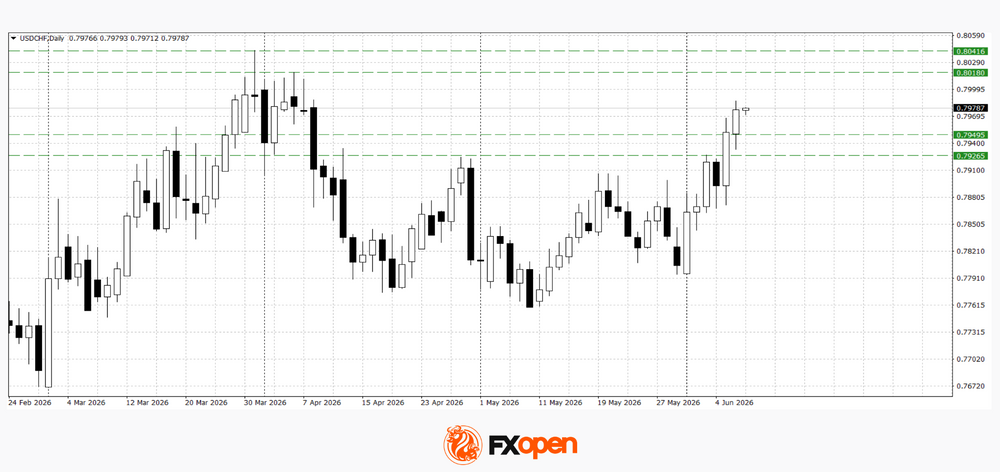
USD/CHF also received support from the strong NFP report and continues to advance towards this year's March highs in the 0.8020–0.8040 region.
Technical analysis of USD/CHF points to the possibility of a test of the nearest resistance levels at 0.8020–0.8040. Should a corrective decline begin, the pair may retreat towards the 0.7910–0.7940 area.
Key events for USD/CHF:
- Today at 18:30 (GMT+3): Atlanta Fed GDPNow estimate;
- Today at 19:00 (GMT+3): EIA Short-Term Energy Outlook;
- Tomorrow at 15:30 (GMT+3): US Consumer Price Index (CPI).
In summary, the strong employment report has reinforced the dollar's position and reduced expectations of near-term Federal Reserve policy easing. Geopolitical risks in the Middle East remain an additional supportive factor. At the same time, both USD/CAD and USD/CHF have already approached significant resistance levels, meaning that future price action will depend both on buyers' ability to establish a foothold above key thresholds and on the next round of US macroeconomic data.
Trade over 50 forex markets 24 hours a day with FXOpen. Take advantage of low commissions, deep liquidity, and spreads from 0.0 pips (additional fees may apply). Open your FXOpen account now or learn more about trading forex with FXOpen.
This article represents the opinion of the Companies operating under the FXOpen brand only. It is not to be construed as an offer, solicitation, or recommendation with respect to products and services provided by the Companies operating under the FXOpen brand, nor is it to be considered financial advice.
GBP/USD Remains Under Pressure Despite Attempts to Recover
GBP/USD attempted to move closer to 1.3350 on Tuesday but remained under pressure. The US dollar continues to benefit from strong US labour market data, which reinforced expectations that the Federal Reserve will maintain a restrictive monetary policy stance and could even consider further interest rate increases before the end of the year.
Developments in the Middle East provided additional support to the dollar. Following fresh Israeli strikes on targets in Iran, oil prices rose sharply, boosting demand for the US currency as a safe-haven asset. As a result, GBP/USD continues to trade near its lowest levels in almost two months.
Sentiment towards sterling has also been affected by changing interest rate expectations. While markets had previously anticipated a more aggressive tightening cycle from the Bank of England due to inflation risks, investors are now focusing increasingly on the prospect of higher rates in the US.
In addition, the latest Bank of England survey revealed a slowdown in inflation expectations among British businesses. This has reduced the likelihood of a near-term rate increase and added further pressure on the pound.
For now, the combination of a strong US dollar, elevated oil prices, and the Bank of England’s cautious stance continues to favour the US currency.
Technical Analysis
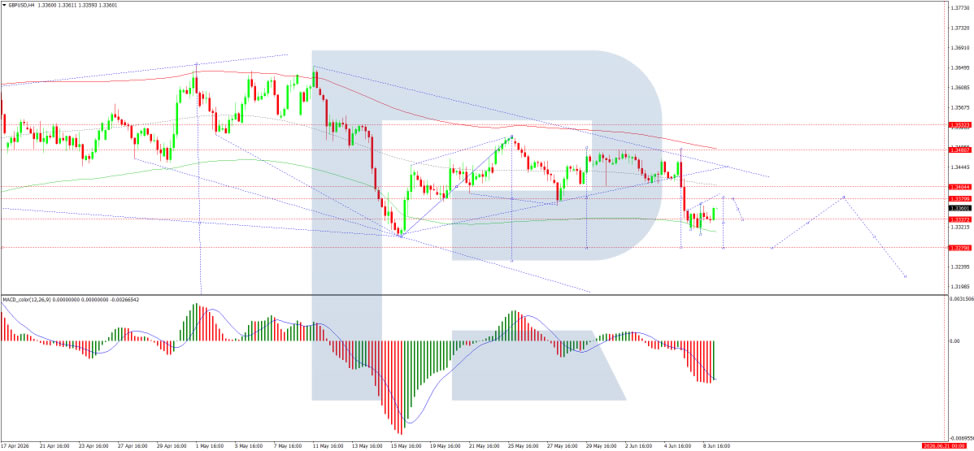
On the H4 chart, GBP/USD is trading within a broad consolidation range above the 1.3306 level. The range currently extends up to 1.3369 and down to 1.3329. A breakout above the range could open the way for further gains towards 1.3380, while a move below the range would increase the likelihood of a decline towards 1.3280.
The MACD indicator broadly supports this scenario. Although the signal line remains below zero, it is pointing upwards, suggesting that short-term recovery attempts remain possible.
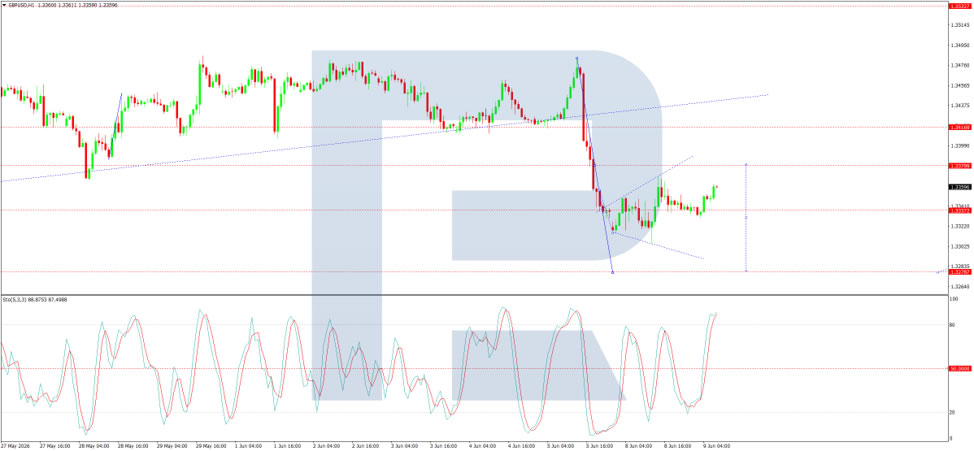
On the H1 chart, GBP/USD is trading within a narrower consolidation range around 1.3333, recently extending down to 1.3306. A move higher towards 1.3380 is expected in the near term.
The Stochastic oscillator supports the likelihood of short-term volatility. Its signal line is above 80 and turning sharply lower towards 20, indicating that a corrective pullback may develop before the next directional move.
Conclusion
GBP/USD remains vulnerable as strong US economic data, elevated energy prices, and shifting interest rate expectations continue to support the dollar. While technical indicators suggest that a short-term rebound is possible, the broader outlook remains challenging for sterling unless market sentiment towards the UK economy improves.
Sunrise Market Commentary
Markets
After the ‘positive shock’ of strong US payrolls on Friday, geopolitics in early post-weekend trade kept yields under upward pressure. An escalation in mutual military actions between Iran and Israel only illustrated the complex puzzle to reach (and maintain) a ceasefire/agreement in the regional conflict. Brent oil jumped from a Friday close near $93 p/b to test the $98 p/b area in European dealings. This caused US (and most other core yields) to easily hold the Friday rise. During the session, headlines on the Iran conflict again turned less aggressive as US president Trump called on both parties to halt the attacks. Oil retreated back to the $94 area. This also eased conditions on most other markets, but the rebound remained modest after all, probably as markets realized that any solution to regional supply chain disruptions remains very far away. In this context, there was little reason to reverse Friday’s payrolls-driven yield rise. US yields even added another 1.5 bps (2-y) to 4 bps (30-y), with the 2-y, 10-y and 30-y holding (well) north of the psychological barriers of respectively 4%, 4.5% and 5%. German yields rose between 1.4 bps (2-y) and 2.2 bps (10 & 30-y). After Friday’s sell-off, the Nasdaq ‘rebounded’ 0.86%, but this of course doesn’t erase Friday’s decline (-4.18%). Friday’s dollar rebound ran into resistance, but also here most of Friday’s gains were preserved. DXY still closed north of 100 (100.05). EUR/USD, after testing the 1.15 area closed near 1.1535. The cat-and-mouse game between Japanese authorities and the market on potential interventions keeps USD/JPY near the 160 barrier.
Most Asian equity indices are trading in green this morning, with the Kospi (+ 7.7% currently) outperforming after the sell-off end last week/yesterday. Oil eases back to $93 p/b. US yields decline marginally (-1 bp across the curve) as does the dollar (EUR/USD 1.1545). The eco calendar mostly contains ‘second tier’ data including US NFIB small business confidence, ADP weekly employment statistics and US trade data. Later in US dealings the US Treasury will start its monthly refinancing operation with a $58 bln sale of 3-y Notes. Aside from ‘headline risk’ related to the conflict in the Middle East, markets are looking forward to tomorrow’s US CPI. An upward surprise would probably reinforce Fed rate hike speculation. This also might become an additional supportive for the dollar and to some extent soften the link between the dollar and the oil price. In Hungary we keep an eye at the May inflation figures as they are important input for the National Bank of Hungary as it ponders the room for some gradual policy easing after recent improvement in domestic risk premia.
News & Views
• The NY Fed’s consumer survey had its one-year-ahead inflation gauge decrease by 0.1 ppt to 3.5% in May. Both the 3-yr and 5-yr horizons were unchanged at 3.1% and 3%. Expectations for future credit availability deteriorated, with a lower share of respondents expecting it will be easier to obtain credit in the year ahead. Perceptions of credit access compared to a year ago remained largely unchanged. When asked if they would lose their current job, 43.7% thought it probable to find a new one. That’s down 2.3 ppts, below the 12-month trailing average of 46.8% and the lowest since December 2025. The perceived probability of actually losing their job rose by 0.5 ppt to 15.1%, above the series’ 12-month trailing average of 14.4%.
Total retail sales in the UK increased by 3.7% in May, BRC data showed this morning. The biggest rise since April 2025 was much better than the 0.8% expected but came after a 3% slump in April. The BRC chief executive said that “May’s heatwave drove a surge in outdoor and summer goods. Clothing and footwear returned to growth as shoppers snapped up summer essentials like sandals and sunglasses. There was also roaring trade in fans, lighter bedding, and outdoor toys, and food sales were lifted by bank holiday barbecues.” Both food (3.9%) and non-food (3.5%) supported sales and both recovered from April. Same store sales rose by 3.4% after printing a same-sized drop the month before.
Risk Appetite Rebounds
In focus today
Markets continue to balance resilient US economic data against ongoing geopolitical uncertainty in the Middle East. Equity markets were mixed with weakness early in the day, while some indices rebounded as the day went on, especially in tech. Attention remains on upcoming inflation releases and the ECB meeting on Thursday, which are expected to provide further direction for markets.
In Denmark, foreign trade data for April will be released. In March, total exports of goods and services (seasonally adjusted) increased 8.1% m/m, while imports increased slightly by 3.7% m/m. Also today, industrial production will be released for April. We will follow the industrial production release closely, as it is one of the more reliable indicators for GDP growth in Denmark.
In the US, NFIB small business optimism index for May is released. The index has remained below its historical average of 98.0 for the past two months, with inflation pressures, labour costs and uncertainty being the key drags on sentiment.
Overnight, China releases PPI and CPI for May. We expect PPI inflation to increase from 2.8% y/y in April to around 4.5% y/y in May. It will underline that China is becoming an inflationary force after three years of exporting deflation. CPI inflation is expected to be broadly stable around 1.2% y/y as food inflation is pulling lower while energy inflation is moving up.
Economic and market news
What happened overnight
In China, export growth accelerated in May, with exports increasing 19.4% y/y (April: 14.1%, cons.: 15.0%), driven by strong demand for chips, autos and other AI‑related tech goods. The strength has helped to partly offset the impact of higher energy prices linked to the Iran war. Imports also surprised to the upside, increasing 27.4% y/y (April: 25.3%, cons.: 25.0%), signalling still-solid domestic demand.
What happened yesterday
In the Israel-Iran war, both countries halted direct military strikes on each other after an appeal from US President Trump, easing immediate fears of a broader regional escalation. Oil prices initially jumped on the renewed hostilities over the weekend before retreating once both sides signalled a halt to strikes. Brent crude is thus now trading close to the closing levels from Friday. The dollar also pulled back slightly from a near two‑month high as safe‑haven demand moderated following the de‑escalation.
In tech space, OpenAI has confidentially filed for a US IPO, joining rival Anthropic in seeking to tap strong investor demand for AI exposure. The company has not disclosed deal size, terms or timing, but Reuters reports it is targeting a valuation of up to USD 1 trillion, with a listing potentially as early as September. The move coincides with a planned SpaceX IPO on Friday, meaning OpenAI, Anthropic and SpaceX are all preparing market debuts, intensifying competition for investor capital.
In the euro area, the June Sentix investor confidence index increased to -13.4 (cons.: -14.6, prior: -16.4), reflecting a slight positive surprise. This marks a continuation of the recovery, supported by easing concerns about a significant economic slowdown, with strength in the US and Asia. However, the influence of rising interest rates and recent developments may not yet be fully reflected in investor sentiment.
In Germany, factory orders fell -3.8% m/m in April (cons: -2% m/m), reversing a revised 4.5% gain in March. The drop was broad-based, reflecting weakness in both domestic and foreign demand. Firms are believed to have brought orders forward in March due to concerns over rising costs and supply disruptions, leading to the decline in April.
Equities: Equity markets fell yesterday, but the moves were highly uneven. The Far East dragged the global market lower, while the US rebounded, in many ways reversing what we saw on Friday. In the US, most major indices ended higher, but the advance was driven mainly by technology and partly by energy, while most sectors were actually lower on the day. At the headline level, the two dominant themes remain the AI buildout and news around Iran, with the associated rise in oil prices also moving markets yesterday. This morning, Asia is catching up with the US moves from last night. Several of the more technology heavy markets, including South Korea, are reversing yesterday's losses and are sharply higher. European futures are slightly lower, while US futures are higher, again led by technology futures.
FI and FX: EUR/USD started off the week by printing a new two-month low whilst briefly touching 1.1500, before retracing marginally higher through the session. Global yields saw V-shaped action over yesterday's session, with swap curves steepening modestly. After an elevated opening, Brent crude edged lower throughout the day and closed below USD95/bbl. The Norwegian krona underperformed peers, likely related to the price action in the oil market, whereas the neighbouring SEK positioned itself as today's winner within G10 FX, with EUR/SEK closing below 10.90.
Dip Buyers Spark Tech Rebound on Weak Market Breadth
Key Takeaways
- Technology stocks staged a strong rebound, led by semiconductor shares such as Intel and Micron, helping the Nasdaq 100 recover 1.6% despite weak overall market breadth and continued pressure on non-tech sectors.
- Middle East tensions remain a key market driver, but a temporary Israel-Iran ceasefire helped cap oil price gains, reducing immediate inflation fears and supporting risk sentiment.
- Investors remain focused on higher interest rates and liquidity risks in mega-IPOs, with Treasury yields remaining elevated as upcoming listings such as SpaceX continue to raise questions about capital allocation across global equity markets.
- Chart of the day: AUD/USD’s rebound from Monday looks like a “dead cat bounce”. Watch the 0.7085/710 key short-term resistance.
Chart of the Day - AUD/USD Struggled Below 20-Day and 50-Day Moving Averages
Fig. 1: AUD/USD minor trend as of 9 Jun 2026 (Source: TradingView). The information presented is historical information, and past performance is not indicative of future performance.
The 0.7% rebound in AUD/USD from Monday’s Asian session intraday low of 0.7024 has been lacklustre. The hourly RSI momentum indicator has been capped below its descending resistance at around 58 (see Fig. 1).
These observations warrant caution that Monday’s rebound may be a “dead cat bounce” within a bearish structure that has been unfolding since the bearish break below the 50-day moving average on last Friday, 5 June 2026.
Watch the 0.7085/7100 key short-term pivotal resistance; a break below 0.7024 near-term support opens scope for potential weakness towards the next immediate supports at 0.7008/0.6995 and 0.6960/6945.
On the flipside, a clearance with an hourly close above 0.7100 invalidates the bearish tone and opens the door to a squeeze up to retest the 20-day and 50-day moving averages, which converge at the next intermediate resistance of 0.7120 and 0.7153.
Top Macro Headlines
- Dip buyers unleash historic chip rally: Following a brutal selloff that saw global tech benchmarks routed late last week, dip buyers returned to Wall Street in force. The Nasdaq 100 rallied 1.6%, and the S&P 500 jumped 0.3% to close above 7,405, powered by a massive 5.6% to 6.5% resurgence of semiconductor giants like Micron Technology and Intel Corp. In contrast, the Dow Jones Industrial Average underperformed, losing 0.2%.
- Trump ceasefire call caps geopolitical oil surge: Crude oil sharply pared its early 4% weekend gains after a tenuous, temporary ceasefire was brokered between Israel and Iran. While Israel hit petrochemical targets in southwestern Iran over the weekend, Reuters reported that both sides subsequently lifted flight and movement restrictions, signalling a tentative pause in direct hostilities.
- SpaceX counts down to historic $75 Billion IPO: Elon Musk’s SpaceX is moving ahead with plans to raise $75 billion by offering 555.6 million shares at a fixed price of $135 per share. The historic listing, scheduled for this Friday, skips typical bookbuilding price ranges due to massive pre-IPO institutional demand, commanding a fully diluted valuation of $1.77 trillion.
- Fed hike fears soften on wage metrics: While a massive 172,000 nonfarm payroll expansion on Friday initially stoked hawkish monetary fears, institutional desks spent the session reassessing the data. Wall Street sentiment turned positive as analysts noted a cooling trend in underlying wage growth, prompting banks to downplay the imminent risk of an October Fed rate hike.
- 'Sell Indonesia’ sweeps regional trading desks: Concerns over interventionist economic management and confusion regarding new commodity export rules have sent Indonesian assets into a spiral. Just five months after hitting a record high, the benchmark Jakarta stock index plunged, bringing its total decline to 36% and making it the worst-performing global index in 2026, while the rupiah collapsed to a new low of 18,180 against the dollar.
Key Macro Themes
- A healthy reset in crowded tech allocations: Wall Street’s leading strategists messaged that last week’s deep pullback was an essential positioning reset rather than a structural market top. Citigroup aggressively raised its year-end S&P 500 target to 8,100 (a gain of around 9% from Monday’s S&P 500 closing level of 7.405), citing a significant step-up in corporate earnings power that will absorb upcoming mega-cap tech issuance, such as SpaceX and Anthropic.
- Cool reception for conceptual AI updates: Despite the broader chip sector’s explosive rebound, consumer tech companies bucked the trend. Apple Inc. shares slid 1.9% after investors gave a decidedly cool reception to the firm’s showcase of its next-generation AI platform, underscoring that markets are increasingly demanding immediate, quantifiable monetisation over product updates.
- Sovereign debt yield resurgence: As geopolitical alarms shifted to a low simmer in the Middle East, the safe-haven premium began draining from global bonds. Fixed-income yields remained anchored near multi-month highs, with global allocators bracing for massive upcoming government note auctions amid a structurally higher cost of capital.
Global Markets Impact (Last 24 Hours)
Equities: The S&P 500 climbed 0.3% to settle at 7,405.73, and the Nasdaq 100 jumped 1.6%. But market breadth was weak, with only 3 of the 11 S&P 500 sectors recording gains: Technology (+1.5%), Energy (+1.1%), and Consumer Discretionary (+0.5 %). In Europe, the Stoxx 600 edged down 0.1% due to its lower semiconductor weighting.
Fixed Income: Yields pressed higher on hawkish central bank expectations. The US 10-year Treasury yield advanced to settle near 4.57%. Germany’s 10-year Bund yield ticked up to 3.06%, and the UK’s 10-year Gilt yield rose four basis points to 4.94%.
FX: The US Dollar Index lost its safe-haven traction, falling slightly by 0.1%. The euro caught a minor bid, hovering at $1.1538, while the British pound rested at $1.3350. The Japanese yen stabilised at around 160.20 per dollar.
Commodities: WTI crude finished up 1% on Monday to trade near $91.27/bbl, and Brent crude rose to trade near $94.10/bbl, both closing well below their early peaks. Spot gold clawed back a modest 0.05% to trade at $4,330/oz, hovering just above a near-term support of $4,250/oz.
Asia Pacific Impact
- Stock markets under pressure: Before the New York tech rebound materialised, regional indices bore the brunt of global tech contagion. South Korea’s KOSPI index was severely damaged, falling by a staggering 5.5% on Friday as options market liquidations triggered a deep regional equity-clearing event. In today’s Asia opening session, technical rebounds have materialised, Nikkei 225 (+3.6%), KOSPI (+3.6%), CSI 300 (+0.3%), and STI (+0.9%).
- Rupiah trapped in historic lows: The Indonesian rupiah weakened about 7% year-to-date, making it one of the worst-performing currencies in Asia in 2026, and fell further to a low of 18,180 against the US dollar, forcing emergency central bank smoothing interventions.
- BOJ intervention floor monitored: The Japanese yen remains deeply pinned against the greenback at around 160.20. The Bank of Japan remains on maximum alert for direct spot-market intervention as wide yield differentials continue to structurally favour the U.S. dollar.
Top 3 Events to Watch Today
- Germany Balance of Trade (Apr) - 2.00 pm SGT
Impact: EUR/USD, EUR crosses, DAX - US Existing Home Sales (May) - 10.00 pm SGT (consensus: 4.06M, Apr: 4.02M)
Impact: USD, US stock indices - ECB President Lagarde Speech - 10 Jun, 12.30 am SGT
Impact: EUR/USD, EUR crosses
China Exports Surge 19.4% as US Trade Truce and Tech Demand Fuel Growth
China's trade sector delivered strong performance in May, with exports rising from 14.1% to 19.4% yoy in US dollar terms, beating expectations of 15%. Imports also accelerated from 25.3% to 27.4%, exceeding forecasts and pointing to continued strength in both external and domestic demand. As a result, China's trade surplus widened sharply from USD 84.8B to USD 105.43B, well above the expected USD 88.7B.
A key driver was the continued recovery in trade with the United States following the tariff truce reached last October. Exports to the US surged 35.4% from a year earlier, marking the strongest growth since March 2021, while imports from the US rose 20%. The rebound suggests trade flows have normalized significantly compared with last year's tariff-war disruptions, providing an important boost to China's manufacturing sector.
Technology exports were a standout performer. Shipments of automated data processing equipment surged 66.1% year-on-year, while exports of high-tech products rose 50.9%. Automobile exports also maintained strong momentum, increasing 39%. These figures highlight China's growing competitiveness in higher-value manufacturing sectors and suggest global demand for technology-related products remains resilient despite concerns over slowing economic growth in major markets.
Regional trade data also pointed to strengthening supply-chain activity across Asia. Exports to Southeast Asia rose 24.3%, while imports from the region climbed 28.2%. Imports from South Korea jumped 84% to a record USD 26.7B, making it China's largest import source among major trading partners. The strong rise in intermediate-goods imports suggests Chinese manufacturers are ramping up production to meet both domestic and overseas demand.
| Indicator | April | May | Forecast |
|---|---|---|---|
| Exports Y/Y | 14.1% | 19.4% | 15.0% |
| Imports Y/Y | 25.3% | 27.4% | 25.0% |
| Trade Surplus USD | 84.8B | 105.43B | 88.7B |
| Trade Flow | May Growth Y/Y |
|---|---|
| Exports to US | 35.4% |
| Imports from US | 20.0% |
| Exports to Southeast Asia | 24.3% |
| Imports from Southeast Asia | 28.2% |
| Exports to EU (May) | 7.6% |
| Imports from EU (May) | -1.3% |
Silver’s $70 Breakdown May Have Changed Everything
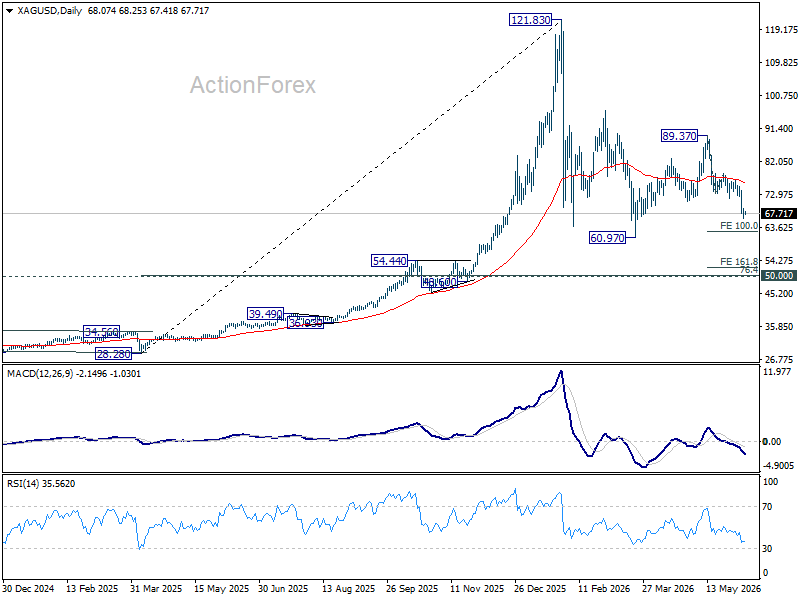
Silver's sharp decline this week is about more than rising Fed hike expectations. By breaking decisively below the key $70 level, the metal may have altered one of the market's most widely accepted assumptions. What was previously viewed as a structural floor supported by supply deficits and industrial demand is now at risk of becoming a ceiling.
Like Gold, Silver has come under pressure as investors aggressively reprice the US interest-rate outlook following last week's stronger-than-expected nonfarm payrolls report. A stronger Dollar and growing expectations that Fed may need to tighten policy further have reduced the appeal of precious metals. However, Silver's decline carries broader implications because it occupies a unique position as both a monetary and industrial metal.
The bullish case for Silver rested on two pillars. First, persistent supply deficits were expected to keep physical markets tight. Second, robust industrial demand from sectors such as solar energy and AI-related technologies was seen as providing a durable foundation for prices. Together, these factors fostered a belief that Silver would find strong support around the $70 area even during periods of macroeconomic weakness.
The decisive break below that level now challenges that narrative. Markets can tolerate corrections. What changes sentiment is when a level widely viewed as structural support stops functioning as support. As a result, attention is shifting away from whether Silver can bounce and toward whether it can reclaim the lost ground.
The next phase may prove particularly important from an institutional perspective. In technical analysis, major support levels often undergo a polarity flip after breaking, transforming from floors into ceilings. That process becomes especially significant when large investors use relief rallies back toward the former support area as opportunities to reduce exposure.
In Silver's case, the key level to monitor is now $70 itself. If prices attempt to recover and repeatedly encounter heavy selling around that area, it would suggest institutional distribution rather than accumulation. Such behavior would indicate that the market's long-standing structure is deteriorating and that investors are using strength to exit positions rather than build new ones.
Technically, the near-term outlook remains bearish while 73.08 support-turned-resistance caps any recovery. The next downside target stands at 61.79, representing the 100% projection of 89.37 to 73.08 from 78.80 at 61.79. Strong support is expected between 61.79 and the prior low at 60.97.
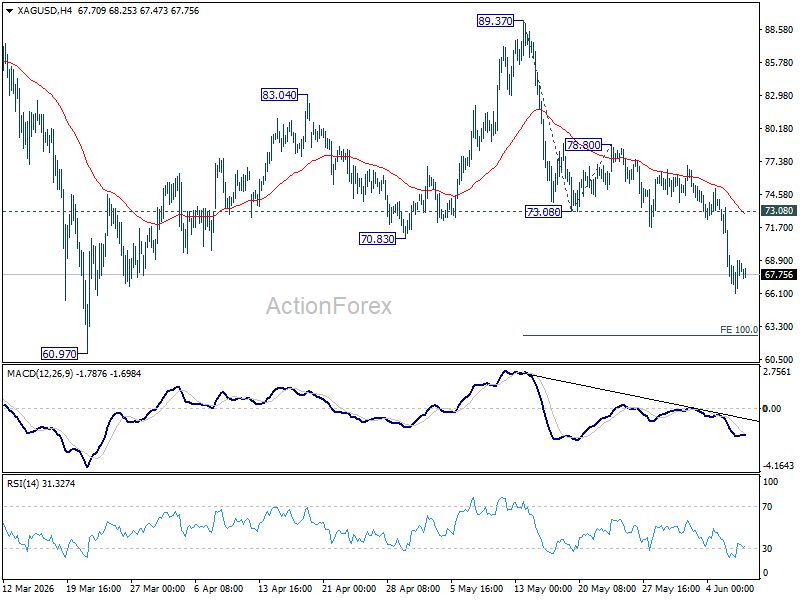
That support zone could still trigger a meaningful rebound. However, decisive break below 60.97/61.79 would signal a further acceleration in downside momentum. In that scenario, Silver could extend toward the 161.8% projection at 51.72 and potentially challenge the major psychological level at 50.
For now, the most important question is not how far Silver has already fallen. It is whether the market can reclaim $70 swiftly. If that level has indeed shifted from floor to ceiling, the implications for Silver's medium-term outlook could be far more significant than the current selloff alone suggests.
Australia NAB Business Confidence Lifts From Deep Lows as RBA Tightening Bites
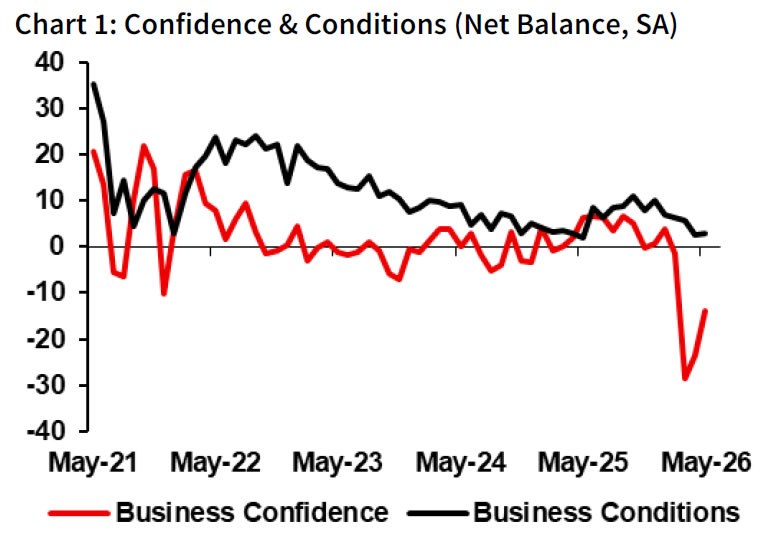
Australia's NAB Business Confidence Index improved from -23 to -14 in May, recovering from extremely weak levels as concerns over the economic fallout from the Middle East conflict eased. However, confidence remained firmly negative, highlighting ongoing caution among businesses despite signs that the economy has avoided a more severe slowdown. Business Conditions held steady at 3, with gains in trading and employment offset by weaker profitability.
The survey suggested that activity remains resilient despite higher interest rates and the recent energy price shock. Trading conditions improved from 7 to 8 and employment conditions rose from 1 to 2, while profitability slipped from 0 to -1. NAB said the disruption caused by the Middle East conflict has been less severe than initially feared, particularly with regard to supply chains. According to NAB's Gareth Spence, economic growth has slowed since late 2025 but continues to expand rather than contract, a view supported by spending and transaction data.
Inflation indicators also moved in a more favorable direction. Purchase cost growth slowed from 4.5% to 2.6% in quarterly equivalent terms, labour cost growth eased from 1.7% to 1.5%, while product price growth and retail price growth both halved. The moderation in cost and price pressures adds to evidence that RBA's tightening cycle is cooling the economy. While weak confidence remains a concern for future investment and hiring decisions, the survey points to an economy that is slowing rather than stalling.
| Indicator | April | May |
|---|---|---|
| NAB Business Confidence | -23 | -14 |
| Business Conditions | 3 | 3 |
| Trading Conditions | 7 | 8 |
| Profitability Conditions | 0 | -1 |
| Employment Conditions | 1 | 2 |
| Purchase Cost Growth | 4.5% | 2.6% |
| Labour Cost Growth | 1.7% | 1.5% |
| Product Price Growth | 1.8% | 0.9% |
| Retail Price Growth | 3.1% | 1.5% |
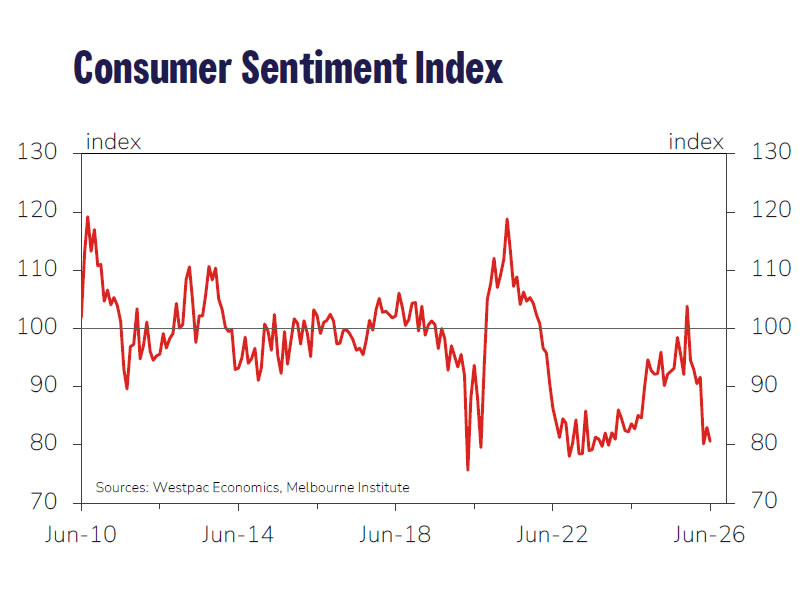
Australian Westpac Consumer Sentiment Falls Back Near Record Lows as Cost-of-Living Pressures Intensify
Australian consumer sentiment deteriorated in June, with the Westpac-Melbourne Institute Consumer Sentiment Index falling -2.9% month-on-month from 83.0 to 80.6. The decline reversed much of May's recovery and left confidence back among the weakest levels recorded in the survey's fifty-year history, highlighting the growing strain on households from higher living costs and rising interest rates.
Westpac said cost-of-living pressures had returned "with a vengeance", with consumers reporting a significant deterioration in both current and expected family finances. The "family finances versus a year ago" index dropped -7.5% to 67.3, while expectations for family finances over the next 12 months fell -8.5% to 85.1. Although views on the economy over the coming year improved modestly from extremely weak levels, longer-term confidence continued to deteriorate, with the five-year outlook index falling to a three-year low of 86.5.
The survey reinforces the difficult balancing act facing RBA ahead of next week's policy meeting. While the weakening in consumer sentiment highlights the impact of aggressive monetary tightening and higher energy prices, inflation remains the central bank's primary concern. Westpac expects RBA to pause after raising rates at its previous three meetings, giving policymakers time to assess the effects of tightening and the energy shock. However, with underlying inflation still running above the Bank's 2-3% target range, the prospect of further rate increases later this year remains firmly on the table.
| Indicator | May | June | Change m/m |
|---|---|---|---|
| Consumer Sentiment Index | 83.0 | 80.6 | -2.9% |
| Family Finances vs Year Ago | 72.8 | 67.3 | -7.5% |
| Family Finances Next 12 Months | 93.0 | 85.1 | -8.5% |
| Economy Next 12 Months | 74.2 | 77.8 | +4.9% |
| Economy Next 5 Years | 89.4 | 86.5 | -3.2% |