Sample Category Title
Eco Data 6/10/26
| GMT | Ccy | Events | Act | Cons | Prev | Rev |
|---|---|---|---|---|---|---|
| 23:50 | JPY | PPI Y/Y May | 6.30% | 5.50% | 4.90% | 5.30% |
| 01:30 | CNY | CPI Y/Y May | 1.20% | 1.30% | 1.20% | |
| 01:30 | CNY | PPI Y/Y May | 3.90% | 3.90% | 2.80% | |
| 12:30 | USD | CPI M/M May | 0.50% | 0.50% | 0.60% | |
| 12:30 | USD | CPI Y/Y May | 4.20% | 4.20% | 3.80% | |
| 12:30 | USD | CPI Core M/M May | 0.20% | 0.30% | 0.40% | |
| 12:30 | USD | CPI Core Y/Y May | 2.90% | 2.90% | 2.80% | |
| 13:45 | CAD | BoC Interest Rate Decision | 2.25% | 2.25% | 2.25% | |
| 14:30 | CAD | BoC Press Conference | ||||
| 14:30 | USD | Crude Oil Inventories (Jun 5) | -7.2M | -3.0M | -8.0M |
| 23:50 | JPY |
| PPI Y/Y May | |
| Actual | 6.30% |
| Consensus | 5.50% |
| Previous | 4.90% |
| Revised | 5.30% |
| 01:30 | CNY |
| CPI Y/Y May | |
| Actual | 1.20% |
| Consensus | 1.30% |
| Previous | 1.20% |
| 01:30 | CNY |
| PPI Y/Y May | |
| Actual | 3.90% |
| Consensus | 3.90% |
| Previous | 2.80% |
| 12:30 | USD |
| CPI M/M May | |
| Actual | 0.50% |
| Consensus | 0.50% |
| Previous | 0.60% |
| 12:30 | USD |
| CPI Y/Y May | |
| Actual | 4.20% |
| Consensus | 4.20% |
| Previous | 3.80% |
| 12:30 | USD |
| CPI Core M/M May | |
| Actual | 0.20% |
| Consensus | 0.30% |
| Previous | 0.40% |
| 12:30 | USD |
| CPI Core Y/Y May | |
| Actual | 2.90% |
| Consensus | 2.90% |
| Previous | 2.80% |
| 13:45 | CAD |
| BoC Interest Rate Decision | |
| Actual | 2.25% |
| Consensus | 2.25% |
| Previous | 2.25% |
| 14:30 | CAD |
| BoC Press Conference | |
| Actual | |
| Consensus | |
| Previous | |
| 14:30 | USD |
| Crude Oil Inventories (Jun 5) | |
| Actual | -7.2M |
| Consensus | -3.0M |
| Previous | -8.0M |
Sunset Market Commentary
Markets
Markets today experienced some kind of an ‘interim session’ with few high profile data and no ‘new news’ on the conflict in the Middle East. US President Trump repeated that they are in the ‘final throes of what will be a very, very good deal’ and that this might become concrete in the next days. However, markets for now understandably take a wait-and-see modus, with technical trading dominating today’s price action. Both ADP private payrolls (avg weekly change over the 4 weeks to 23 May at 29k) and US trade balance data (trade deficit at $55.9 bln; with a modest rise for both imports and exports) didn’t bring any market moving news. US NFIB small business confidence eroded further (95.3 from 95.9, the weakest level since September 2024). US yields are easing 2-3 bps across the curve. Oil returning near recent lows (Brent at $92) might be a small supportive factor for US bonds. However, tomorrow’s US May CPI data (expected at 0.5% M/M and 4.2% headline and 0.3% M/ and 2.9% for core) probably might be the more important factor to guide the short-term momentum on US interest rate markets. In similar technical trading, German yields show a similar pattern (2-y -3 bps; 30-y -0.5 bps). A 25 bps rate hike at Thursday’s ECB meeting is fully discounted. In the current environment, one can expect the ECB to remain cautious on giving any guidance on (the pace of) further steps. Even so, markets will be keen to hear any hints/assessment on the bank’s reaction function regarding back to back hikes if necessary. Equity markets today entered calmer waters with the EuroStoxx 50 regaining 1%. US indices, including the Nasdaq also again opened in green. Even so, the likes of the Nasdaq (+1%) and the S&P 500 (today +0,8%) still have some way to go to erase recent ‘losses/correction’. In this respect, we also keep a close eye at the reaction of equity markets in case of elevated/higher than expected US inflation data. On FX, the dollar continues to make a step backward after testing/nearing some first resistance levels. For the DXY TW index the 100.21/64 area (yesterday’s top/YTD top) for now looks one step too far/high. EUR/USD also shows resilience return to the 1.1575 area after yesterday’s test of the 1.15 area. However, also here we stay cautious ahead of tomorrow’s US CPI data. USD/JPY is still paralyzed near 160. Given day’s relative global USD softness, this isn’t a convincing sign for the yen.
News & Views
Sub-par Hungarian inflation paved the way for a near-term (potentially June) rate cut by the central bank. Headline prices stagnated on a monthly basis in May, allowing the annual figure to decelerate from 2.1 to 1.8%. That’s defying expectations for a quickening to 2.2% and below the lower bound of the Hungarian central bank’s 3% +/-1 ppt tolerance band. Core inflation fell by -0.02% m/m and to 1.94% y/y. Among the categories mentioned by the Hungarian central statistical office, food prices dropped by 0.3% m/m. Electricity, gas and other fuel prices also fell, by 0.8%. That offset service prices rising by 0.2% and clothing and footwear by 0.8%. Hungarian money markets had been pricing in rate cuts by the central bank for some time now amid a series of below-consensus CPI prints. Hungarian swap yields nevertheless slip around 10 bps across the curve. The forint implicitly approves such a central bank move by staying resilient over the last couple of weeks. EUR/HUF is currently trading around 355.3, among the HUF-strongest levels in more than four years.
The Japanese newspaper Nikkei reported that the Bank of Japan at its June meeting will discuss halting its quarterly reductions to its bond-buying program from fiscal 2027 (starting in April) onward. Sources told media outlet something similar, though added that the decision would be a split one between those that want to focus on soothing investor nerves and others that find it necessary to continue the taper process to reduce the BoJ’s large balance sheet. The BoJ has been reducing its bond holdings since 2024 under governor Ueda and is trimming the monthly buying pace by JPY 200bn each quarter. The current buying pace of JPY 2.1tn already allows for a natural run-off (some JPY 50tn per year) because of the sheer amount of bonds maturing from the bloated portfolio. The sources say this offers the BoJ a window for a taper pause, adding that the central bank could keep the current buying pace open-ended. Apart from the balance sheet debate, it’s all but certain that the BoJ will hike its policy rate to 1% next week. Markets price in another move by year-end.
US: Small Business Optimism Eases in May as Price Pressures Trek Higher
The NFIB's Small Business Optimism Index fell 0.6 points to 95.3 in May, disappointing market expectations for a modest uptick to 96.1. The Uncertainty Index rose 3 points to 91, remaining well above its historical average of 68.
Six out of the ten index subcomponents deteriorated on the month, three improved and one remained unchanged. Large pullbacks were recorded among the labor market components, followed by more muted declines in expectations for higher real sales (-2 points to 1%) and the belief that current inventory levels are too low (-2 points to -4%). Earnings trends improved (+4 points to -15%), as did plans to increase inventories (+3 points to 1%).
The net share of businesses planning to increase employment fell a steep 4 points to 9%, while the share of firms with unfilled job openings fell 5 points to 29%, with each indicator now at its lowest level since the start of the pandemic. Quality of labor concerns fell 5 points to 13% – the lowest level since 2016 – but concerns about the cost of labor moved up (+5 points to 14%). Inflation remained the top concern as it continued to edge higher (+2 points to 18% – a notable increase from 12% in February).
The net share of firms currently increasing employee compensation rose 1 point to 31%, while the net share planning to do so over the next three months was unchanged for the third month in a row at 18%. The share of businesses 'raising' average selling prices continued to push higher (+6 points to 36%), as did the share of those 'planning’ to raise average selling prices in the months ahead (+7 points to 34%).
Key Implications
Small business confidence edged lower in May and has now effectively erased nearly all of its gains since late-2024. A renewed buildup in price pressures appears to be a key factor behind the recent (albeit moderate) deterioration in sentiment. The standout in today’s report was the notable upturn in the share of firms both raising and planning to raise average selling prices. At the same time, concerns about inflation remained top of mind as they continued to edge higher – marking a clear departure from their February level before the start of the Middle East conflict.
Labor market indicators were another soft spot in today’s report. While the May payrolls report showed that hiring across the broader U.S. economy remains healthy, signals from the NFIB survey point to a potential slowdown in small business hiring over the near-term. Hiring plans and unfilled job openings both fell sharply, with each now sitting near levels last seen in 2016. At the same time, firms appear increasingly concerned about labor costs rather than labor quality, with the former overtaking the latter for the first time since 2013. Taken together, the report reinforces the view that small and medium-sized firms are likely to make smaller contributions to job growth in the months ahead.
Canada’s Trade Surplus Widened in April
Canada's trade balance moved into a $2.7 billion surplus in April, widening from $1.8 billion the prior month.
Exports in April rose by 1.6% month-on-month (m/m) following sturdy gains over the last two months. Higher oil prices pushed energy exports up 9.7% m/m, led by crude oil. Exports of motor vehicles and parts gained handsomely in April (+5.9% m/m) following the ongoing recovery in Canadian auto production. Solid gains in wheat (+31.9% m/m) and industrial machinery (+9.6%) were offset by a sharp 17.5% m/m drop in exports of metal and non-metallic mineral products. In total, 9 of 11 product categories registered a gain.
Goods imports nudged higher by 0.3% m/m in April, reversing March's loss, with 6 of 11 subsectors booking a gain. Industrial, chemical, plastic and rubber imports (+16.9% m/m) and imports of electronics and electrical equipment (+13.2% m/m) contributed most to the monthly gain.
In volume terms, exports increased up by 3.0% m/m while imports edged higher by 0.4% m/m.
Canada's merchandise trade surplus with the United States widened from $7.8 billion in March to $9.5 billion in Exports. Exports to non-U.S. destinations moderated in April, falling by 4.8% m/m.
Key Implications
With improving exports volumes in April, Q2 trade data point to a reversal in trade dynamics, suggesting net trade is poised to shift from a material drag in Q1 to a modest tailwind in Q2. That said, with flows still heavily influenced by volatile components (notably oil, gold and autos), trade contributions are likely to remain choppy and through the remainder of the year.
The July 1st CUSMA review deadline is fast approaching, but a timely renewal looks unlikely as negotiations have yet to gain steam. Importantly, missing the deadline does not imply a collapse of the agreement: CUSMA remains in force and would shift into rolling annual reviews, raising the spectre of prolonged negotiations and ongoing trade uncertainty.
Gold: Has It Bottomed Out at $4,300?
- Gold is trying to find a bottom, bracing for the US CPI release.
- China continues to buy gold for the 19th consecutive month.
The US dollar retreated after Israel and Iran announced a ceasefire. Donald Trump urged them not to shoot at each other. Nevertheless, the adversaries reserve the right to resume hostilities, keeping tensions high in the Middle East, which supports the greenback as a safe-haven asset.
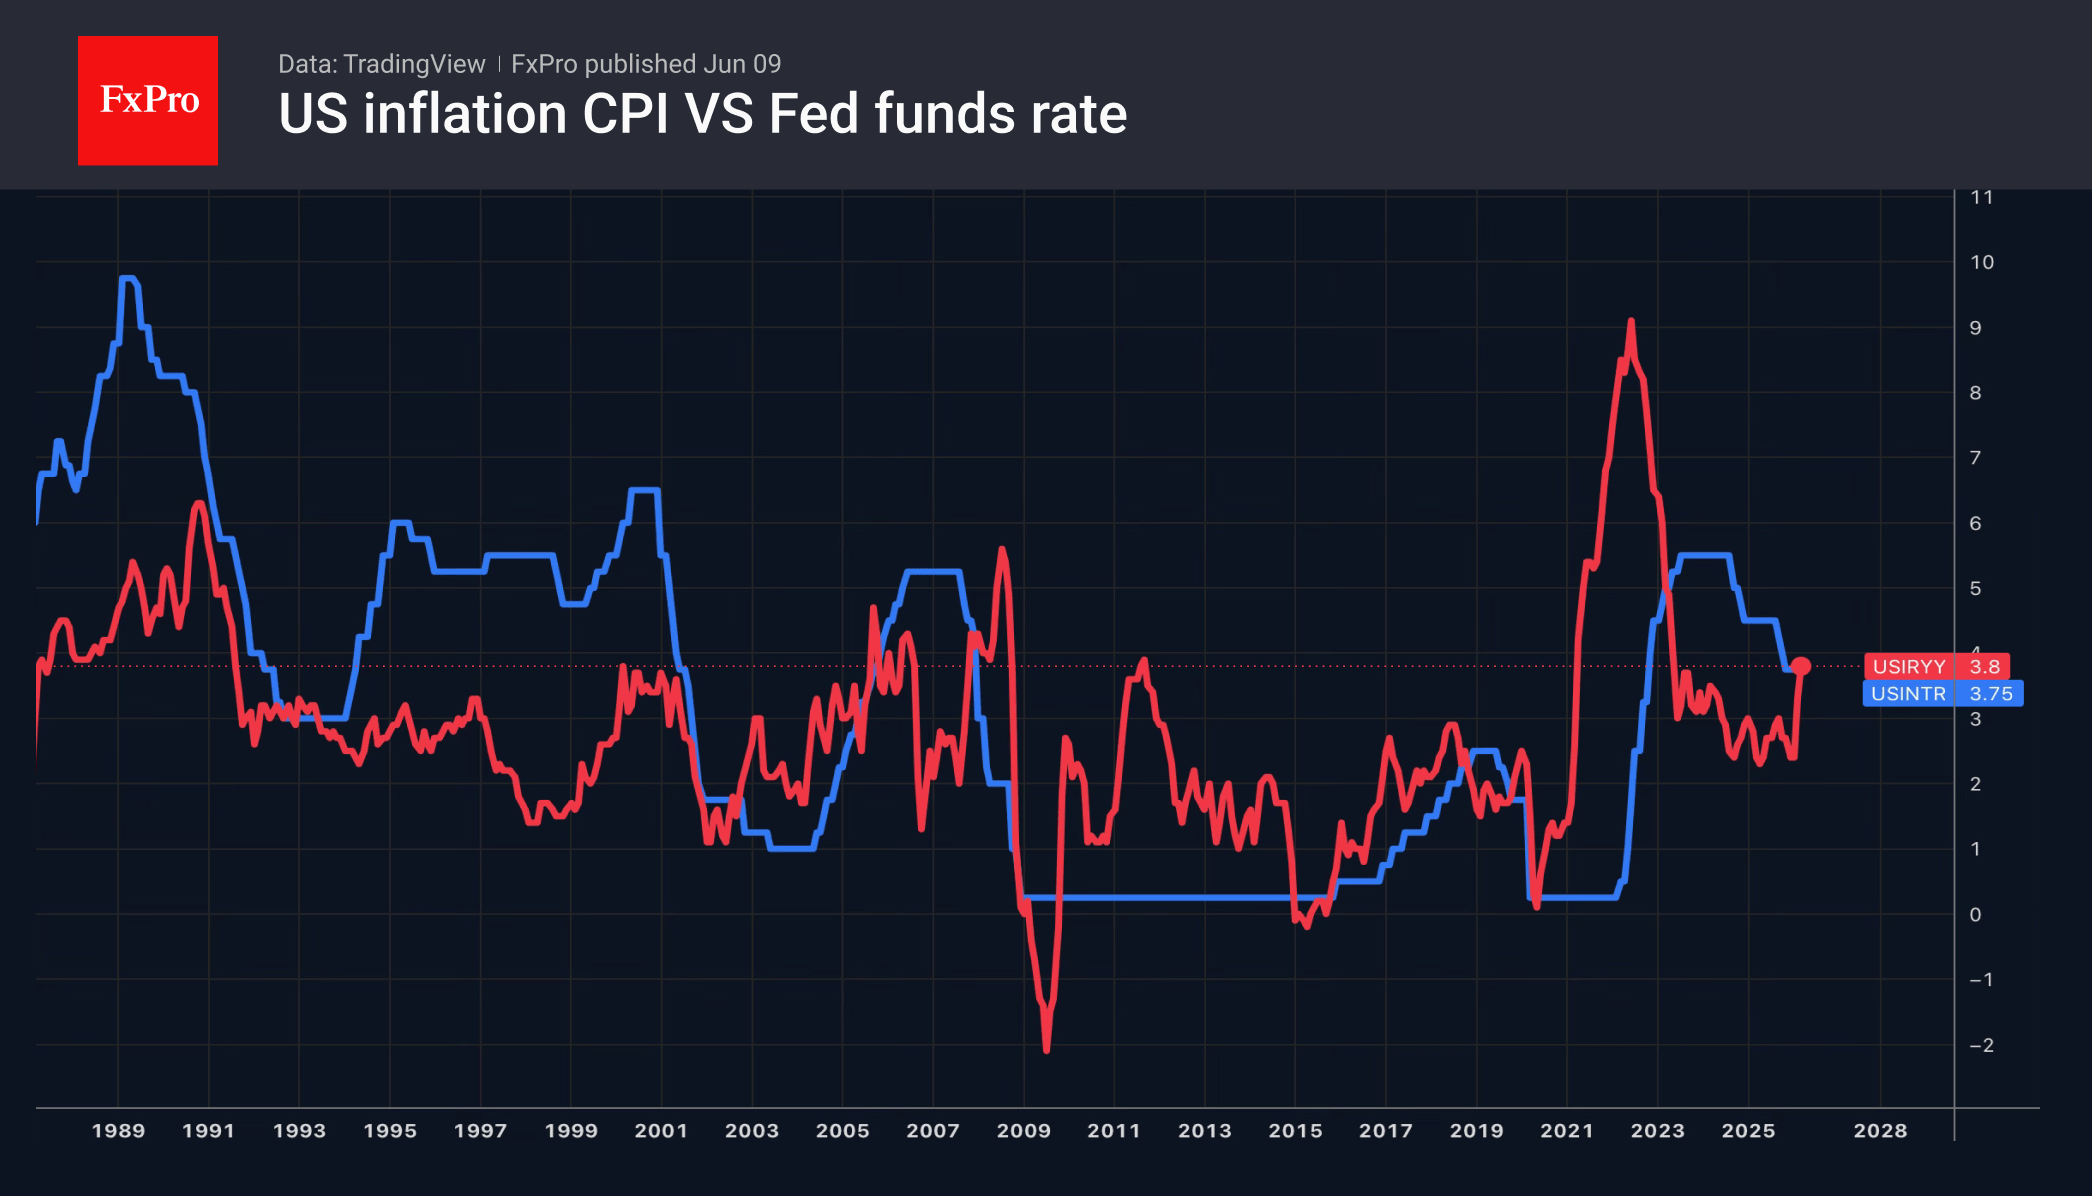
Investors are fixated on Donald Trump’s determination to strike a deal with Tehran at any cost and are using the positive news to buy EURUSD. However, according to BMO Capital Markets, headlines are noise, whilst regime change is the signal. Oil prices will not collapse following the reopening of the Strait of Hormuz, and high US inflation is set to persist for some time. The new administration will force the Fed to raise rates and make the US dollar the favourite in the forex market. The firm recommends buying the greenback against the euro, the pound and the yen.
This reasoning holds. With low unemployment and a tight labour market, any acceleration in US economic growth will lead to higher wages. This will push consumer prices upwards and prompt the Fed to tighten monetary policy. The federal funds rate could be raised even now. Inflation has long exceeded the 2% target, and the labour market is at its strongest since 2024.
The prospect of the Fed moving towards monetary tightening, combined with rising oil prices due to the escalation of the conflict in the Middle East, has pushed gold back to levels seen at the start of 2026. The precious metal has wiped out all its gains this year due to the strengthening US dollar and rising Treasury bond yields.
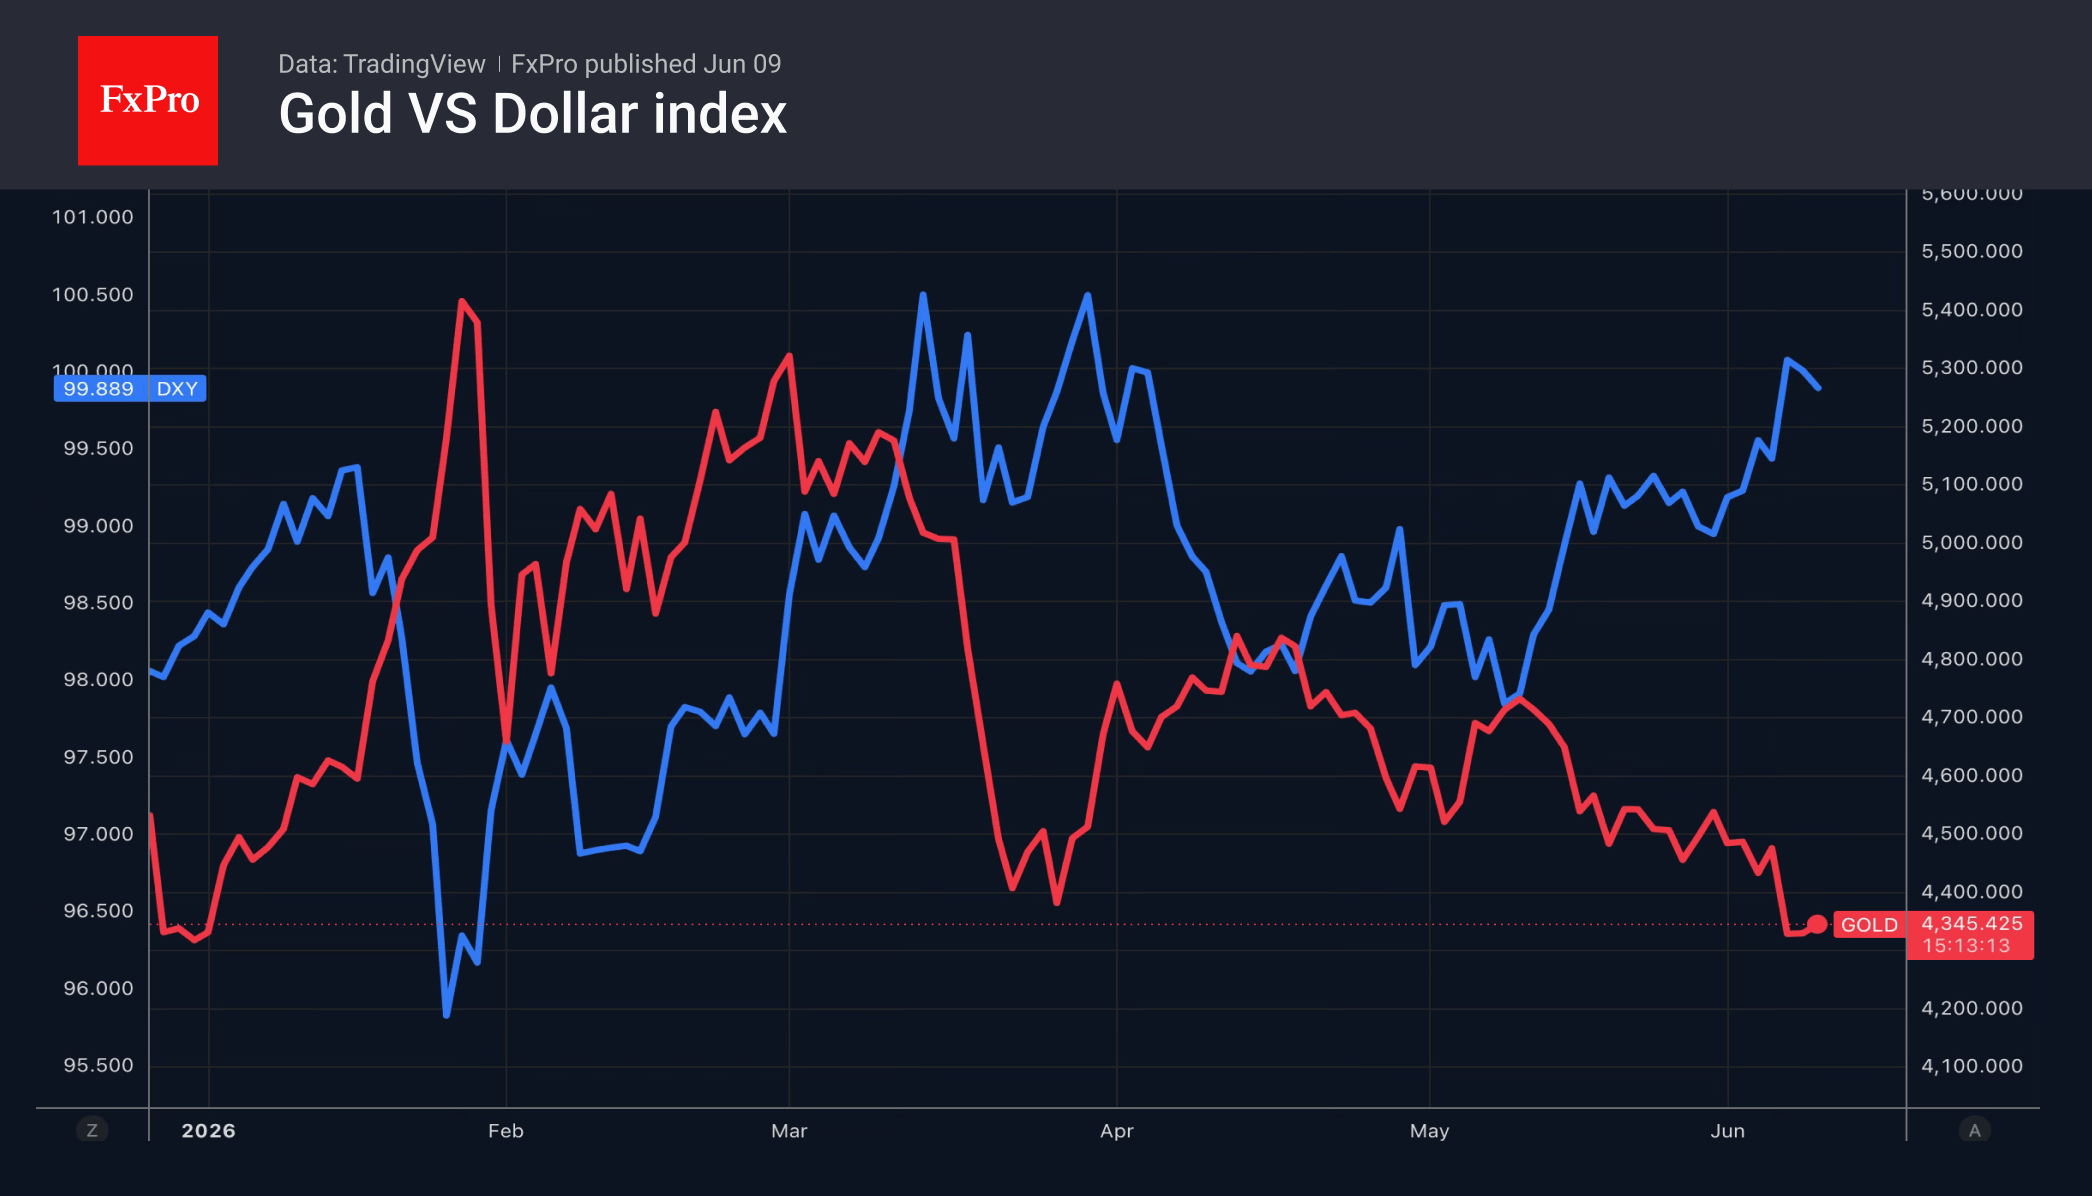
Even active buying by central banks is failing to help gold bulls. The People’s Bank of China increased its reserves by 320,000 ounces in May, having purchased gold continuously for 19 months. This is the longest such streak since 2015, when regular publication of these statistics began.
The next test for gold will be the May US inflation report. Consumer prices are expected to rise from 3.8% to 4.2%, and core CPI from 2.8% to 2.9%. Such trends will increase the likelihood of the Fed tightening monetary policy and put pressure on gold.
Traders Take Profits Ahead of High-Stakes US CPI, Sterling Jumps on Strong Consumer Spending
Global markets showed signs of stabilization today, but conviction remained notably absent as investors positioned cautiously ahead of Wednesday's pivotal US CPI report. Technology shares rebounded strongly across Japan and South Korea, oil prices eased, and Dollar softened. Yet the moves appeared driven more by profit-taking and position adjustment than by a decisive shift in sentiment.
The recovery in technology stocks was particularly notable given last week's sharp AI-driven selloff. However, the rebound may not be as reassuring as headline price action suggests. Market flow data indicate that while technology shares have rallied for two consecutive sessions, institutional investors continue to build net short positions across US and Asian technology sectors. That pattern points more toward short covering and profit-taking rather than the return of meaningful long-term buying interest.
Part of the improvement in sentiment also came from softer oil prices. Brent crude extended its retreat as US President Donald Trump again suggested that a deal to end the conflict with Iran could be reached within "two or three days." Markets welcomed the possibility of progress, but the reaction remained measured. Traders appear reluctant to fully embrace a de-escalation narrative given the repeated delays and setbacks that have characterized negotiations in recent months.
The result is a market that is neither fully risk-on nor risk-off. Instead, investors appear content to reduce exposure and wait for clearer signals from inflation data. Following last week's stronger-than-expected US nonfarm payrolls report, attention has shifted almost entirely toward inflation and whether rising energy costs are beginning to feed more broadly into consumer prices. A stronger CPI reading would likely reinforce expectations of additional Fed tightening, with implications for yields, Dollar and risk assets.
One notable exception to the generally cautious tone was Sterling. The Pound gained support after the BRC Retail Sales Monitor delivered a major upside surprise. UK retail sales rose 3.7% year-on-year in May, far exceeding expectations for a 0.6% increase and sharply reversing April's -3.4% decline. While favorable weather and holiday spending contributed to the rebound, the data also suggested consumers remain more resilient than many had expected despite elevated borrowing costs and energy prices.
That resilience carries important policy implications. If consumer demand remains firm while inflation pressures persist, the case for another Bank of England rate hike later this year could strengthen considerably. For now, Sterling's outperformance reflects growing confidence that the UK economy may be proving more resistant to higher rates than previously assumed.
In currency markets, New Zealand Dollar led gains for the week, followed by Sterling and Euro. Dollar is the weakest performer, with Yen and Swiss Franc also under pressure. The mixed ranking underscores the broader theme of selective positioning rather than a unified market view, a dynamic that could change rapidly once the US inflation data are released.
Oil Traders Are Betting on Peace; The Clock Is Betting on $150 Crude
Oil prices suggest traders still expect diplomacy to prevail. But beneath the surface, governments and businesses have been relying on strategic reserves and inventory drawdowns to offset supply disruptions from the Strait of Hormuz. Those buffers are finite, and the next few weeks could determine whether Brent continues falling—or begins a march toward $150. Read More.
Silver's $70 Breakdown May Have Changed Everything
Silver's slide below $70 may be more important than the selloff itself. A level viewed as a structural floor supported by supply deficits and industrial demand has now broken, raising the possibility that $70 could become a new ceiling. The next rebound may reveal whether investors are buying the dip—or using rallies to exit positions. Read More.
China Exports Surge 19.4% as US Trade Truce and Tech Demand Fuel Growth
China's trade sector delivered another upside surprise in May. Exports surged nearly 20%, led by booming technology shipments, rising vehicle exports and a sharp rebound in trade with the US. Strong import growth and record purchases from South Korea also point to resilient manufacturing activity across Asia. Read More.
Australian Consumer Sentiment Falls Back Near Record Lows as Cost-of-Living Pressures Intensify
The pressure on Australian households is intensifying. Consumer confidence fell back near historic lows in June as cost-of-living concerns returned "with a vengeance", highlighting the growing economic toll of higher prices and interest rates. Read More.
Australia NAB Business Confidence Lifts From Deep Lows as RBA Tightening Bites
The worst fears about the energy shock have not materialized. Australia's latest NAB survey showed improving business confidence, steady activity and a sharp slowdown in cost and price growth, offering signs that RBA tightening is having the desired effect. Read More.
GBP/JPY Daily Outlook
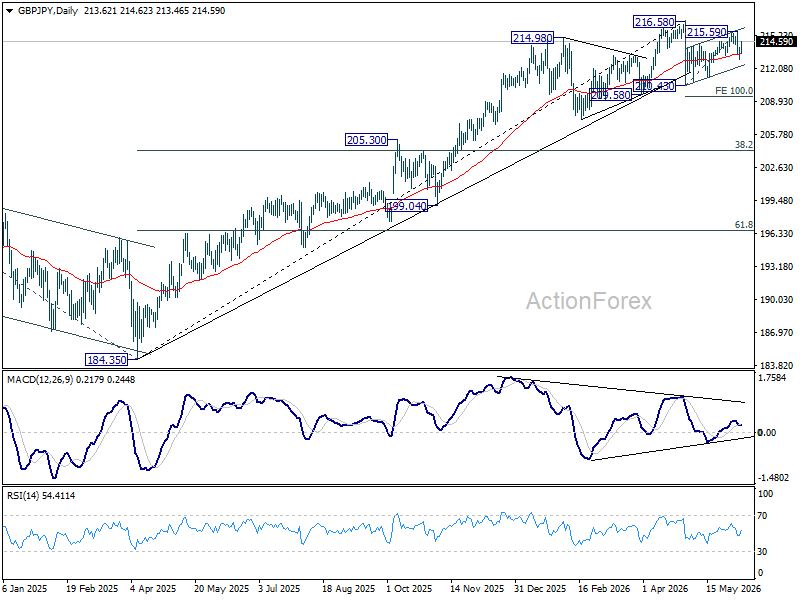
Intraday bias in GBP/JPY is turned neutral with current recovery. Risk will stay mildly on the downside as long as 215.59 resistance holds. Below 212.90 will target 210.43/211.23 support zone. However, firm break of 215.59 will resume the rebound from 210.43 to retest 216.58 high instead.
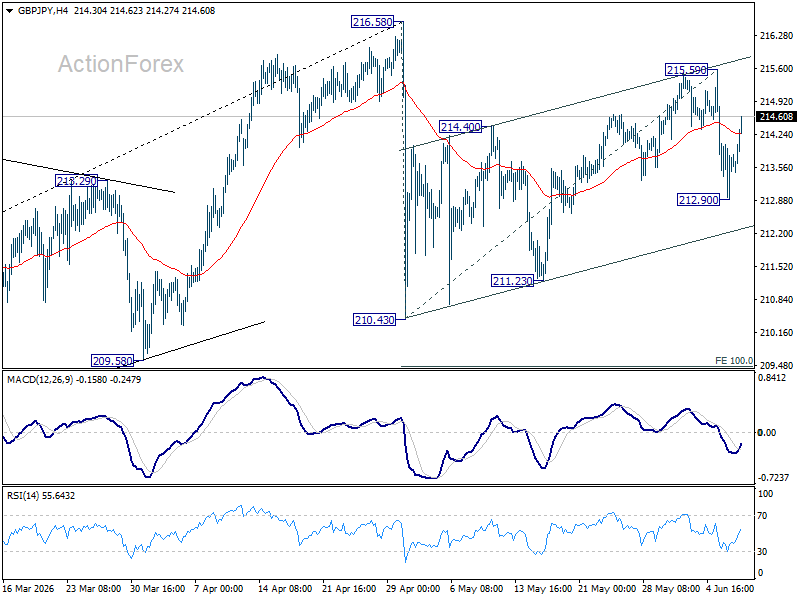
In the bigger picture, there is no clear sign of trend reversal yet. The long term up trend could still extend to 61.8% projection of 148.93 (2022 low) to 208.09 (2024 high) from 184.35 at 220.90 on resumption. However, sustained break of 55 W EMA (now at 206.77) will argue that it's already in medium term down trend for 184.35 support.
Crypto Market Rebounds from Its Worst Oversold Conditions Since 2020
Market Overview
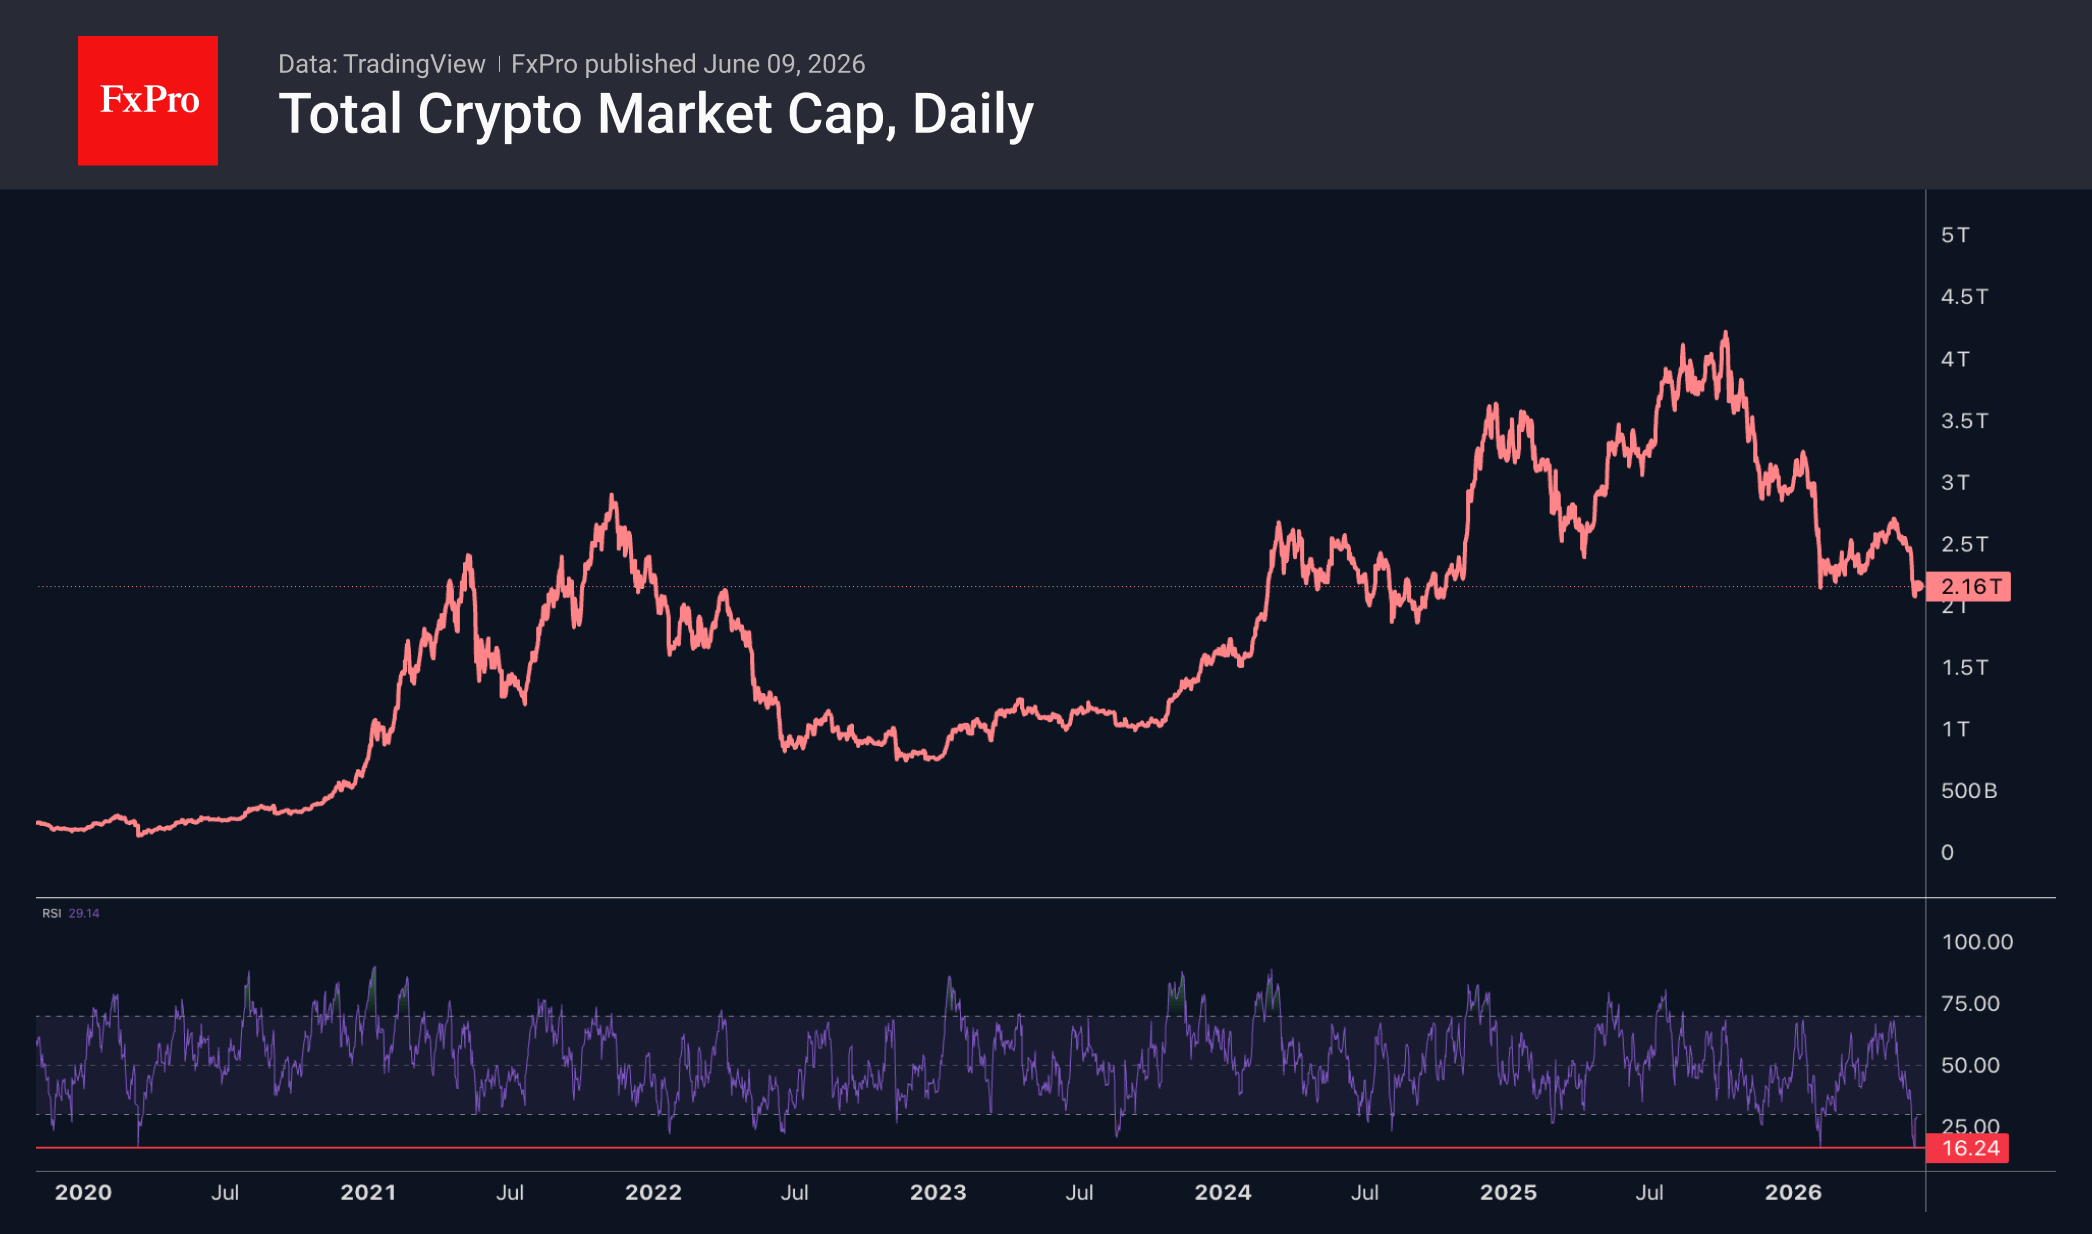
The crypto market capitalisation has risen by 1.3% over the past 24 hours to $2.18 trillion. With no fresh downward momentum, bears are taking profits, while some investors view the situation as a good opportunity for long-term positions. On daily timeframes, the RSI is recovering and entering neutral territory after the most severe oversold conditions since 2020. Among the top-performing coins of the day were BAT (+13%), NEAR (+7%) and ZEC (+6.5%). The underperformers were BCH (-6.1%), TRX (-0.6%) and UNI (+0.2%).
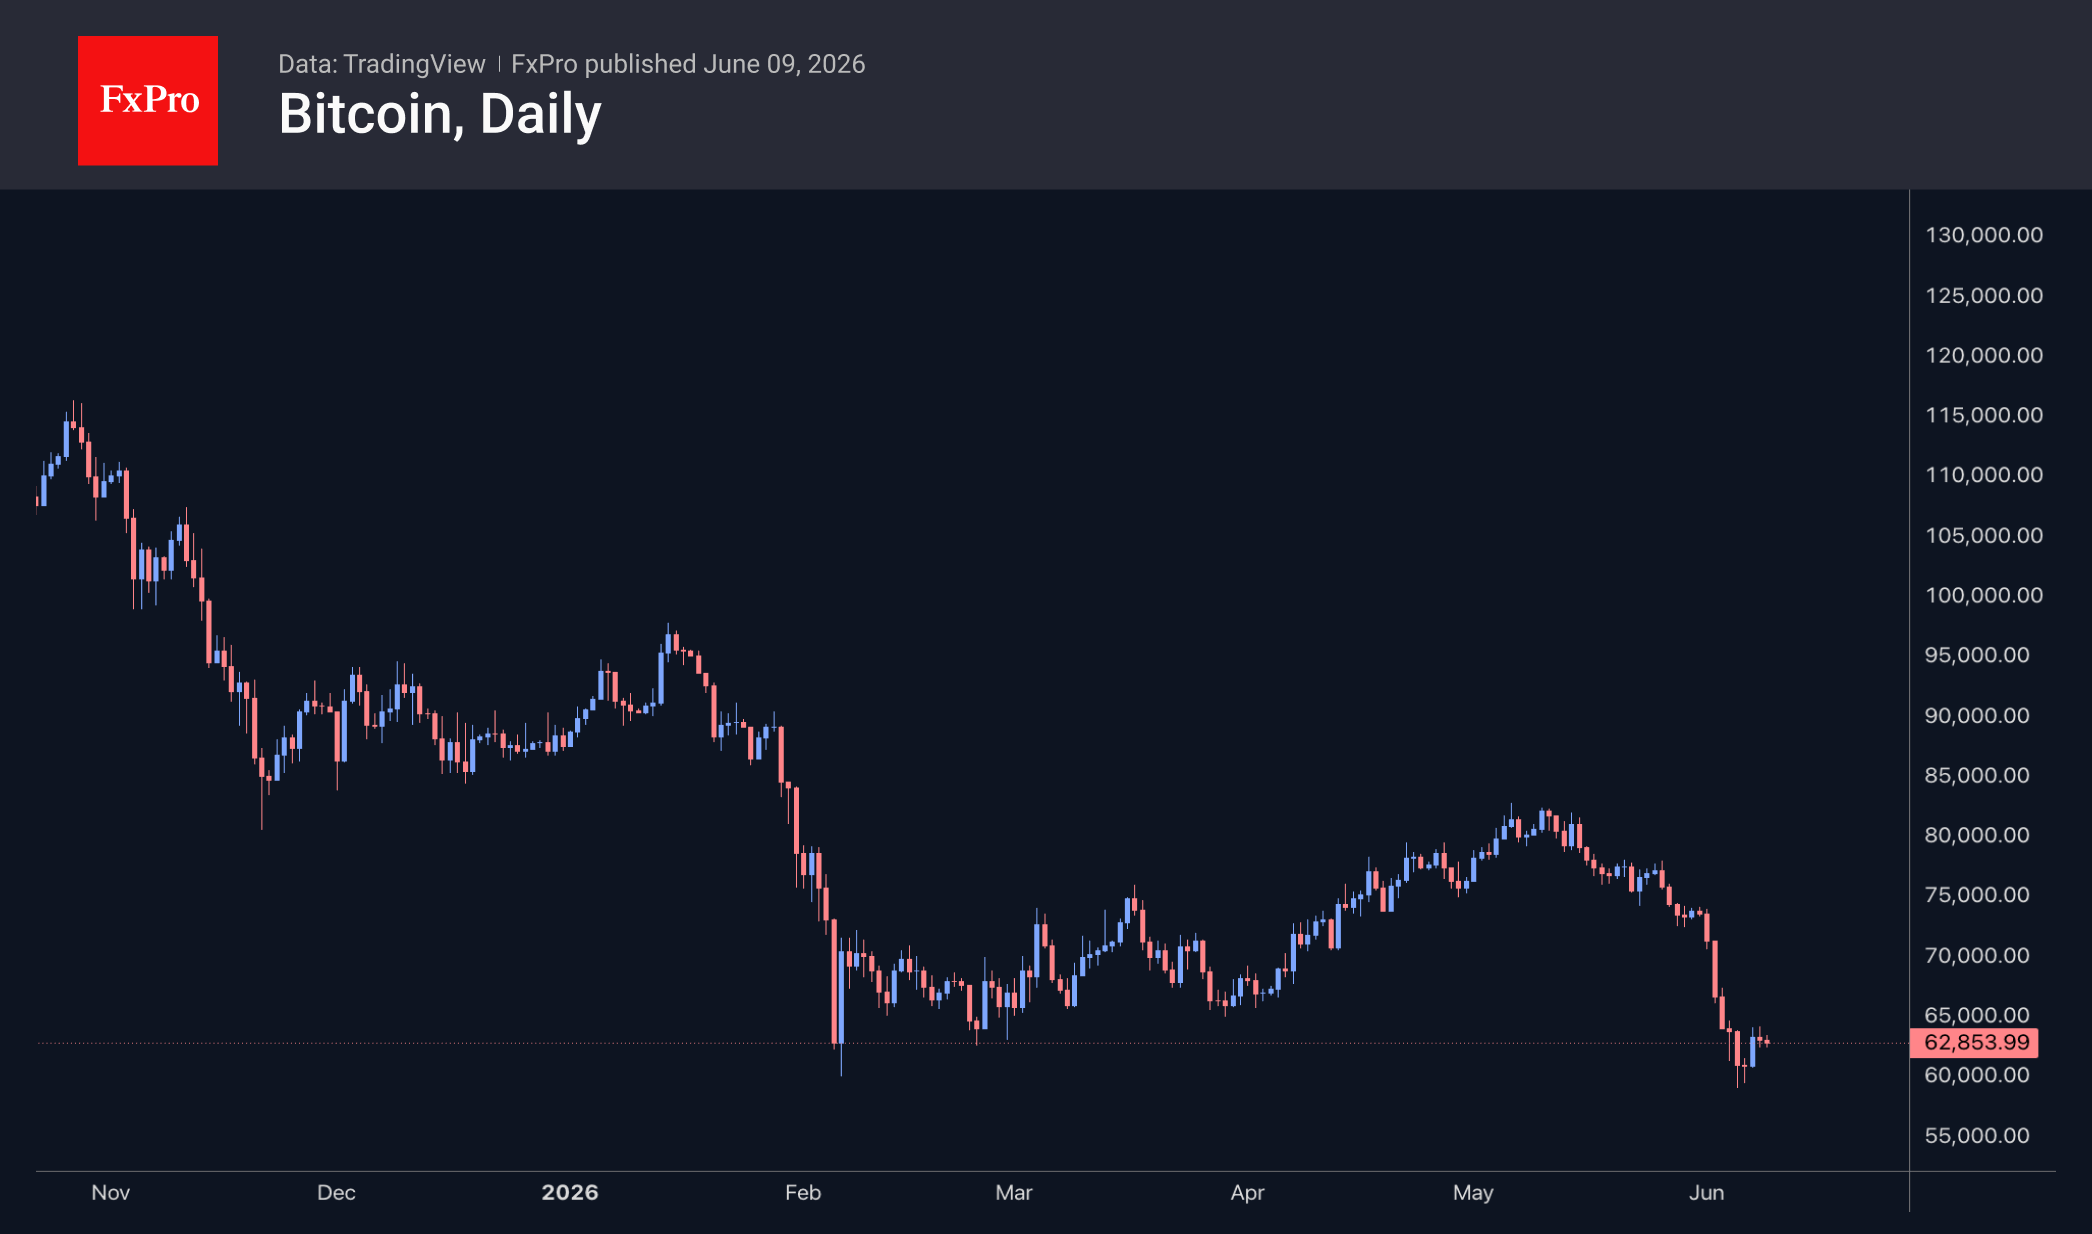
Bitcoin rebounded to $63.2K, moving away from Friday’s lows of $59K. Technically, a recovery up to $68K could be viewed as a rebound from the downward momentum seen between 11 May and 5 June. On the other hand, a sustained rebound over this period would confirm a bounce off the 200-week moving average and bring the leading cryptocurrency out of oversold territory, which would be a different narrative altogether. It is quite possible that this situation will be a very close analogy to 2020, when a couple of months of recovery from the last slump were followed by four months of sideways movement and a subsequent boom.
News Background
Bitcoin is experiencing its first-ever drop in hash rate due to economic reasons, Elektron Energy notes. From its record high in September 2025, the network’s computing power has fallen by approximately 25%.
A ‘changing of the guard’ has occurred in the crypto market, with the leaders of key segments giving way to a new generation of participants. The main areas of development will be decentralised finance (DeFi), the tokenisation of real-world assets (RWA) and stablecoins, while blockchain systems will interact more closely with AI, Bitwise predicts.
By selling shares, Strategy purchased an additional 1,550 BTC last week for $101.3 million at an average price of $65.3K per coin. A week earlier, the company sold 32 BTC for the first time since 2022. Strategy now holds 845,256 BTC, purchased for $64 billion at an average price of $75.7K per Bitcoin.
Over the past week, BitMine increased its reserves by 126,971 ETH, marking its largest purchase since the start of the year. BitMine’s reserves exceeded 5.54 million ETH, accounting for 4.59% of the Ethereum supply. The company has stepped up its purchases of the altcoin following its price decline.
Tether’s USDT stablecoin briefly overtook Ethereum to take second place by market capitalisation, notes JAN3 founder Samson Mow. Bloomberg strategist Mike McGlone expects USDT could even overtake Bitcoin in terms of capitalisation should Bitcoin experience a sharp decline.
EUR/USD Daily Outlook
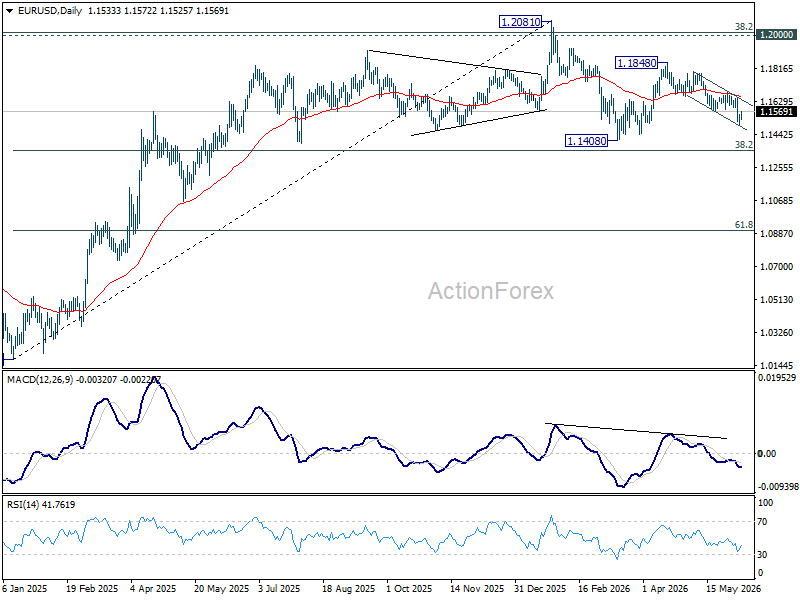
EUR/USD recovered just ahead of near term falling channel floor and intraday bias is turned neutral first. Some consolidations could be seen, but risk will stay on the downside as long as 1.1685 resistance holds. Break of 1.4992 will resume the fall from 1.1848 to retest 1.1408 low next.
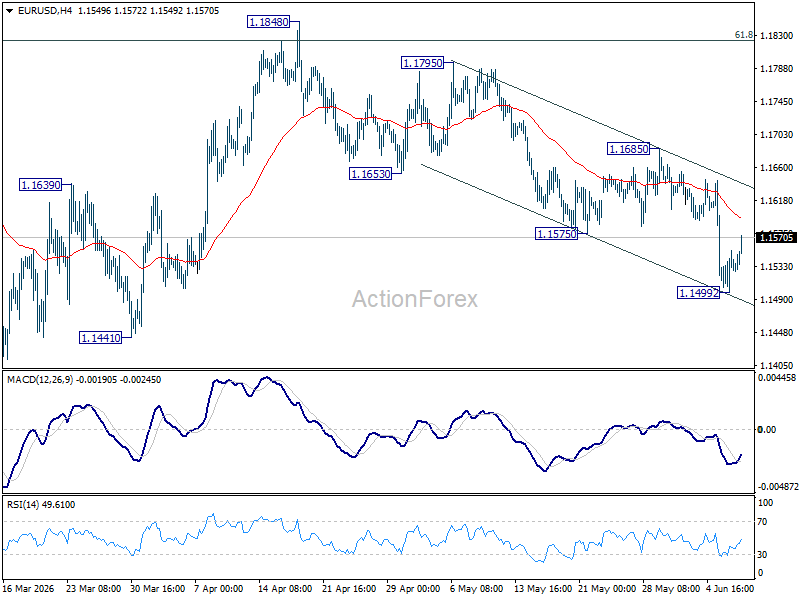
In the bigger picture, the strong support from 38.2% retracement of 1.0176 to 1.2081 at 1.1353 suggests that the pullback from 1.2081 is more likely a corrective move. Strong support was also found in 55 W EMA (now at 1.1547). Focus is back on 1.2 key cluster resistance level. Decisive break there will carry long term bullish implications. Nevertheless, break of 1.1408 support will revive the case of medium term bearish trend reversal.
USD/JPY Daily Outlook
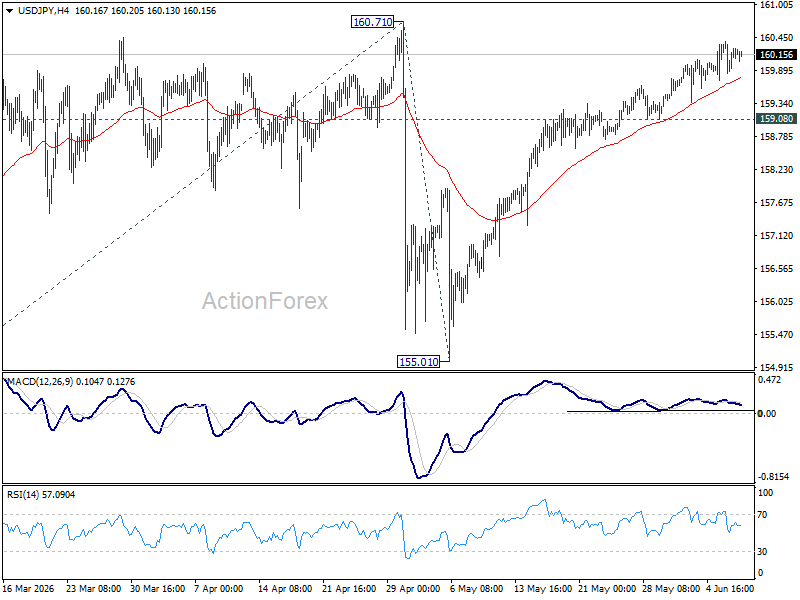
Further rise could still be seen in USD/JPY. But strong resistance is still expected from 160.71. Break of 159.08 will turn bias back to the downside the extend the corrective pattern from 160.71 with the third leg. However, decisive break of 160.71 will confirm up trend resumption. That should push USD/JPY through 161.94 to 100% projection of 152.25 to 160.71 from 155.01 at 163.47 next.
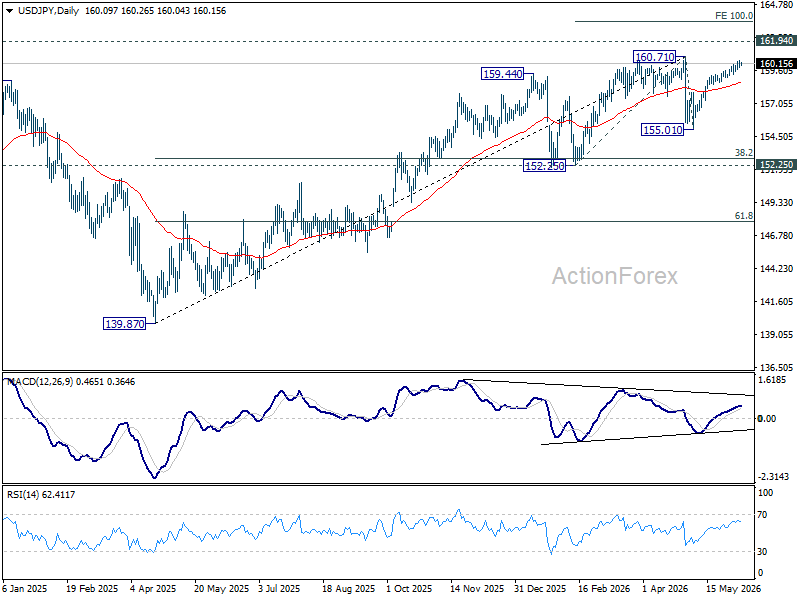
In the bigger picture, for now, corrective pattern from 161.94 (2024 high) is still seen as completed at 139.87. Rise from there is seen as resuming the long term up trend. So, break of 161.94 is expected at a later stage to resume the long term up trend. However, sustained break of 55 W EMA (now at 154.93) will dampen this view and bring deeper fall back towards 139.87 to extend the pattern from 161.94.
GBP/USD Daily Outlook
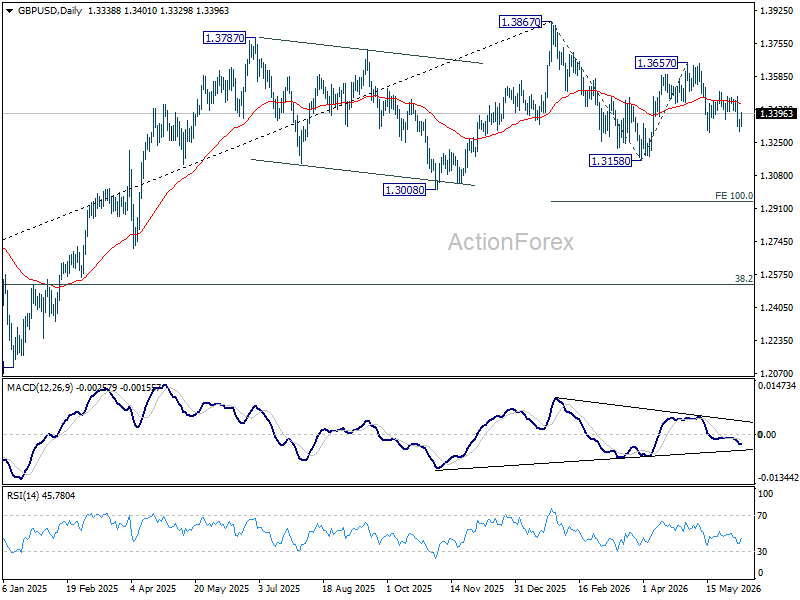
GBP/USD recovered ahead of 1.3300 support as sideway trading continues. Intraday bias remains neutral first. On the downside, break of 1.3300 will target a retest on 1.3158. Firm break there will extend the whole fall from 1.3867 to 100% projection of 1.3867 to 1.3158 from 1.3657 at 1.2948. For now, risk is mildly on the downside as long as 1.3508 resistance holds, in case of recovery.
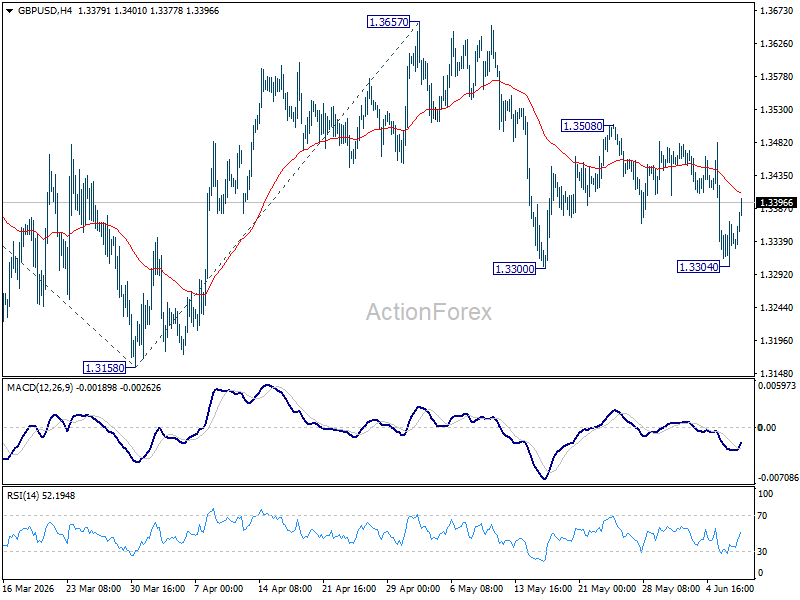
In the bigger picture, price actions from 1.3867 are a corrective pattern within the broader up trend from 1.0351 (2022 low). With 1.3008 support intact, medium term bullishness is maintained and break of 1.3867 is in favor for a later stage, towards 1.4248 key resistance (2021 high). However, firm break of 1.3008 will at least bring deeper fall to 38.2% retracement of 1.0351 to 1.3867 at 1.2524, with increased risk of bearish reversal.