
Sample Category Title
Chart Alert: USD/JPY Advances Toward the Next 161.60/95 Key Intervention Levels
Key takeaways
- USD/JPY remains supported by a widening US-Japan yield differential. Markets are increasingly pricing a more hawkish Federal Reserve, with rising expectations of a Fed rate hike later in 2026, while the Bank of Japan appears likely to slow or pause its bond tapering programme despite an expected rate increase next week.
- The pair is approaching a key intervention zone near 160.40–160.70. Japanese authorities have already spent a record amount defending the yen earlier this year, making this area a critical level where renewed verbal or direct intervention risks may emerge.
- Technical momentum remains constructive in the near term. USD/JPY continues to trade within both a medium-term ascending wedge and a shorter-term rising channel, with momentum indicators remaining supportive of a further advance toward the 160.65, 161.14/20, and 161.60/95 resistance levels.
The US CPI shock and a hawkish Fed
The market enters today’s US CPI print, facing building macro headwinds and energy shocks stemming from the ongoing Middle East conflict. Following a complete evaporation of Fed rate-cut bets for 2026, the market is aggressively positioned for a bear-flattening yield curve environment under Fed Chair Kevin Warsh. With futures now pricing in a 61% probability of a 25-bps hike in October, an upside surprise in today’s CPI, potentially pushing inflation to multi-year highs, will solidify the higher-for-longer regime and maintain structural upward pressure on the greenback.
BoJ’s balancing act - The June rate hike vs. bond taper pause
Next week (June 15-16), the Bank of Japan is widely expected to shift its narrative toward becoming an active “inflation fighter”. Aggregated polls show nearly 94% of economists expect Governor Ueda to deliver a 25-basis-point hike, lifting the short-term policy rate to 1.00% from 0.75%, a level last seen in 1995. This hawkish tilt is directly responsive to the persistent inflationary impulses generated by the US-Iran war.
Crucially, to mitigate political friction with Prime Minister Sanae Takaichi and stabilise a volatile sovereign bond market where the 10-year Japanese Government Bond (JGB) yield has recently hit a 30-year high of 2.8%, the BoJ is leaning towards pausing or slowing its bond-purchase taper next fiscal year.
By freezing further monthly purchase reductions (potentially keeping them steady near 2.1 trillion yen), the central bank hopes to cap the blowout of debt-servicing costs before yields breach the painful 3% threshold.
The 2-year US Treasury/JGB yield spread is widening
Fig. 1: 2-YR & 10-YR US Treasuries/JGBs yield spreads as of 10 Jun 2026 (Source: TradingView). The information presented is historical information, and past performance is not indicative of future performance.
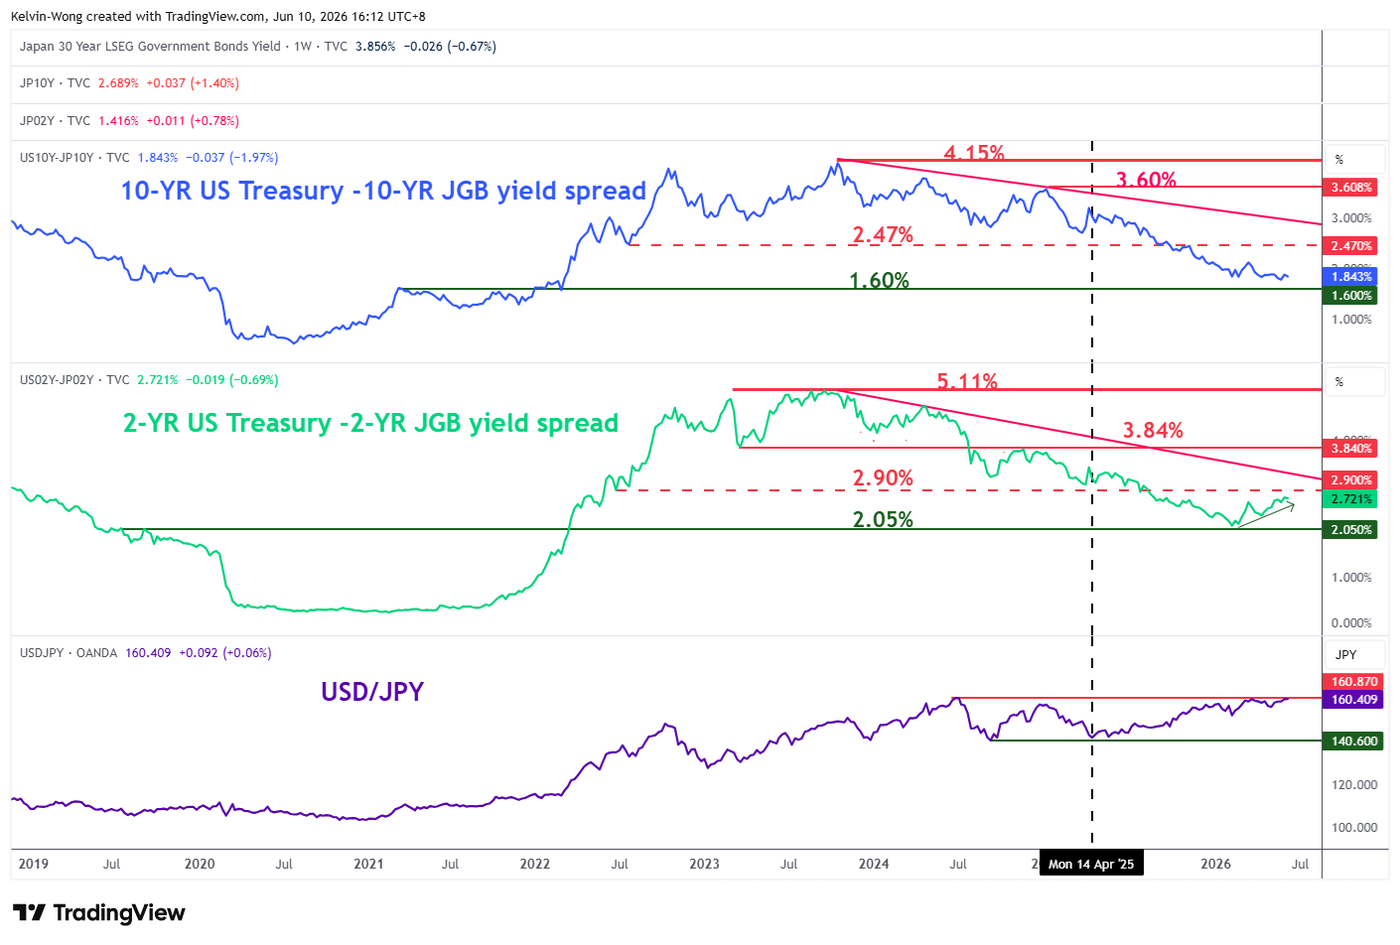
The shorter-term yield spread between the 2-year US Treasury and the Japanese Government Bond (JGB) has started to widen since hitting a 4-year low of 2.12% earlier in February 2026, which is also just a whisker above a major support of 2.05% (see Fig. 1).
The spread of the 2-year US Treasury-JGB yield has rebounded by 60 basis points to 2.72% as of Wednesday, 9 June 2026, which implies that the US Federal Reserve is adopting a more hawkish monetary policy stance over the Bank of Japan, in turn putting downside pressure on the Japanese yen as it flirts around the prior intervention area of 160.40/70, where Vice Finance Minister Mimura, in charge of foreign exchange issued a “final verbal warning” to speculators on 30 April 2026 before actual intervention took place on the same day.
Japanese authorities have spent a record $ 74.1 billion in the latest round of FX intervention to buy yen between 30 April 2026 and 6 May 2026, according to Finance Ministry data.
Let’s now unpack the short-term trajectory (1 to 3 days) of the USD/JPY from a technical analysis perspective.
Grinding up towards “Ascending Wedge” upper boundary at 160.60/95
Fig. 2: USD/JPY medium-term trend as of 10 Jun 2026 (Source: TradingView). The information presented is historical information, and past performance is not indicative of future performance.
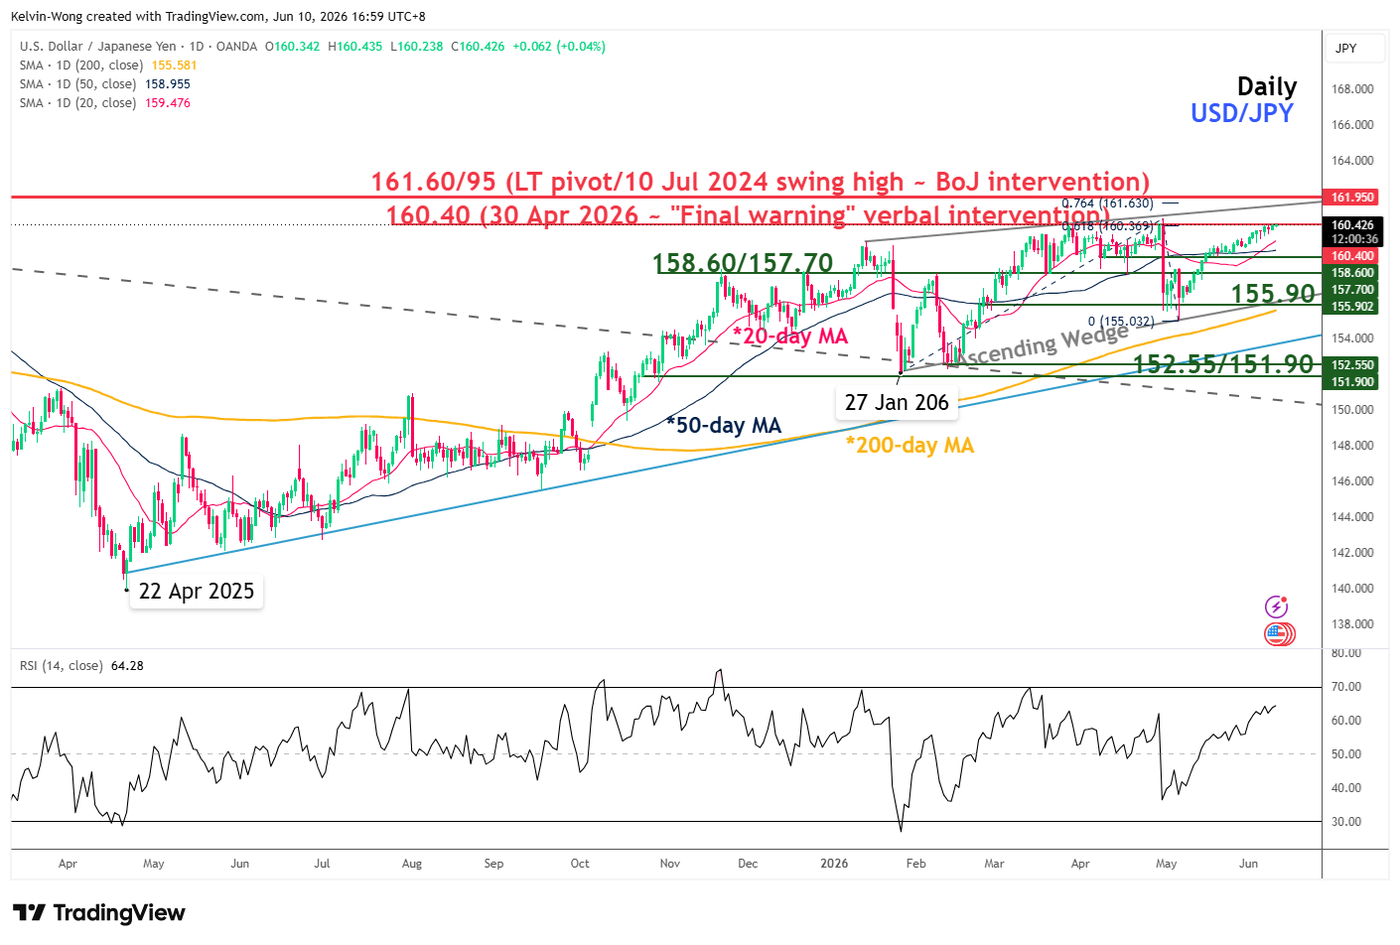
Fig. 3: USD/JPY minor trend as of 10 Jun 2026 (Source: TradingView). The information presented is historical information, and past performance is not indicative of future performance.
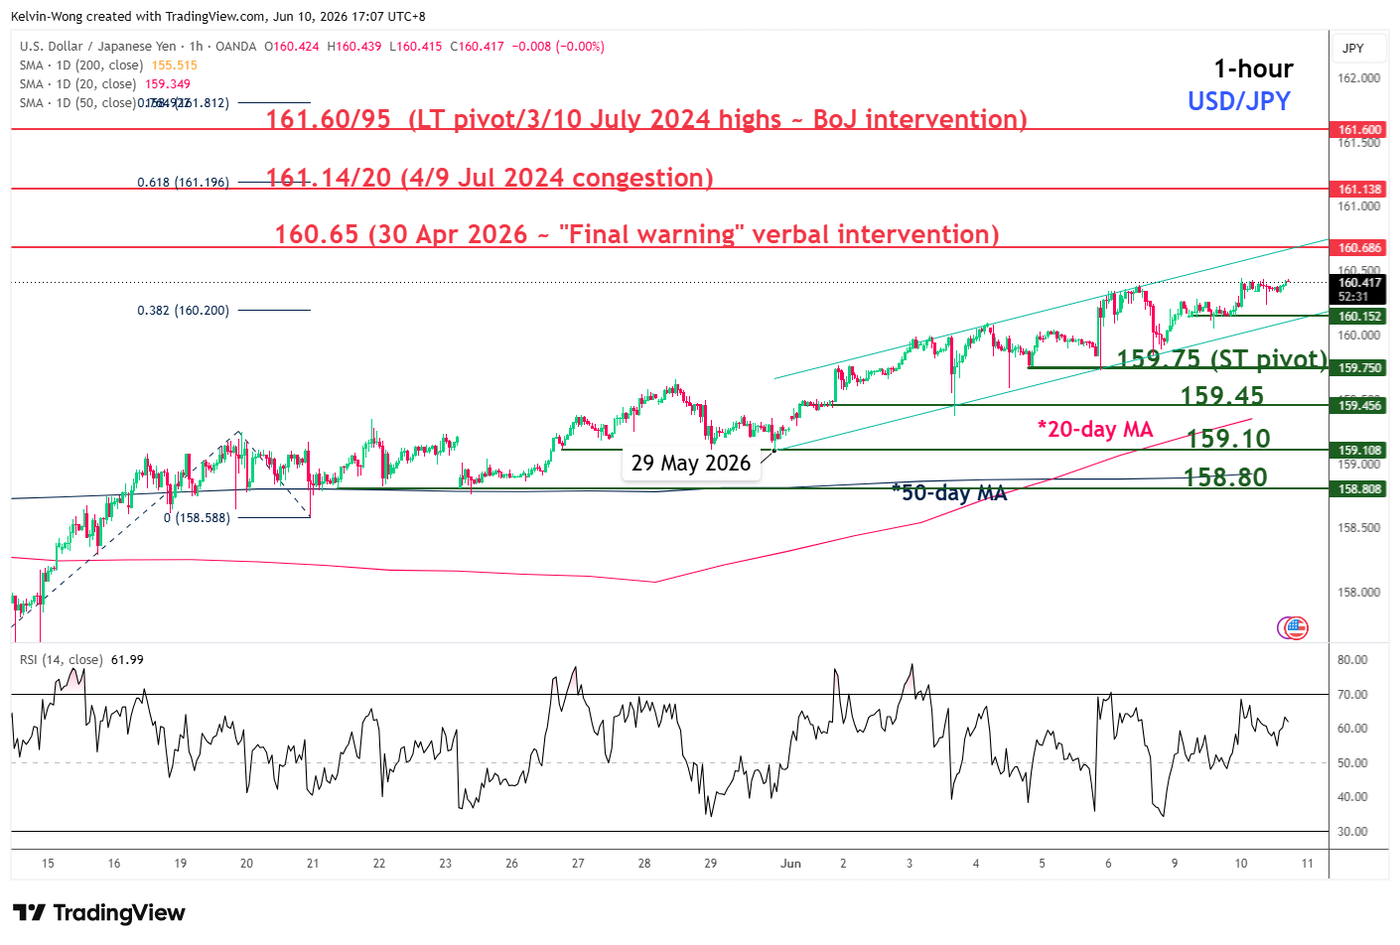
Trend bias: Minor uptrend with key short-term support pivotal at 159.75.
Resistances: 160.65 (30 Apr 2026 high), 161.14/20 (4/9 Jul 2024 congestion & Fibonacci extension), 161.60/95 (long-term pivot) (see Fig. 3).
Next supports: 159.45 (1/3 Jun 2026 congestion & 20-day MA), 159.10 (29 May 2026 low), 158.80 (21/25 May 2026 low & 50-day MA).
Key elements to support the short-term bullish bias on USD/JPY
- Price actions of the USD/JPY have been oscillating within a medium-term “Ascending Wedge” configuration since the 27 January 2026 low, with its upper boundary coming in at 161.60/95 (see Fig.2).
- The recent minor uptrend phase remains intact, as price action in USD/JPY continues to evolve within a minor ascending channel in place from the 29 May 2026 low at 159.10 (see Fig. 3).
- The hourly RSI momentum indicator remains short-term bullish, holding above the 50 level (see Fig. 3).
Oil: Escalation Is No Reason for a Rally
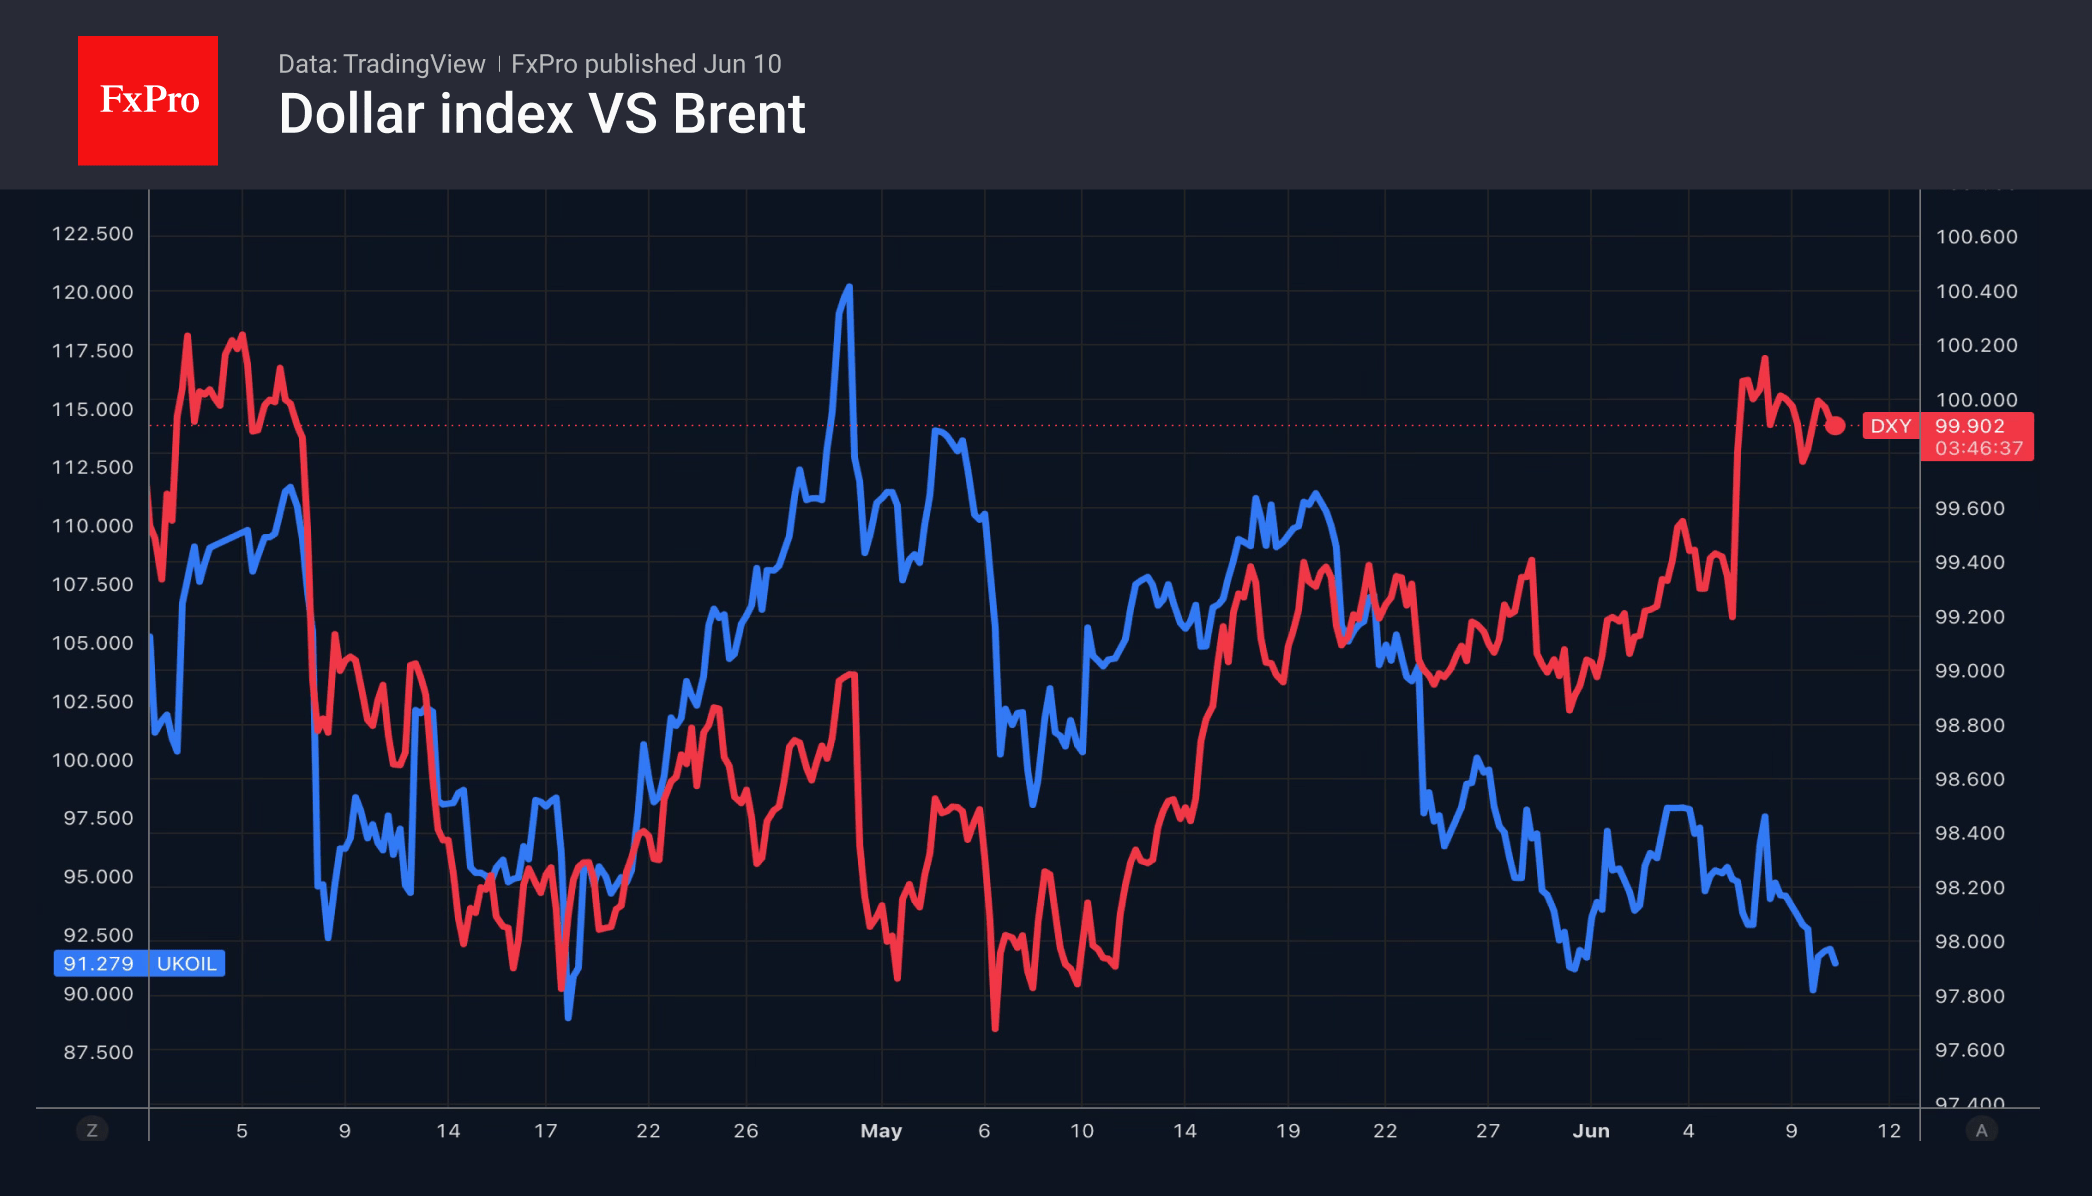
- The escalation in the Middle East has not led to a rise in Brent prices.
- The US dollar has been unable to capitalise on the favourable oil situation.
The US dollar has recorded modest gains amid the recent escalation of the conflict in the Middle East, while oil prices have fallen. This is typical behaviour during a relatively smooth reassessment of monetary policy prospects, rather than a nervous reaction to geopolitical events. A barrel of Brent crude is trading around $91, close to the lower end of the range over the past three months, despite clear signs of global stockpile depletion.
According to S&P Global Energy research, 500 million barrels are needed to replenish oil stocks outside the Persian Gulf. In other words, to return stocks to February levels by the end of the year, a surplus of 1 million barrels per day is required.
However, the market is paying more attention to the balance than to stocks. Brent is trading 30% above pre-conflict levels in the Middle East. At the same time, high prices are reducing global demand. China is a clear example, with oil imports falling to 7.8 million bpd in May, the lowest level in eight years. By comparison, the average for 2025 was almost 4 million bpd higher.
Coupled with record US energy exports, Saudi Arabia’s price cuts for its customers, and the resumption of supplies from Kuwait to Asia, these developments point to the oil market having adapted in recent weeks. Without this, oil would have been set to rise amid a 9.12-million-barrel decline in commercial stocks over the week and eight consecutive weeks of declines.
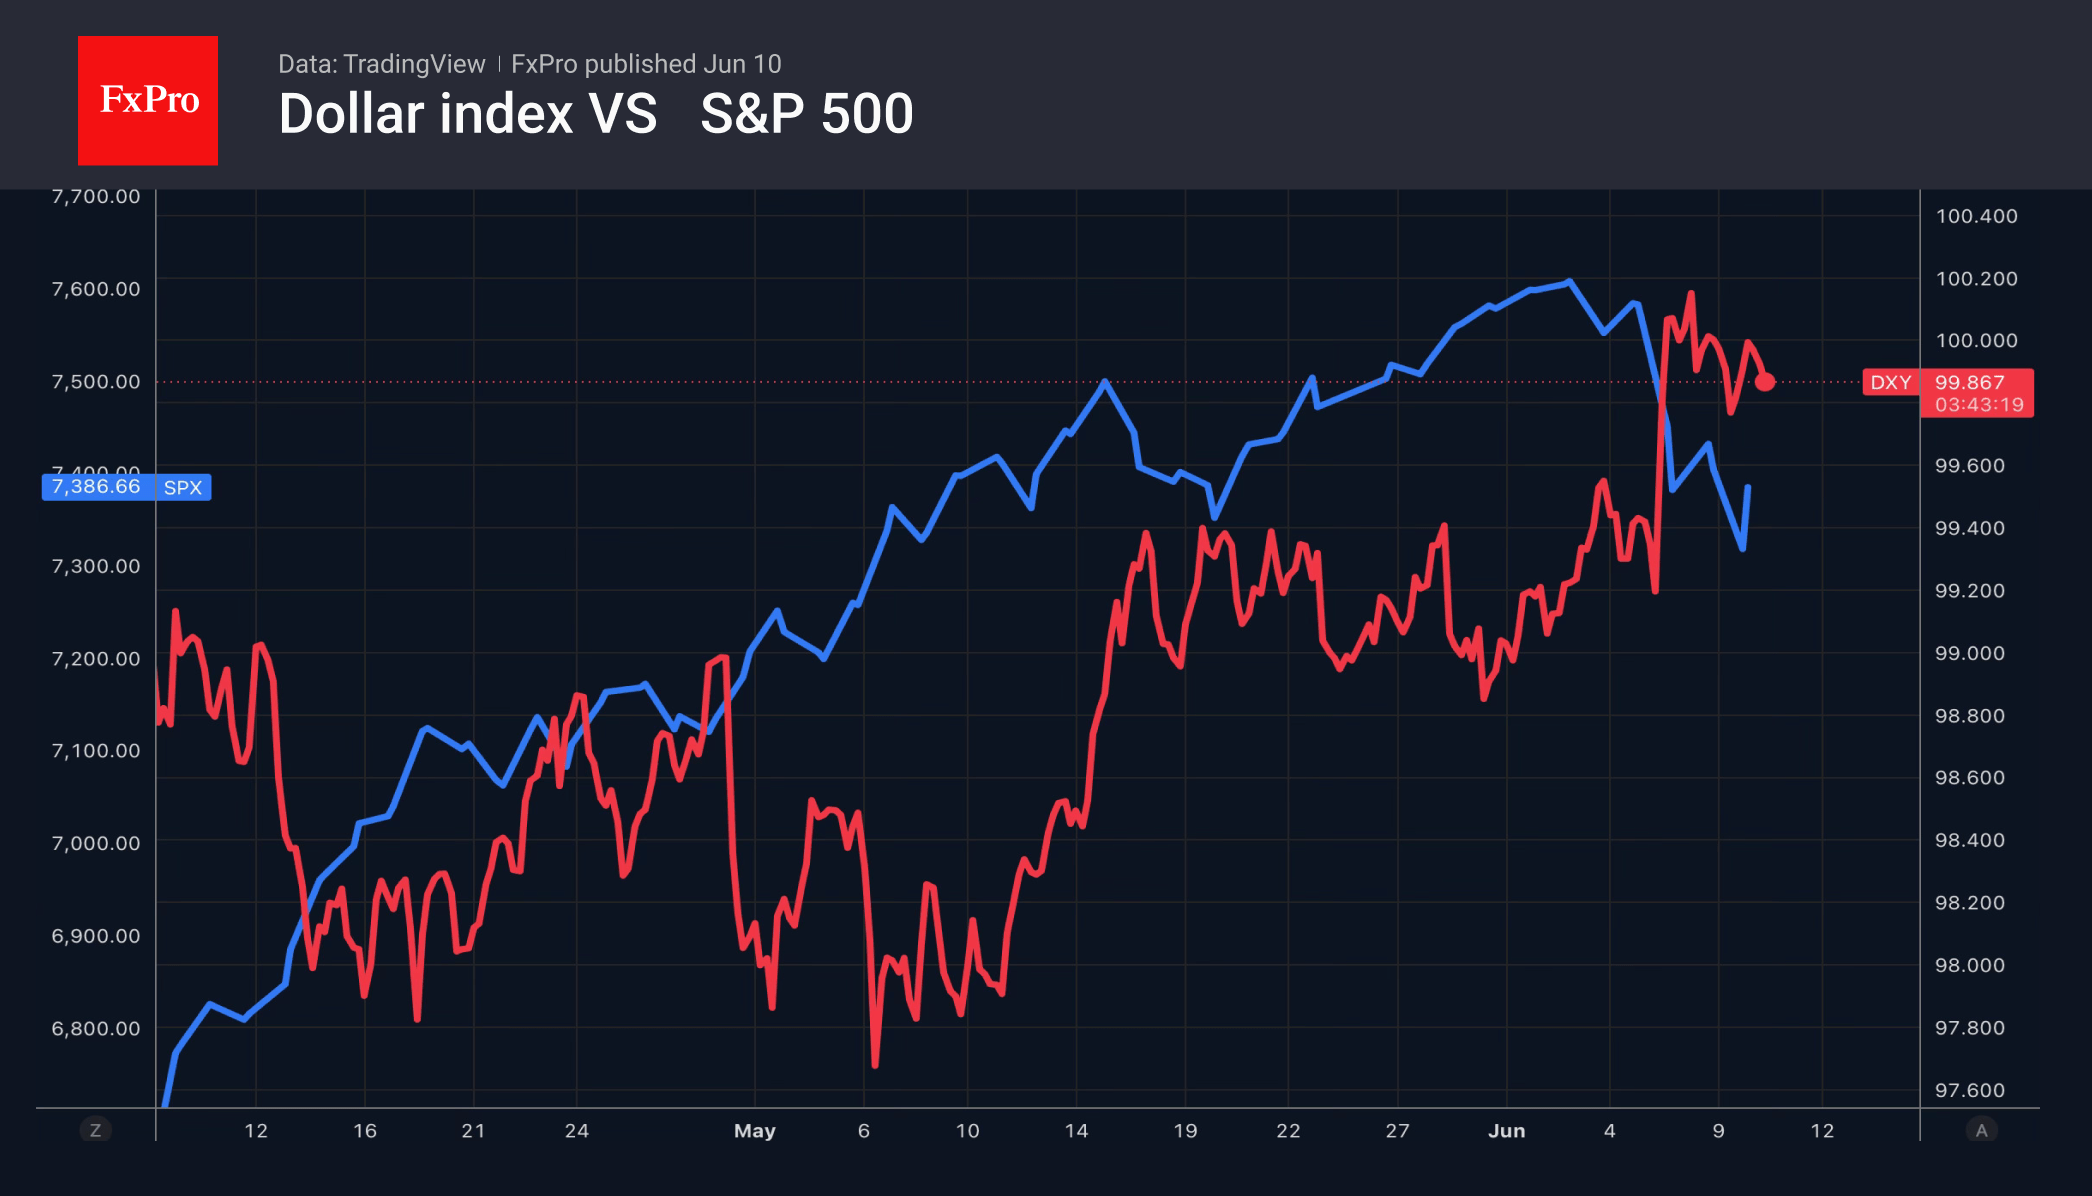
Without oil support, the US dollar is currently out of its depth. Neither the high demand for safe-haven assets nor the decline in global risk appetite—evident in the sell-off in equities and gold—is supporting the greenback. Fears that inflation will surge to three-year highs in May are fuelling rumours of a Fed rate hike and triggering sell-offs in tech stocks and the S&P 500.
Could inflation figures help the US dollar? Only if there are clear signs of accelerating price growth that even Warsh cannot ignore.
Bitcoin’s 200-Week Ma: History Points to an 11-Month Wait
Market Overview
The crypto market capitalisation has fallen by 2.7% to $2.12T, failing to establish a sustainable growth trajectory. At the time of writing, the market has not yet reached Friday’s lows, but it is quite possible that it will test this support level again before the end of the day as the rebound momentum fades. The top coins that fell the most over the day were Stellar (-7.9%), Dash (-7.6%) and Zcash (-7.3%), while SushiSwap (+0.7%), Cosmos (+0.7%) and Immutable (+0.5%) outperformed the market with minimal gains.
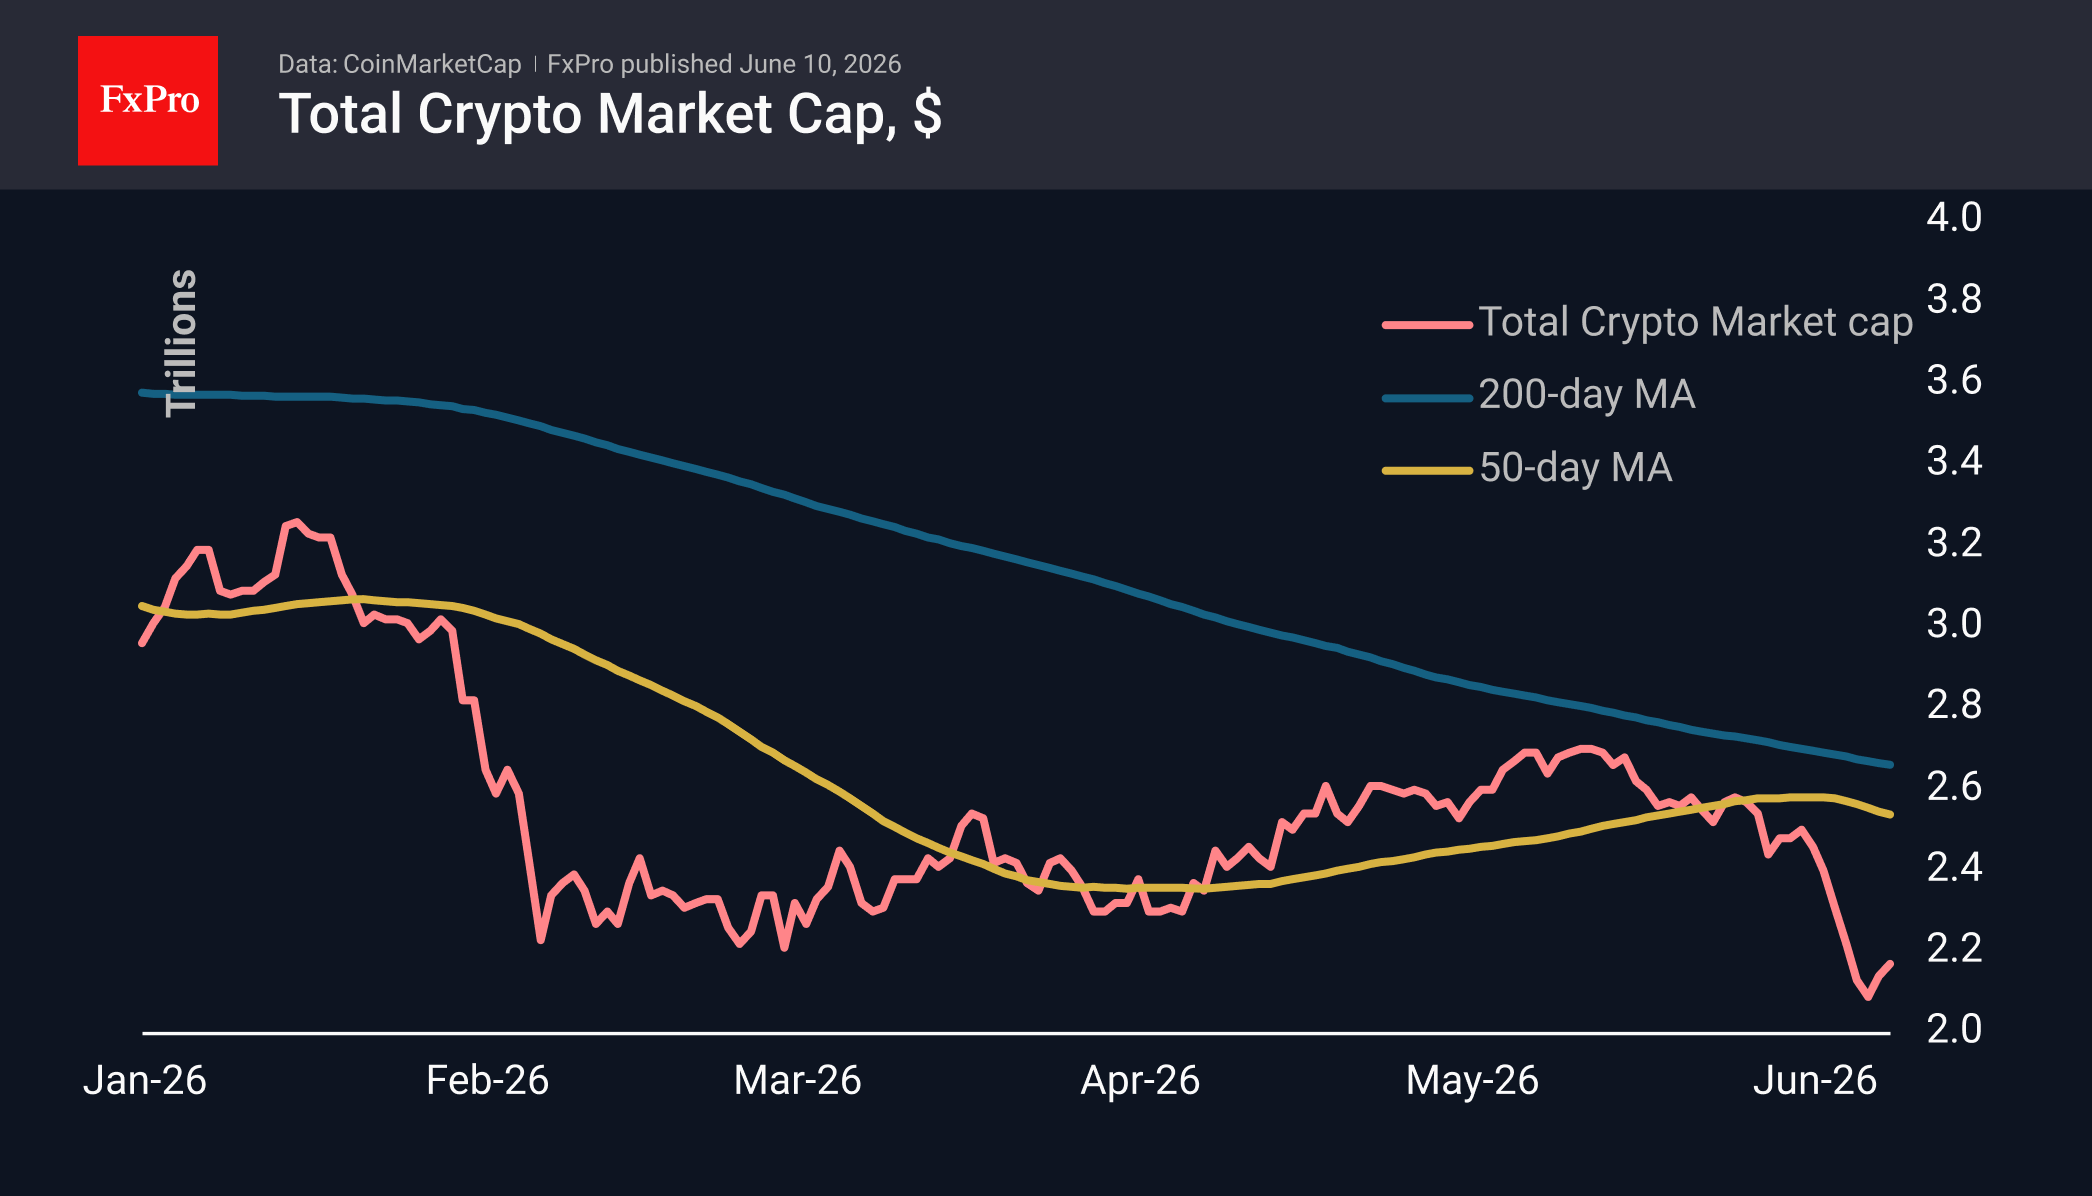
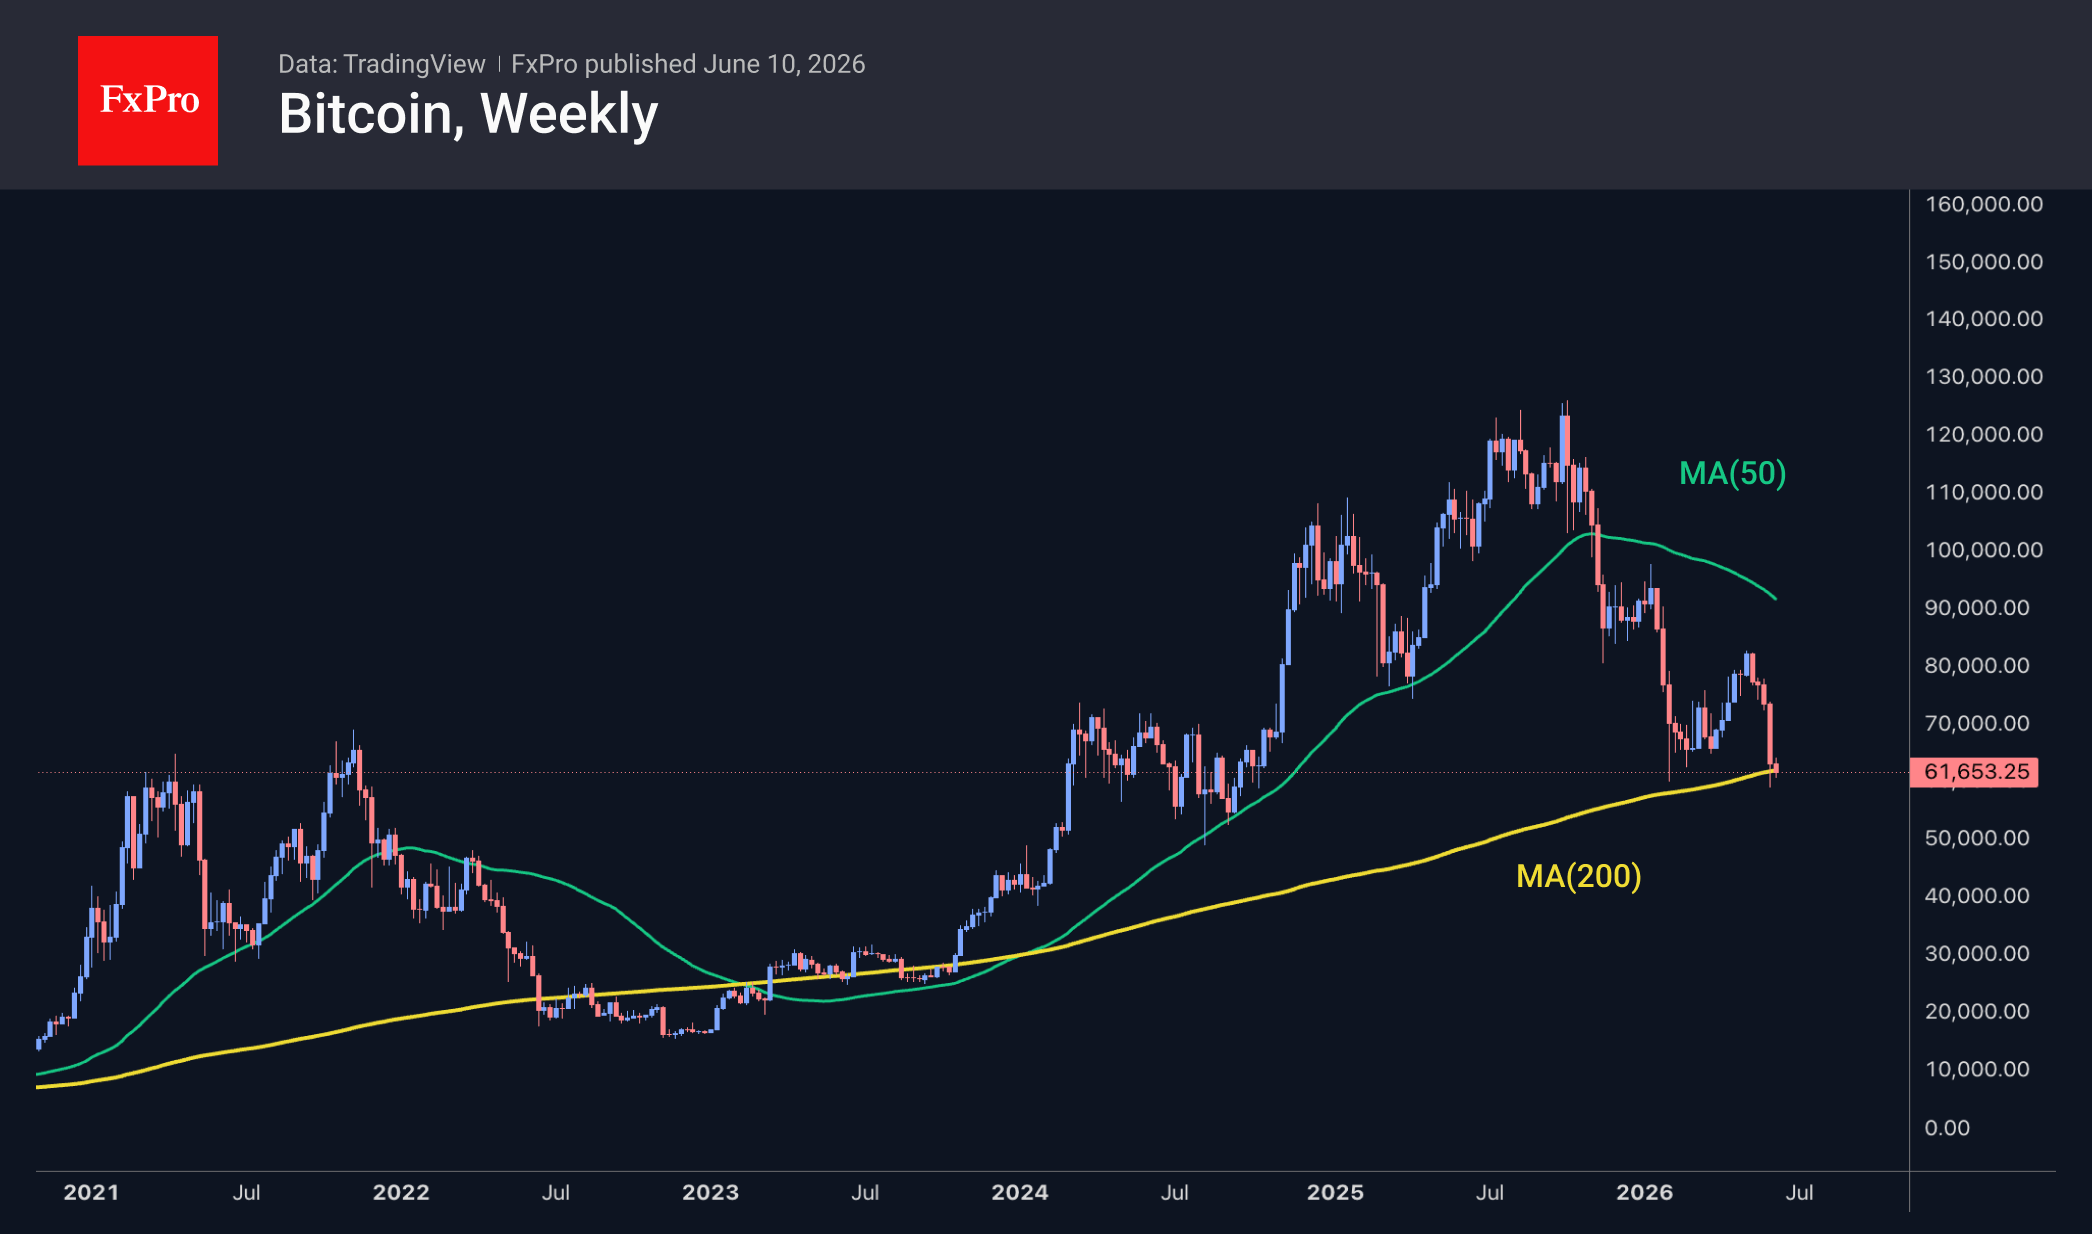
Bitcoin fell below the $61K level again on Tuesday amid a renewed decline in stock indices. This was followed by a slight rebound and current price stabilisation near $61.5K. It appears that a sell-on-rally trend is prevailing in the leading cryptocurrency. The history of the 200-week moving average over the last 11 years (prior to this, the market had not dipped below it) shows that the average time spent near it is almost 11 months, suggesting a very long bear market. The exception was the Covid crash in March 2020, as the subsequent policy of easy central bank money and spending restrictions led to a rapid price recovery. As markets expect interest rate hikes, we should not count on a short-term rebound until there is a global extreme shock.
News Background
CryptoQuant has observed an increase in inflows to Bitcoin exchanges of coins that have been dormant for between three months and a year. Such activity by medium-term investors could create additional selling pressure and hinder the recovery.
The recent decline in BTC was driven by spot market selling rather than speculative activity in the derivatives market, according to 10X Research, which expects a short-term recovery in Bitcoin by the end of the week.
Two key factors will influence Bitcoin in the second half of the year: Strategy’s ability to fund $1.7 billion in dividend payments and the passage of the US CLARITY bill on stablecoin yields, according to JPMorgan. CLARITY could not only clarify the regulatory framework for the US crypto market but also bolster confidence in the crypto industry and support the inflow of corporate capital.
Major US financial firms view Bitcoin’s recent drop to $60K as a good opportunity to replenish their reserves, rather than a cause for concern, according to Coinbase. They view Bitcoin as a long-term asset worth accumulating.
Strategy shareholders have approved a change to the dividend payment schedule for STRC preference shares. Instead of monthly payments, the company will pay dividends twice a month, in half-payments. Strategy CEO Fong Le believes this should stabilise the value of the shares, increase liquidity and boost demand for them.
AUD/USD Faces 0.70 Breakdown If US Core CPI Tops 3%
AUD/USD is sitting on the edge of a cliff, and US inflation data may determine whether it falls.
Global markets have struggled to regain their footing after last week's selloff. Attempts to revive the AI trade have faded quickly, while concerns over persistent inflation and renewed US-Iran tensions continue to weigh on sentiment. The combination has created a fragile environment where investors are increasingly focused on one question: is inflation becoming a bigger problem again in the US?
Today's CPI report could provide the answer. Markets already expect headline inflation to jump from 3.8% to 4.2%, with core CPI rising from 2.8% to 2.9%. But the number that matters most may be 3%. If core inflation pushes above that threshold, investors could be forced to seriously consider the possibility that Fed would return tightening. Following last week's strong payrolls report, policymakers have little reason to worry about labor-market weakness. Inflation is now the main story.
That matters because the market's triple threat remains fully intact. AI valuation concerns continue to hang over equities. The Middle East conflict continues to threaten energy markets and inflation. And stronger inflation would reinforce higher-for-longer interest-rate expectations. Together, these forces create a difficult environment for risk-sensitive currencies.
Australian Dollar sits near the center of that storm. Traditionally, Aussie struggles when risk appetite deteriorates and Dollar strengthens. But the currency faces an additional challenge this time. Earlier this year, investors aggressively priced further RBA tightening as inflation remained stubbornly high. That narrative is now being reassessed.
The RBA has already delivered three consecutive rate hikes, taking the cash rate to 4.35%. Yet recent economic data have become noticeably softer. Employment indicators have weakened, consumer spending has lost momentum, and confidence measures remain subdued. While another hike later this year cannot be ruled out, the market is becoming increasingly skeptical that policymakers will need to do much more.
That shift is already visible. Major Australian banks including CBA and NAB now believe the tightening cycle is over, expecting rates to remain at 4.35% through the end of next year. This repricing has removed an important source of support for Aussie.
The problem is not that RBA has become dovish. Rather, markets previously expected far more tightening than now appears likely. As those expectations unwind, Australian Dollar has struggled to maintain upward momentum.
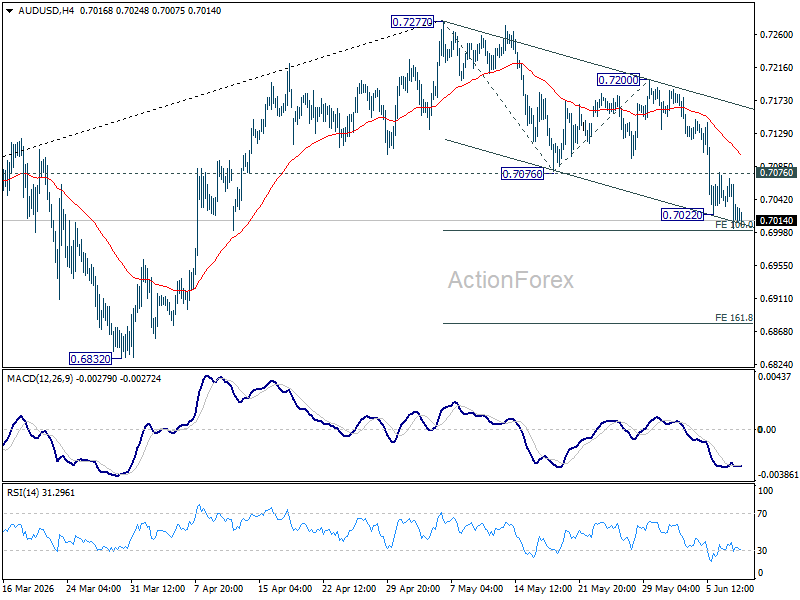
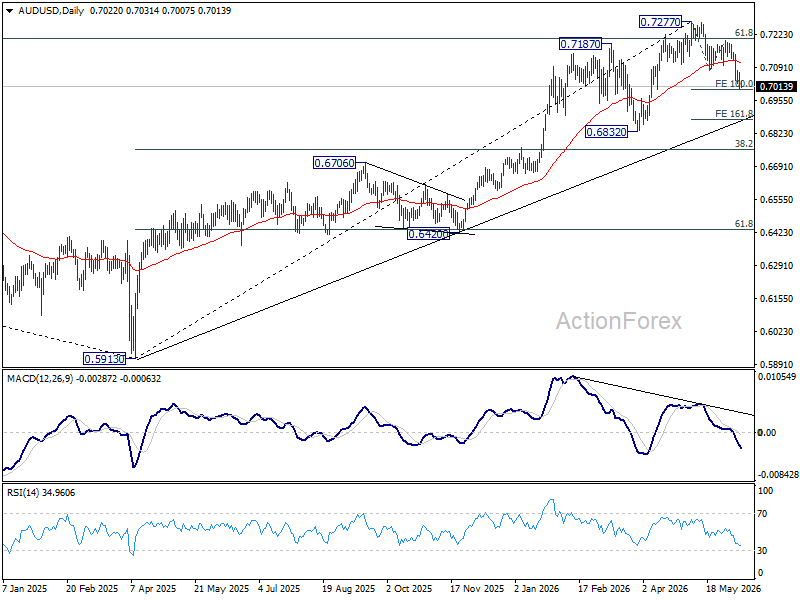
Technically, AUD/USD's fall from 0.7277 resumed after brief consolidations and intraday bias is back on the downside. Immediate focus is now on 100% projection of 0.7277 to 0.7076 from 0.7200 at 0.6999. Firm break there could prompt downside acceleration and target 161.8% projection at 0.6875, or even further to 0.6832 structural support before finding a bottom.
The market is already nervous. A hotter inflation reading could be the catalyst that turns caution into outright risk aversion—and AUD/USD into one of its clearest casualties.
Gold (XAU/USD) Faces Persistent Selling Pressure
Gold (XAU/USD) fell to 4,174 USD per troy ounce on Wednesday, reaching its lowest level since late March.
Pressure on the precious metal intensified following a new escalation of tensions in the Middle East. The US launched strikes against Iranian targets after reports that an American helicopter had been shot down. This latest development has once again raised doubts about the durability of the current truce and the prospects for a broader peace agreement.
Another key factor remains the situation surrounding the Strait of Hormuz. Ongoing disruptions to shipping through the region continue to constrain energy supplies and support elevated oil prices. These disruptions, in turn, are fuelling concerns that inflationary pressures across the global economy may persist for longer than expected.
Higher energy costs are prompting investors to reassess the monetary policy outlook for major central banks. Markets are increasingly pricing in a prolonged period of elevated interest rates and are no longer ruling out additional policy tightening if inflation remains stubbornly high.
Investor focus is now on upcoming US inflation data, which could provide important clues regarding the Federal Reserve’s next steps. The US dollar is also receiving support from strong labour market figures, which have reinforced expectations that the Fed could consider another interest rate increase before the end of the year.
As a result, the outlook for Gold (XAU/USD) remains broadly bearish.
Technical Analysis
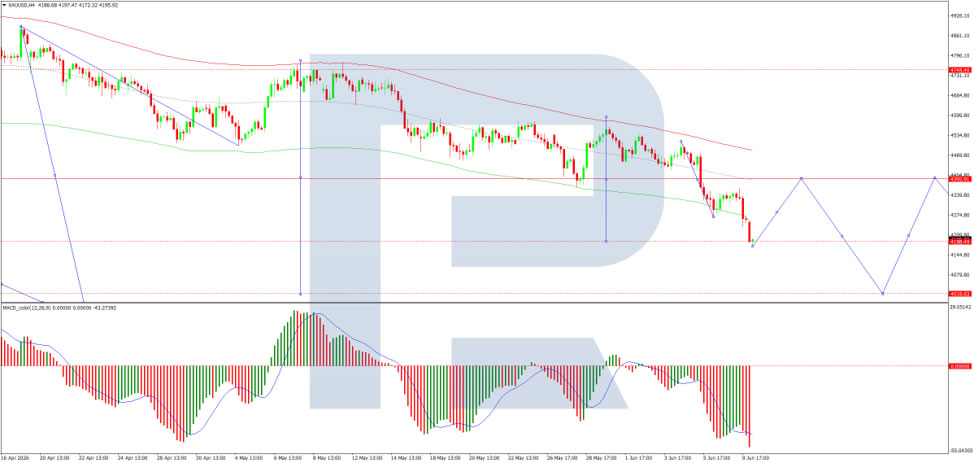
On the H4 chart, XAU/USD is trading within a consolidation range around the 4,393 USD level before breaking lower and extending its decline to 4,175 USD. A corrective rebound towards 4,390 USD is possible in the near term, after which the market may resume its decline towards 4,238 USD, with scope for a further move to 4,088 USD.
The MACD indicator confirms the prevailing bearish momentum. Its signal line remains below the centre line and continues to point firmly downwards, although early signs of a potential reversal are emerging.
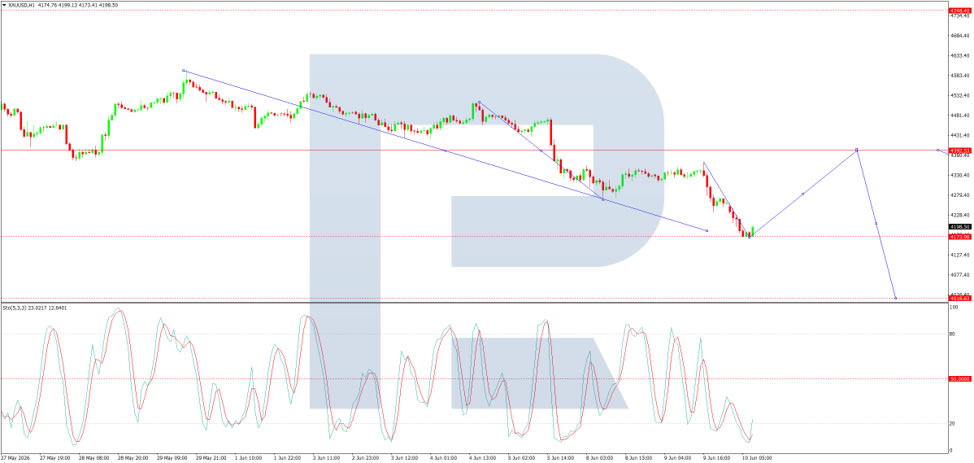
On the H1 chart, the market broke below the 4,270 USD level and moved lower towards 4,175 USD. A corrective recovery towards 4,329 USD, as a retest from below, is possible before another decline towards 4,088 USD. After that, a broader rebound towards 4,390 USD may develop.
The Stochastic oscillator supports this scenario. Its signal line remains below the 20 level but is beginning to turn upwards towards 80, indicating that a short-term corrective recovery may be gathering momentum.
Conclusion
Gold remains under significant pressure as geopolitical tensions, elevated energy prices, and expectations of prolonged restrictive monetary policy continue to support the US dollar. While technical indicators suggest a short-term corrective rebound, the broader outlook remains bearish unless market sentiment or inflation expectations change materially.
Bitcoin $BTCUSD Elliott Wave Analysis: Forecasting the Path
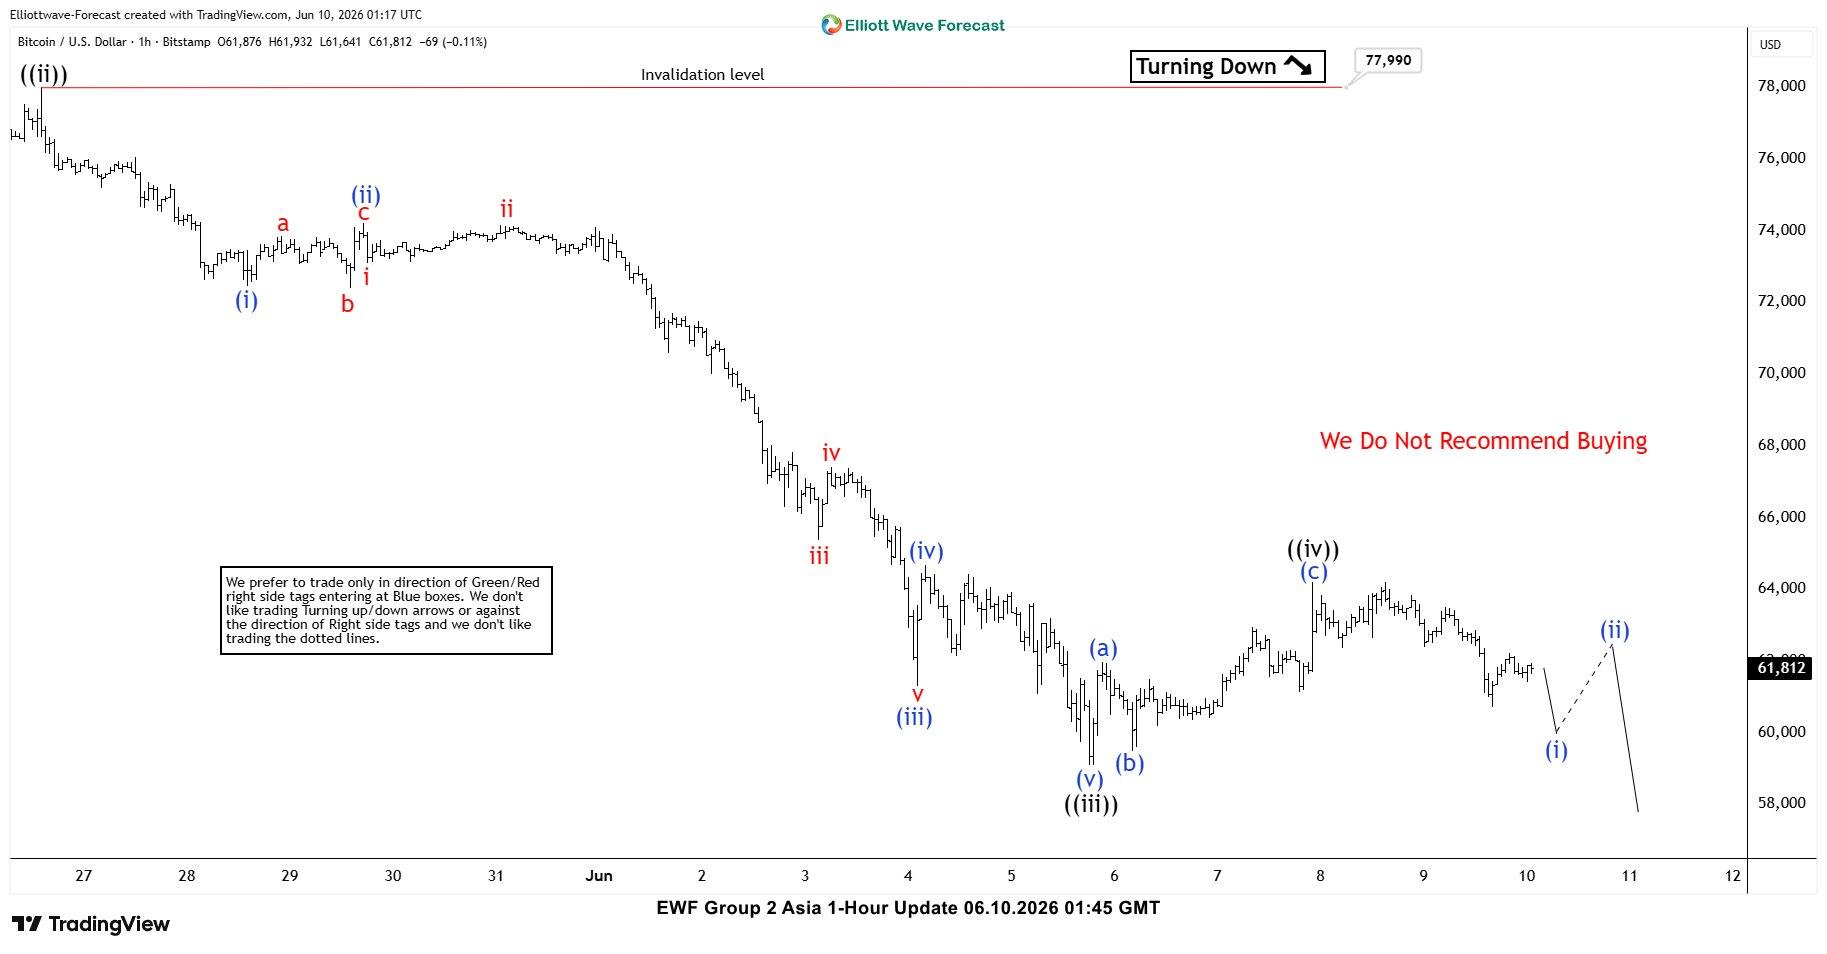
Hello traders. In this technical article we’re going to look at the Elliott Wave charts of Bitcoin (BTCUSD) published in members area of the website. As our members know, we have been calling for the decline in BTCUSD since last year. The crypto market has continued to trade lower as expected. The main target area has not been reached yet, and we believe further downside may be seen in the coming days.
In this discussion, we will break down the Elliott Wave forecast and present the target zone.
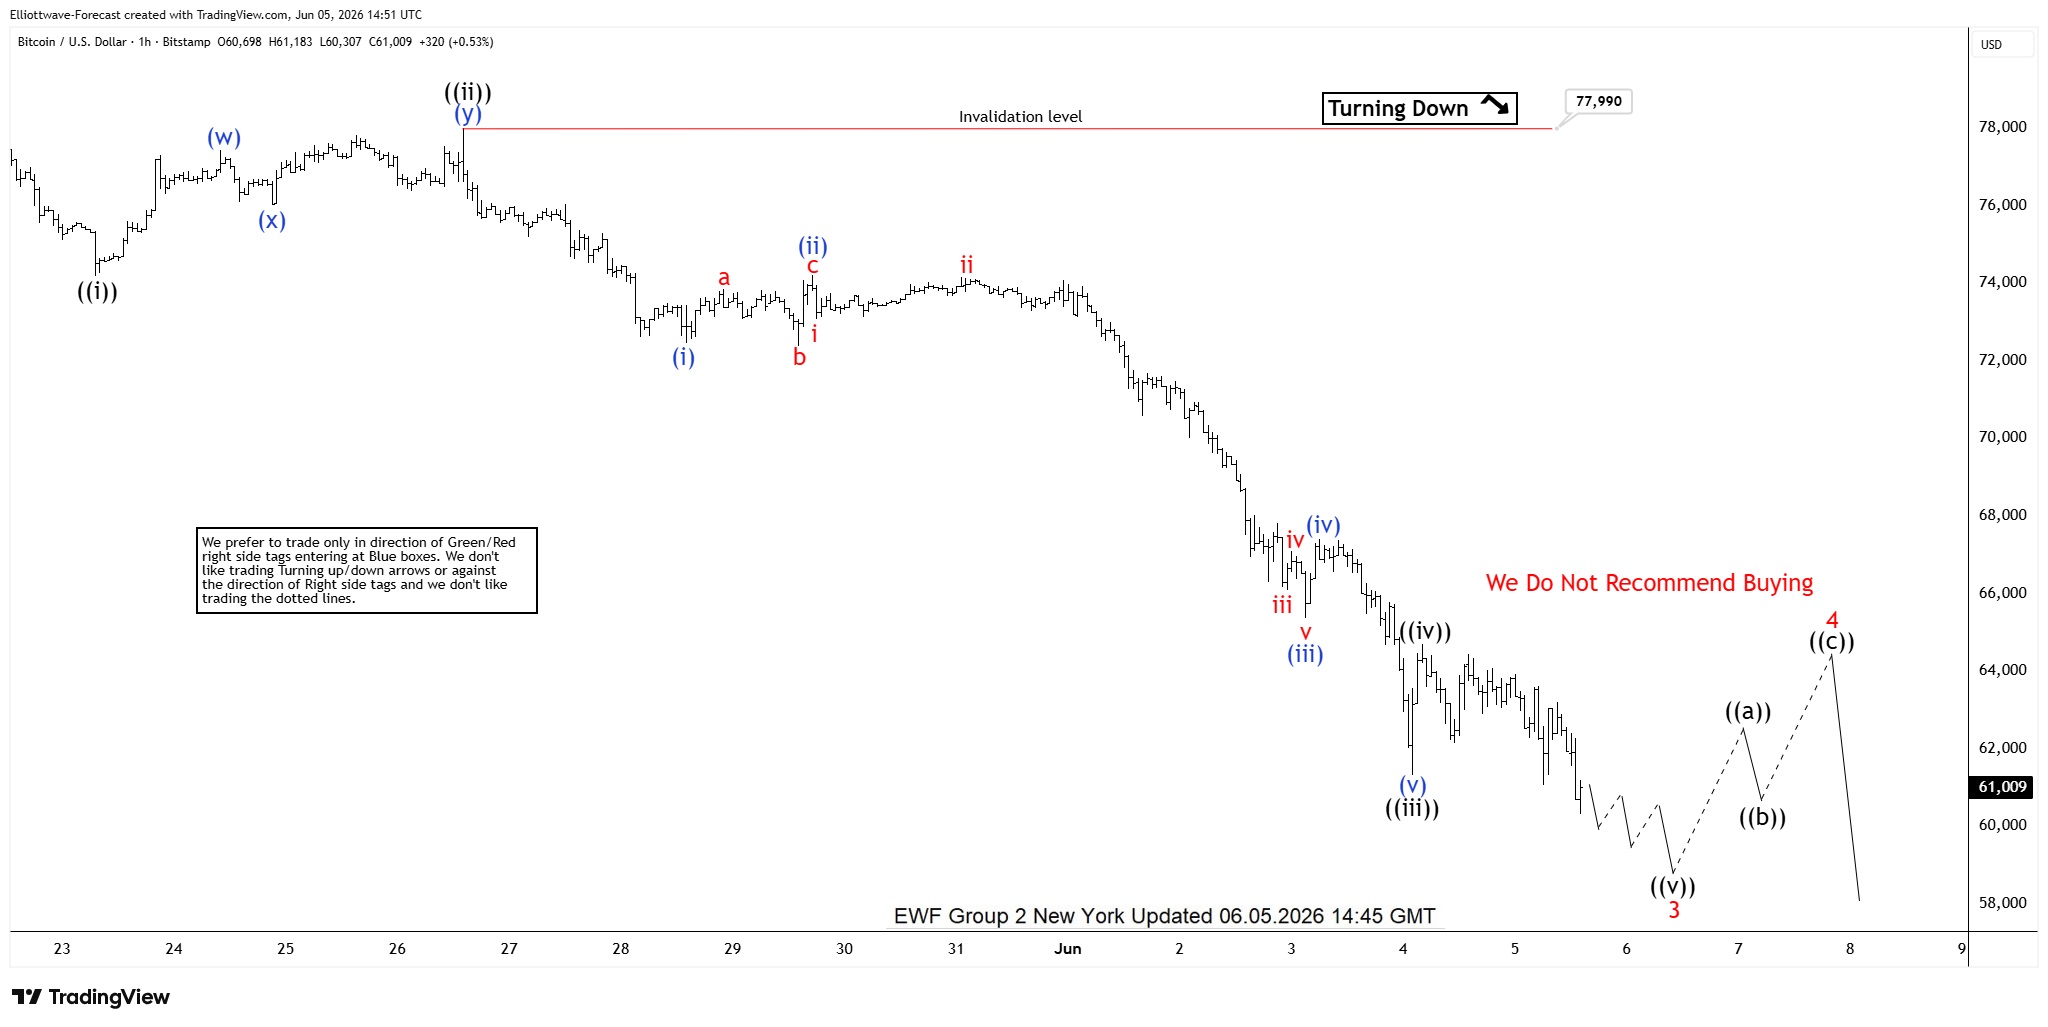
BTCUSD Elliott Wave 1 Hour Chart 06.05.2026
The current view suggests Bitcoin is developing impulsive bearish sequences, with wave ((v)) of wave 3 (red) nearing completion.
As our members know, the typical target area for wave ((v)) is projected using the 1.236–1.618 inverse Fibonacci extension of wave ((iv)). In this case, that zone comes in at 60,555–55,992. From this area, we expect a corrective three-wave bounce before the downside trend resumes.
Did you know ? 90% of traders fail because they don’t understand market patterns. Are you in the top 10%? Test yourself with this advanced Elliott Wave Test
Official trading strategy on How to trade 3, 7, or 11 swing and equal leg is explained in details in Educational Video, available for members viewing inside the membership area.
BTCUSD Elliott Wave 1 Hour Chart 06.10.2026
Bitcoin found buyers in the 60,555–55,992 area and made a three-wave bounce as expected. The overall view remains unchanged, with only a minor adjustment in wave counting.
At this stage, we consider wave ((iv)) completed at 64,200. While price remains below that high, we expect further downside within wave ((v)).
We will use the same approach to project the wave ((v)) target zone, based on the 1.236–1.618 inverse Fibonacci extension of wave ((iv)), which comes in at 58,020–56,080.
Important note: Our analysis is not based on Elliott Wave in isolation. We perform detailed higher-time-frame cycle analysis, which shows an incomplete market structure. This is one of the key drivers of price action, along with correlation analysis and broader market context.
We also teach our members in live analysis sessions how to identify incomplete bullish and bearish sequences. Even a 14-day trial, is enough to noticeably improve your trading analysis and forecasting approach.
Keep in mind that market is dynamic and presented view could have changed in the mean time. You can check most recent charts with target levels in the membership area of the site. Best instruments to trade are those having incomplete bullish or bearish swings sequences. We put them in Sequence Report and best among them are shown in the Live Trading Room
Euro Stabilises After Sell-Off as Markets Await US CPI and Bank of Canada Meeting
The euro is showing signs of a modest recovery following a sharp decline triggered by a strong US employment report and increased demand for safe-haven assets amid escalating geopolitical tensions in the Middle East. Robust Nonfarm Payrolls data confirmed the resilience of the US labour market, allowing the dollar to strengthen against most major peers and reinforcing expectations that the Federal Reserve will maintain a restrictive policy stance.
Investor attention today will be focused on the release of US inflation data. According to forecasts, annual consumer price growth may accelerate to 4.2% from 3.8% previously, while core inflation is expected to rise to 2.9% from 2.8%. Should the figures exceed expectations, markets may once again reassess the outlook for Federal Reserve rate cuts, providing additional support for the US dollar.
Another key event will be the Bank of Canada policy meeting. The central bank is widely expected to leave its benchmark interest rate unchanged at 2.25%, although market participants will be paying close attention to the accompanying statement and policymakers' comments regarding the future path of monetary policy. Any signals pointing towards further easing could weigh on the Canadian dollar and support gains in EUR/CAD.
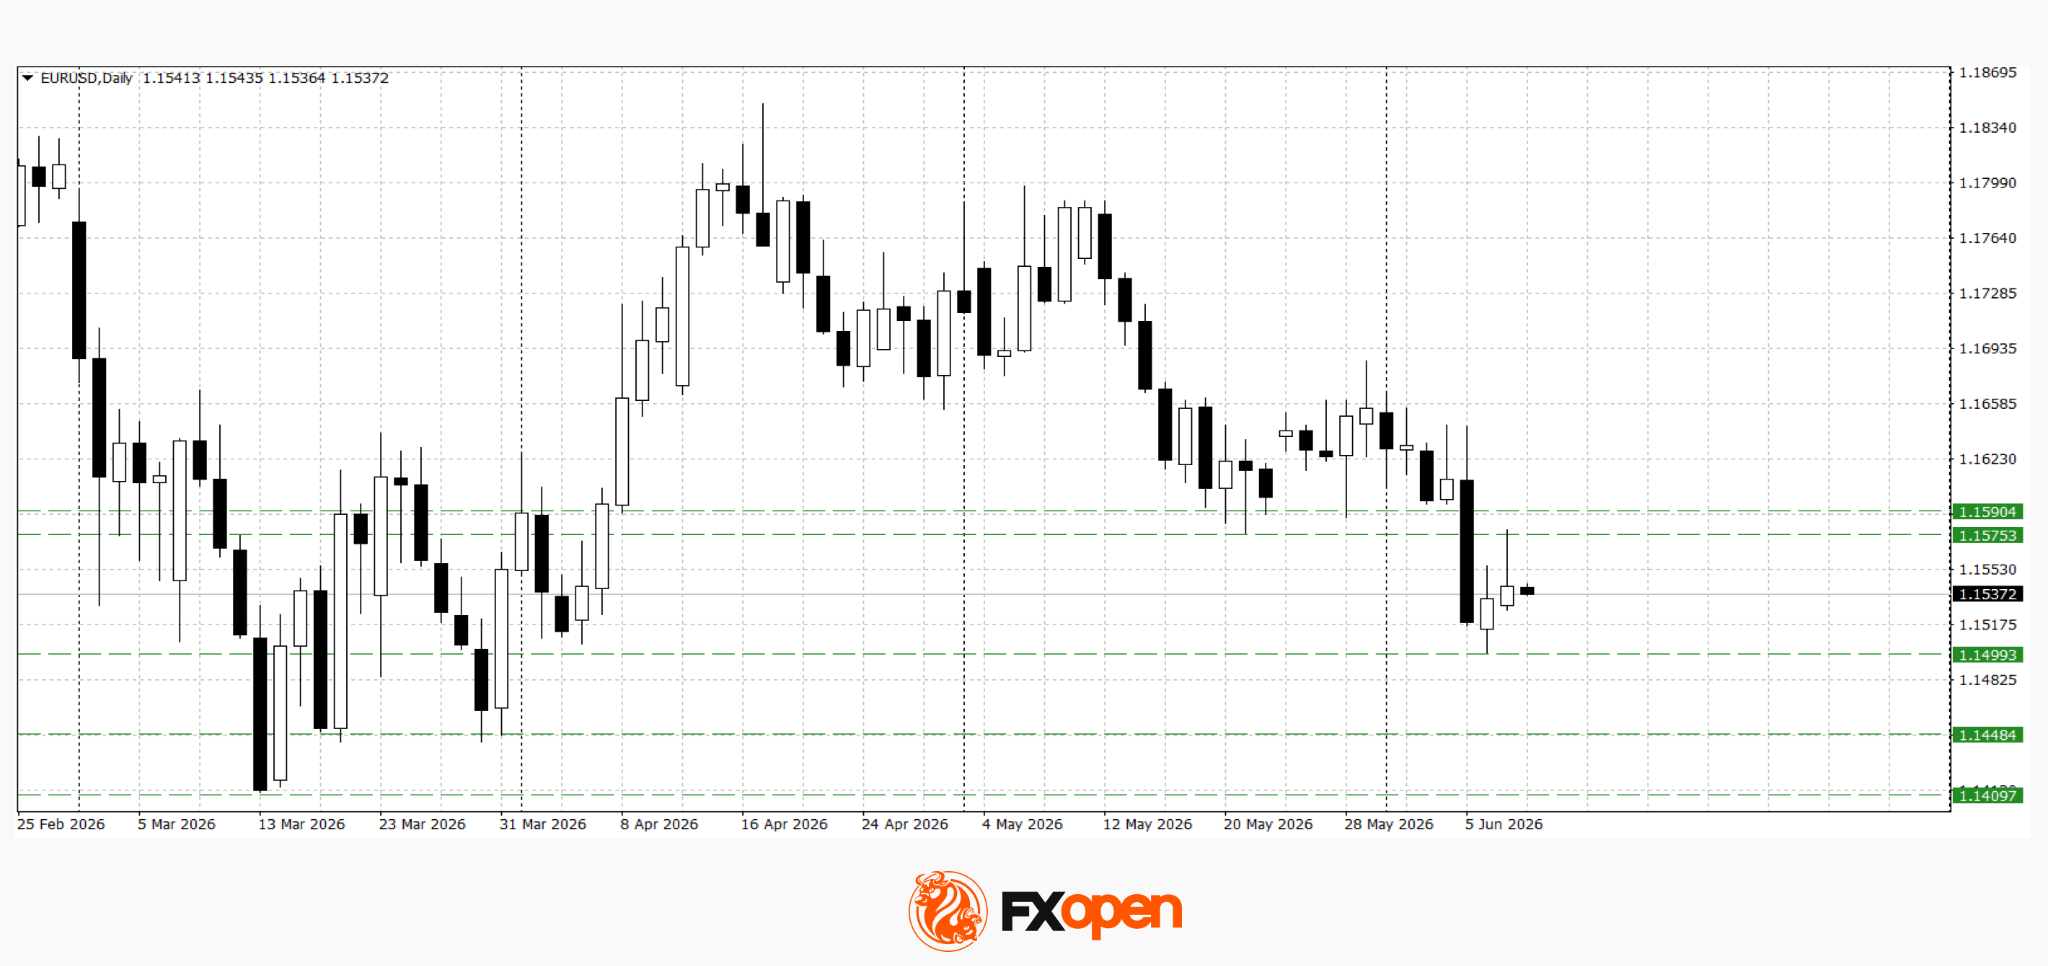
EUR/USD
After breaking below the key support level at 1.1580 last week, EUR/USD buyers managed to push the pair back towards this area. Technical analysis suggests the pair may retest support near 1.1500. A break below this level followed by sustained trading underneath it could trigger a fresh bearish impulse, with initial downside targets in the 1.1400–1.1440 region. The bearish scenario would be invalidated by a decisive move back above 1.1580.
Key events for EUR/USD:
- Today at 12:30 (GMT+3): German 10-year government bond auction;
- Today at 15:30 (GMT+3): US Consumer Price Index (CPI);
- Tomorrow at 15:00 (GMT+3): Germany's seasonally unadjusted current account balance.
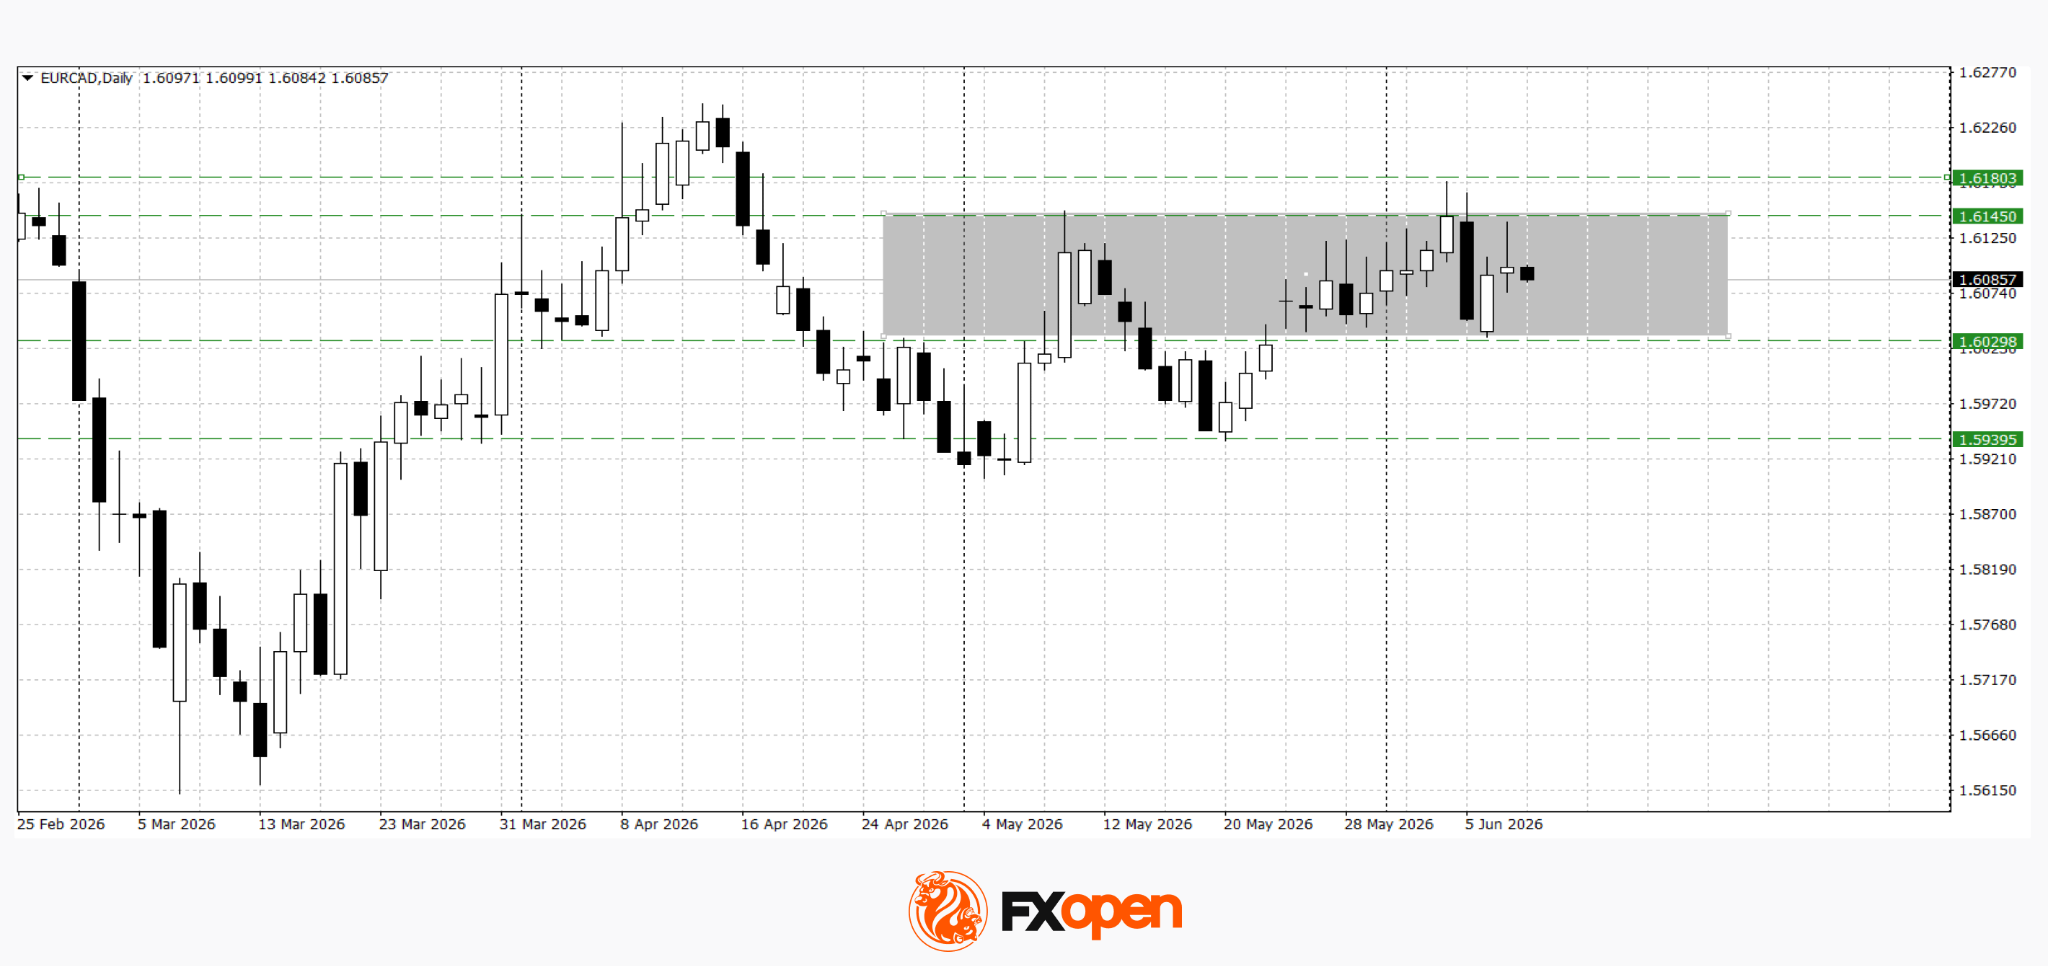
EUR/CAD
EUR/CAD is also undergoing a corrective recovery following its previous decline, although further direction will largely depend on the outcome of the Bank of Canada meeting and the market's reaction to US inflation data. Ahead of these releases, traders are likely to remain cautious, potentially encouraging consolidation around current levels.
Technical analysis points to range-bound trading within the 1.6030–1.6150 corridor. Price behaviour near these boundaries over the coming sessions may provide clearer signals regarding the pair's next directional move.
Key events for EUR/CAD:
- Today at 16:45 (GMT+3): Bank of Canada interest rate decision;
- Today at 17:30 (GMT+3): US crude oil inventories;
- Today at 17:30 (GMT+3): Bank of Canada press conference.
Trade over 50 forex markets 24 hours a day with FXOpen. Take advantage of low commissions, deep liquidity, and spreads from 0.0 pips (additional fees may apply). Open your FXOpen account now or learn more about trading forex with FXOpen.
This article represents the opinion of the Companies operating under the FXOpen brand only. It is not to be construed as an offer, solicitation, or recommendation with respect to products and services provided by the Companies operating under the FXOpen brand, nor is it to be considered financial advice.
Sunrise Market Commentary
Markets
Yesterday’s global market price action lacked a clear, unique narrative resulting in erratic-like trading throughout the session. Headlines on the conflict in the Middle-East/Iran again were far from consistent. President Trump announcing an end to (escalating) hostilities between Israel and Iran and hinting at a deal over the next days initially eased tensions. However, later in US dealings, headlines on the US responding to a reported Iran attack on a US helicopter once again illustrated the fragility of the ceasefire and persistent nervousness (and probably) mutual distrust on the way to a deal. This, together with lingering tech/AI uncertainty weighed on US equities. US indices closed mixed (Dow +0.17%, Nasdaq -0.97%) admittedly off the intraday lows, but the picture still looks fragile. (Nasdaq struggling not the fall below the 25.700 support area.) Interestingly, the headlines again had only limited impact on the oil price (Brent close near $91.5 p/b). In this context, the tentative risk-off also had no negative impact on bond markets. US yields even eased between 4.6 bps (5- & 10-y) and 3.9 bps (30-y). A $58 bln 3-y Treasury auction was ok, but with limited impact on the daily market dynamics. US eco data mostly were second tier (weak NFIB small business confidence), but with only limited impact on yield markets as they looked forward to today’s US CPI data. German yields in a similar move declined between 3.8 bps (2-y) and 0.2 bps (30-y). A mixed story for the dollar as well. After setting an intra-day low early in US dealings, the headlines on the helicopter incident and building risk-off reverted intraday USD-losses. DXY closed marginally lower in a daily perspective near 99.9. EUR/USD gained marginally, but off the intraday highs (close 1.1543). The yen struggles with USD/JPY holding a tight range north of USD/JPY 160.
Major Asian equity indices (Japan, China, Japan and South Korea) mostly trade in negative territory, but there are exceptions (Australia, India,…). US yields gain 1-2 bps. The dollar also eases slightly (DXY 99.9, EUR/USD 1.155). Aside from (often noisy) headlines on the developments in the Iran conflict, the market focus is on US May CPI inflation data. Consensus sees headline inflation at 0.5% M/M and 4.2 Y/Y and core at 0.3% M/M and 2.9% Y/Y, in line with our KBC model nowcast. A combination of last week’s strong US activity data and inflation moving even further away from the Fed inflation target probably will keep the debate on Fed tightening alive. In this context, a big negative surprise is probably needed to backtrack on the rise in US yields. In theory, this also should favour the dollar, especially if it would coincide with a more fragile risk sentiment (US triggering a global tightening of financial conditions?) Later today, a $39 bln 10-y US Treasury auction will be an interesting pointer for investor appetite for US bond with longer maturities.
News & Views
Chinese inflation came in below expectations in May with headline price pressures matching April’s 1.2% instead of accelerating to 1.3%. A core gauge decelerated to 1.1% from 1.2%. It marks a stark contrast with rising producer price inflation. May PPI shot up from 2.8% to 3.9%, the quickest since July 2022. Details showed intensifying pressures in mining, raw materials and manufacturing (i.e. the early stages of the supply chain), revealing the impact coming from the Iran war. But weak domestic demand is preventing companies from pass-through to the end-consumer, resulting in a muted CPI print. The latter was also heavily supported by gasoline prices (up 23.5% y/y) and travel prices (4.3%). Bloomberg calculated that without those, May CPI would have risen by just 0.5%. Food prices fell 1.7% and services inflation eased from 0.9% to 0.8%.
The Energy Information Administration (EIA) is projecting further record in US power consumption in 2026 and 2027 after already hitting its second straight annual record high in 2025. The surge is in large part driven by data centers dedicated to AI and cryptocurrency, the agency said. The EIA expects that the electricity demand increase in the commercial sector will cause it to outpace residential demand in 2026 in what would be the first time ever. The EIA also said that the share of power generation from coal will slide from 17% last year to 16% and 15% in 2026 and 2027. Natural gas’ share is expected to hold at 40% in 2026-2027, the same as in 2025. Renewable energy generation meanwhile will rise from 24% last year to 27% in 2027. Nuclear power fills the remaining gap (18%).
Why US CPI and Pce Inflation Figures Diverge
US PCE inflation has outstripped CPI inflation in recent months (in contrast to historical trends). This was especially the case for core inflation. The divergence is caused by important weight differences between PCE and CPI inflation. As CPI measures price changes directly paid for by consumers, housing and vehicle prices have a higher weight in CPI inflation. In contrast to CPI inflation, PCE inflation is broader and measures price changes of goods and services consumed (though not necessarily directly paid) by consumers. Items such as medical care services, financial services and software thus have higher weights. Especially the latter has seen high price rises in recent months. Looking ahead, core CPI & PCE inflation could continue to diverge as rent inflation is expected to moderate while software prices could accelerate further.
How high is US inflation? The answer to this question depends on who you ask. Consumers and market participants will typically refer to CPI inflation figures. This inflation gauge is used for inflation-linked contracts and for cost-of-living adjustment to reprice a.o. wages and social security adjustments. In contrast, policy makers, in particular the Federal Reserve, look at PCE inflation. To fulfill one part of its dual mandate, i.e. the price stability mandate, the Fed aims for PCE inflation to be around 2% over the longer run.
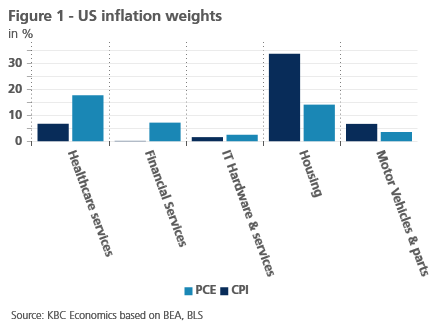
Methodological differences
There are important methodological differences between PCE and CPI inflation. CPI inflation measures average changes in prices directly paid by urban consumers. In contrast, PCE inflation measures price changes of goods and services consumed (though not necessarily directly paid) by consumers (both urban and rural ones). That is an important difference and results in important weight differences between PCE and CPI. Healthcare, which is often paid for by employers or by the government, has a much higher weight in PCE than CPI (see figure 1). The same is true for financial services, where CPI only includes out-of-pocket fees and commissions, while PCE also includes imputed costs for financial intermediation. Software also has a higher weight in the PCE, as many software subscriptions used by consumers are paid for by employers (e.g. Microsoft 365 subscriptions). In contrast, in the CPI index, goods and services that are directly paid for by consumers (e.g. rent and automobiles) carry a higher weight.
It is also important to note that the CPI calculations are mostly based on household surveys and retail price sampling (i.e. the Consumer Expenditure Survey), while the PCE relies more on business surveys and administrative data. This causes some underweights in the CPI basket as consumers frequently underestimate what they pay for certain items (e.g. software subscriptions).
Another important methodological difference is that CPI weights are only adjusted annually, while PCE weights are adjusted dynamically (based on consumer spending data) and thus change at every release. When the price of an item rises fast, customers tend to spend less on it, which lowers its weight in their spending basket. Given its dynamic weight adjustments, the PCE better captures this effect.
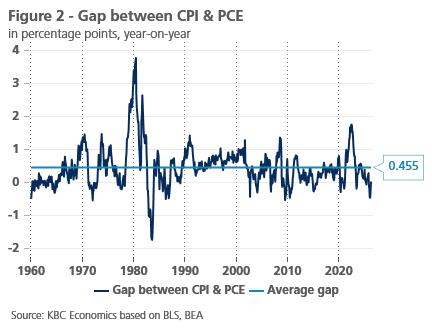
Partly because of this reason, PCE inflation tends to be lower than CPI inflation historically (see figure 2). Another reason is the rapid rise in housing costs, which far outstripped overall inflation in recent decades.
PCE outstripped CPI recently
Yet more recently, PCE inflation outstripped CPI inflation (see figure 3). In February, PCE inflation was 0.46 percentage point higher than CPI inflation. That gap disappeared in the next two months as both CPI & PCE inflation reached 3.8% in April. However, core PCE (at 3.3%) remained far higher than core CPI (at 2.7%). Indeed, the main reason why headline CPI caught up with headline PCE inflation was the sharp rise in energy inflation (which has a higher weight in CPI inflation).
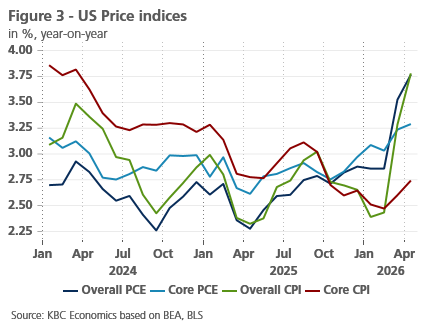
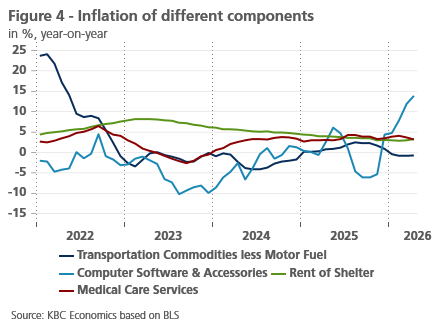
So why is core PCE so much higher? The explanation again lies in weight differences. Some components with higher weight in PCE have accelerated recently. Software prices in particular have accelerated significantly, because of the current AI boom. In contrast, vehicle prices and rent (whose CPI weight is higher) have decelerated in recent years (see figure 4).
Will the divergence last?
Whether PCE inflation continues to outstrip CPI inflation is highly dependent on the war in Iran. Were the conflict to end soon (as indicated by oil futures), we can expect energy prices to drop. This would push CPI inflation down faster than PCE inflation. A longer closure of the Strait would have the opposite effect.
For core inflation, we can expect the divergence to last in the coming months. The AI boom seems to continue unabated, pushing up prices for IT-related items. Meanwhile, shelter inflation (by far the largest CPI component) is likely to moderate further in the months ahead as indicated by market rents. Higher vehicle prices (as indicated by forward-looking indicators) could provide some compensation, but are unlikely to close the gap.
Inflation Releases to Take Centre Stage as Central Bank Meetings Loom
In focus today
Focus today will be on inflation releases from the US, Norway and Denmark. These figures will set the tone ahead of the ECB monetary policy meeting tomorrow, as well as the Norges Bank and Fed decisions next week.
In the US, we forecast headline inflation at 0.6% m/m SA (4.3% y/y), slightly above consensus, and core at 0.3% m/m SA (2.9% y/y), in line with consensus. After the recent repricing higher in Treasury yields on the back of strong labour market data, an upside surprise could further strengthen the case for a Fed tightening bias.
In Norway, we expect core inflation to rise moderately to 3.3% y/y in May (April: 3.2%, cons.: 3.2%), in line with the Norges Bank's March MPR-estimate. If our forecast is correct, it should be completely neutral for the market expectations. In light of Norges Bank's determination to bring down inflation and inflation expectations, we must assume that the threshold for reacting to upside surprises is much lower than on the downside.
In Denmark, we expect an increase in May inflation figures to 1.9% y/y from 1.4% y/y in April, driven mainly by higher electricity prices and normalisation of summer house inflation. We will watch food prices closely after what appears to have been an extensive retail price war in May, and we have pencilled in flat food prices in a month that usually sees increases.
In Sweden, several interesting data points are released at 08:00 CET today. The April GDP indicator follows a strong March (+1.9% m/m), after weak January and February prints (-0.4% and -0.6% m/m). Household consumption is particularly important given key role households are expected to play in the Swedish recovery. Based on the historical relationship with retail sales, household consumption is expected to have increased in April. We also receive industrial order data but, given recent volatility, we place greater weight on the PVI production data also published today.
In line with consensus and market pricing, we expect Bank of Canada to leave policy rates unchanged at the interim monetary policy decision today. We expect a relatively neutral, wait-and-see stance amid the central bank facing continued uncertainty with regard to US-trade relations and the war in Iran at a point in time when domestic releases have painted a mildly disinflationary picture for the domestic economy.
Economic and market news
What happened overnight
In China, PPI increased 3.9% y/y in May (cons.: 3.8% y/y, April: 2.8%), marking a third consecutive monthly increase to its highest level since July 2022. The increase in PPI underline that China is becoming an inflationary force after three years of exporting deflation. CPI came in at 1.2% y/y (cons.: 1.3%, April: 1.2%), driven by rising gasoline and services prices. Food prices continued to drag, falling 1.7% y/y.
In the Israel-Iran war, Iran's Revolutionary Guards struck a US base in Jordan and 21 other Gulf targets in retaliation for US attacks near the Strait of Hormuz, which were themselves triggered by the alleged downing of a US helicopter. The escalation raises serious doubts over a peace deal and keep energy markets on edge.
What happened yesterday
In oil space, Brent crude briefly went below USD 90/bbl yesterday as US energy secretary Wright signalled that traffic through the strait of Hormuz was increasing. Oil prices later retraced to about USD 92/bbl and remain around this level this morning.
In Denmark, April foreign trade data showed total exports of goods and services rising 0.4% m/m SA (March: 8.6%), driven primarily by higher services exports. Imports fell slightly by 0.4% m/m SA (March: 4.0%), reflecting a drop in goods imports. Additionally, industrial production declined 1.1% in May, a sharp reversal from the revised 8.3% increase in April. Industrial production remains one of the more reliable indicators for GDP growth in Denmark.
In the US, the NFIB small business optimism index for May slipped to 95.3 (April: 95.9), the lowest level in more than a year. Firms reported rising uncertainty, with job openings and hiring plans falling notably to their lowest levels in six years.
Equities: Major equity indices were dragged lower yesterday, led by tech, which have had a rough spell since Friday down about 7%, despite the slight rebound on Monday. Global equities finished down 0.2%, having been almost 1.8% lower earlier in the day, in a significant roller-coaster session. Tech was the primary source of weakness, joined only by the energy sector, which was weighed down by lower oil prices. Asian markets traded lower overnight, with South Korea among the weakest performers. US equity futures are also pointing lower this morning.
FI and FX: Risk sentiment takes a hit as US and Iran conducts tit-for-tat escalation over the last 24 hours. Despite this, EUR/USD sits steady in the mid-1.15's and Brent crude edges closer to USD90/bbl. This morning brings interesting data releases out of both Norway and Sweden, with potential implications for the Scandi currencies. But the hottest release of the day is the US CPI, where we expect a slightly above-consensus print. Together with potential further escalation in the Middle East, this will likely set the today.