Sample Category Title
Bank of Canada Holds, Signals Balancing Risks from Oil Prices and Trade
- The Bank of Canada (BoC) held its policy rate at 2.25%, noting that maintaining the current setting “balances” the competing risks of economic weakness and rising inflation.
- The opening statement pointed to the weaker growth backdrop. It noted that “GDP edged down 0.1% in the first quarter, weaker than expected at the time of the April Report,” with the economy expected to “remain in excess supply” despite an anticipated near-term rebound, as higher energy prices, global conflict, and trade uncertainty weigh on activity.
- The statement also noted that oil prices have been higher than assumed in April's Monetary Policy Report, likely nudging up the inflation outlook. However, it also noted that "there has been limited evidence of broad-based pass-through" from energy prices to inflation and that core inflation measures "have moved down to around 2% and the share of CPI components growing above 3% is close to its historical average".
- Importantly, in the Opening Statement the Bank emphasized policy flexibility, noting that “uncertainty is unusually elevated, and the risks could shift,” with Governing Council prepared to adjust as needed. It stated it could cut rates if U.S. trade restrictions weaken growth or potentially delivering “consecutive increases” if Middle East-related energy shocks lead to persistent, broad-based inflation.
Key Implications
- Another meeting, another hold. Growth to start the year came in materially lower than the Bank of Canada's last projections, showcasing just how much slack there is in the economy. This slack is expected to continue to help offset the inflation pressures coming from higher energy costs. Whether it is sufficient to prevent broader pass-through to core prices is likely to depend on just how long oil prices stay elevated.
- The outlook remains highly uncertain. Oil prices have come off their peaks but are still high as uncertainty about the course of the conflict in the Middle East persists. On the other hand, negotiations around the CUSMA review between Canada and the U.S. have yet to get started, casting a pall over trade prospects. Recent data suggest a second quarter bounce-back in growth, but one that is insufficient to absorb all of the excess capacity in the economy. Given the competing forces on inflation, we expect the Bank of Canada to stay on hold through the balance of the year.
Sunset Market Commentary
Markets
US May CPI inflation printed near consensus. Headline CPI rose by 0.5% M/M with the annual figure breaching the 4% mark for the first time since April 2023 (4.2% from 3.8%). Core inflation increased by 0.2% M/M (vs 0.3% consensus) while picking up from 2.8% Y/Y to 2.9% (highest since September of last year). Details showed energy prices rising by 3.9% M/M (23.5% Y/Y) with gasoline being the main culprit (+7% M/M & +40.5% Y/Y). Food price growth slowed to 0.2% M/M (3.1% Y/Y). Prices for services excluding energy increased by 0.3% M/M (3.4% Y/Y), primarily driven by shelter costs. Markets look at today’s numbers coming from last week’s strong growth/labour market data. The latter prompted further hawkish repositioning when it comes to this year’s Fed policy. From a momentum point of view, the lack of upward surprise today suggests that the current pricing should do going into next week’s FOMC meeting. A more neutral Fed stance is generally expected given the minor easing bias which still exists in the statement. Question remains whether new projections, both GDP/CPI and dot plot (if still released), make a stronger case for Fed action in coming months. Anyway, US Treasuries showcased some minor volatility around the time of the release with a minor strengthening bias. Daily changes on the US yield curve currently range between -0.4 bps (2-yr) and +1.3 bps (30-yr). EUR/USD oscillated between 1.1540 and 1.1560, but tries to regain some ground as the German/European yield curve bear flattens going into tomorrow’s ECB meeting. Yields add up to 3.5 bps at the front end of the curve. As the stalemate between the US and Iran drags on, the case builds for back-to-back action by the ECB. Recent fighting back and forth by both parties suggests that an interim deal isn’t in the pipe. The length of the conflict and energy shock suggests that applying just one 25 bps move looks silly and uncredible from a central bank point of view. Analysts point to the fact that significantly lower Chinese import volumes are currently the only thing standing in the way of oil prices returning north of $100/b.
News & Views
KBC Economics has revised up its forecast for the Czech policy rate from a status quo at 3.5% to two rate hikes towards 4% this year. A first move could come as soon as June. The revision is rooted in the extended disruption in the Strait of Hormuz, which is gradually feeding into higher energy prices. Natural gas in particular is a thorny issue with European storage levels at historically low levels (40%). Large household energy price resets at the start of next year and second-round effects (eg. food prices) loom with their impact peaking early 2027. Inflation could approach 4% by then. The underlying resilience of the Czech economy, underpinned by robust domestic demand, is a second key argument for the revised CNB outlook. The growth backdrop is accompanied by rapid expansion in investment lending and strong wage growth. KBC Economics considers inflation risks to have risen enough to justify a pre-emptive tightening response with a potential June move followed by another one in either August or November.
Norwegian headline inflation eased from 3.4% to 3.1% but the underlying gauge unexpectedly quickened to 3.4% - the joint-fastest since February 2025. The latter topped both analysts’ and the central bank’s own forecast. It cements another rate hike by the Norges Bank after having already raised the policy rate by 25 bps to 4.25% in May. The official March forecasts put the policy rate between 4.25% and 4.5% by the end of the year. Money markets assume the Norges Bank to pull the trigger again in September (95%). The policy meeting for next week is given an outside chance of just 25%. But then again, prior to the May gathering the market implied probability stood at no more than 50% as well. The Norwegian central bank’s Regional Network Survey is up for release tomorrow, serving as the final important input for next week’s policy meeting. The Norwegian krone after the CPI release recovered from a two-month low just north of EUR/NOK 11 to currently trade around 10.94.
BoC Holds Rates, Sees Energy Shock But Limited Inflation Pass-Through
The Bank of Canada left its overnight rate unchanged at 2.25% as expected. The accompanying statement revealed a central bank that is far less concerned about the recent rise in inflation than the headline numbers might suggest. While policymakers acknowledged that CPI inflation rose to 2.8% and is likely to hover around 3% in the near term, they repeatedly emphasized that higher energy prices are doing most of the work. In particular, BoC stressed that there has been "limited evidence of broad-based pass-through of higher energy prices to other consumer prices."
The Bank's assessment of the domestic economy remained cautious. It noted that first-quarter GDP contracted by 0.1%, housing activity declined, business investment remained weak and exports fell. While employment increased in May, policymakers pointed out that employment has been "little changed since the start of the year" and that the economy is expected to remain in "excess supply" even as growth resumes in the second quarter. Taken together, these comments suggest BoC still sees insufficient domestic demand pressure to justify tighter monetary policy.
That explains why policymakers are prepared to look through the current inflation surge. BoC explicitly stated that it is "continuing to look through the war's near-term impact on headline inflation" even though oil prices are now roughly USD 10 per barrel above the assumptions in its April forecasts. At the same time, the Bank delivered a warning that it "will not let higher energy prices become persistent inflation."
The message that BoC believes today's inflation problem is largely imported through energy markets rather than generated by the Canadian economy itself, but it remains ready to act if those pressures begin spreading more broadly.
Bank of Canada maintains policy rate at 2¼%
The Bank of Canada today held its target for the overnight rate at 2.25%, with the Bank Rate at 2.5% and the deposit rate at 2.20%.
The conflict in the Middle East is now in its fourth month. The resulting increases in energy prices and disruptions in global supply chains are weighing on global economic growth and pushing up inflation. At the same time, the US administration continues to propose new tariffs and trade policy uncertainty remains elevated.
In the United States, economic growth remains solid, supported by consumption and AI‑related investment. In the euro area, growth is subdued, with higher energy prices weighing on activity. China’s economic growth continues to be supported by strong exports.
Canadian financial conditions have loosened since the April Monetary Policy Report. Global equity markets have been buoyant and bond yields remain volatile. The Canadian dollar has weakened against the US dollar and other currencies.
In Canada, GDP edged down by 0.1% in the first quarter, weaker than expected at the time of the April MPR. Consumer spending grew 1.4% but government spending unexpectedly declined. Housing activity also declined and business investment remained weak. Exports fell while imports rose strongly as inventories were rebuilt. Employment was up in May, but looking through monthly volatility, employment in Canada is little changed since the start of the year. The unemployment rate continues to fluctuate in the 6 ½%-7% range with the most recent reading at 6.6% in May.
Recent data suggests that growth will resume in the second quarter but, even with some rebound, the economy is expected to remain in excess supply.
As expected, CPI inflation rose in April, reaching 2.8%. The increase reflects energy prices, both higher oil prices and the impact of the elimination of the consumer carbon tax falling out of the 12-month rate of inflation. So far, there has been limited evidence of broad-based pass-through of higher energy prices to other consumer prices. Measures of core inflation have moved down to around 2% and the share of CPI components growing above 3% is close to its historical average. Food price inflation moderated but remains high, and shelter inflation continued to slow. With global oil prices still elevated—roughly $10 a barrel above our April MPR assumptions—total inflation is expected to hover around 3% in the near term before easing gradually towards 2%.
Against this overall backdrop, Governing Council decided to maintain the policy rate at 2.25%. Economic activity in Canada has been weak and uncertainty about US trade policy persists. The conflict in the Middle East is ongoing and oil prices remain elevated. Governing Council is continuing to look through the war’s near-term impact on headline inflation, but will not let higher energy prices become persistent inflation. As the outlook evolves, we stand ready to respond as needed. The Bank is committed to maintaining Canadians’ confidence in price stability through this period of global upheaval.
Information note
The next scheduled date for announcing the overnight rate target is July 15, 2026. The Bank’s next MPR will be released at the same time.
US: Headline Inflation Climbs to a Three-Year High in May
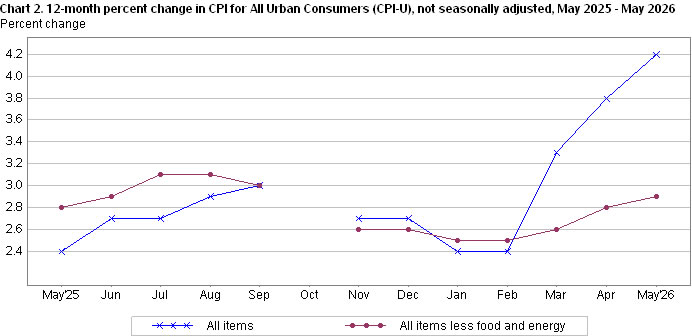
- The Consumer Price Index (CPI) rose by 0.5% month-on-month (m/m) in May, meeting the Bloomberg consensus forecast. On a twelve-month basis, CPI jumped 4.2% – the fastest rate of growth in three-years.
- Higher energy costs accounted for over sixty percent of the monthly gain in headline, led by a 7.0% m/m gain in prices at the pump. Food prices rose 0.2% m/m and are up 3.1% on a twelve-month basis.
- Excluding food and energy, core inflation rose 0.2% m/m, or roughly half the increase recorded the month prior and in line with consensus. On a twelve-month basis, core prices were up 2.9% (from 2.8% in April).
- Services inflation rose 0.3% m/m, after a hotter 0.5% m/m gain in April. The deceleration was due to a normalization in primary shelter costs (+0.3% m/m) following April's stronger reading (+0.5% m/m) that was driven by a lingering statistical quirk related to the Bureau of Labor Statistics not collecting data in October because of the government shutdown.
- Meanwhile, non-housing services remained on the firmer side, as price growth for both recreational and educational & communication services heated up, while airfares rose another 2.7% m/m. On a twelve-month basis, airfares are up 26.7% - the fastest rate of growth since December 2022.
- Core goods prices fell 0.1% m/m, or its first monthly decline since March 2025, driven by a pullback in medical goods (-0.7% m/m) and new vehicles (-0.3% m/m). On a twelve-month basis, goods prices are up 1.1% or roughly a percentage point higher than before last year's tariffs were implemented.
Key Implications
- The effects of the Iran war continued to surface in May, with headline inflation climbing to a three-year high. While still relatively contained, cost pressures are starting to be felt beyond just higher prices at the pump, with airfares up over 8% since the start of the war, which is coming atop lingering tariff price effects and still elevated services (ex. shelter) inflation.
- We see core measures of inflation remaining elevated through year-end before drifting lower in H1-2027, supporting the case for an extended Fed pause. The FOMC is very likely to telegraph a "higher for longer" monetary policy stance at next week's interest rate announcement, by dropping its easing bias and perhaps showing some upward drift in the median fed funds forecast, which currently shows 25 bps of easing this year and next.
US CPI Delivers Relief, But Middle East Risks Intensify
Markets received some welcome relief from US inflation data today, but the respite might prove short-lived as renewed geopolitical tensions quickly returned to the forefront. While headline CPI accelerated to its highest level in three years, the underlying details were slightly softer than feared, allowing investors to step back from the idea that the Federal Reserve may need to move rapidly toward rate hike.
US CPI rose from 3.8% yoy to 4.2% yoy in May, matching expectations and reflecting the continued impact of higher energy prices. However, core CPI edged up only from 2.8% yoy to 2.9% yoy, while monthly core inflation slowed from 0.4% mom to 0.2% mom. Markets had been particularly concerned about the possibility of a core inflation surprise above 3%, which could have significantly strengthened expectations for additional Fed tightening. Instead, the report suggested that the energy shock has not yet spread through the broader economy as aggressively as feared.
The data leave Fed in a relatively comfortable position. Inflation remains elevated and energy costs continue to pose risks, but policymakers have room to wait and assess whether current pressures become more persistent. Following last week's strong nonfarm payrolls report, the combination of resilient employment and contained core inflation supports a patient approach rather than an immediate policy response.
Meanwhile, that inflation narrative was quickly overshadowed by developments in the Middle East. US President Donald Trump struck a much more confrontational tone toward Iran today, saying the country had taken too long to negotiate and would now have to "pay the price." The comments marked a notable shift from just a day earlier, when Trump suggested a deal could be reached within "two or three days" and that the Strait of Hormuz could reopen shortly thereafter.
The tougher rhetoric followed Tuesday's US strikes against Iranian targets, which US Central Command said were conducted in response to the downing of a US Army Apache helicopter. While Iran has not directly claimed responsibility for the incident and Iranian state media reported no offensive operations in the Strait over the past day, the latest exchange has reinforced concerns that diplomatic progress may be moving further away rather than closer.
US equity futures traded modestly lower as the session began. With the CPI hurdle now behind markets, investor attention is also returning to the AI sector, where heavy selling pressure has persisted since late last week. The rebound attempts seen earlier in the week have struggled to gain traction, leaving technology shares vulnerable to further volatility.
In currency markets, Sterling leads weekly performance, supported by stronger domestic data and expectations that Bank of England may need to maintain a tightening bias. New Zealand Dollar and Euro followed. Australian Dollar is the weakest performer as markets continued to unwind expectations for further RBA tightening. Swiss Franc and Yen also lagged, while Dollar and Canadian Dollar traded closer to the middle of the pack.
US Inflation Climbs to 4.2%, But Core CPI Offers Fed Some Relief
US inflation hit its highest level in three years in May, driven primarily by soaring energy costs. But while headline CPI rose to 4.2%, the closely watched core measure remained below 3% and monthly core inflation slowed, offering markets some relief from fears of a more aggressive Fed response. Read More.
AUD/USD Faces 0.70 Breakdown If US Core CPI Tops 3%
AUD/USD is approaching one of its most important levels of the year. With markets focused on whether US core CPI can stay below 3%, a hotter inflation reading could strengthen Fed hike expectations and trigger a decisive break below the 0.70 handle. Read More
Gold Approaches Make-or-Break $4,000 Zone as US-Iran Tensions Escalate
Gold is rapidly approaching the most important technical battleground of the 2026 correction. As fading US-Iran peace hopes keep inflation concerns elevated, prices are closing in on the critical $4,000 support zone. A brief break is possible, but the bigger question is whether buyers step in and defend the broader support cluster. Read More.
Japan Producer Inflation Jumps to 6.3% as Energy Shock Drives Costs Higher
The energy shock is increasingly showing up in Japan's inflation data. Producer prices rose faster than expected in May, while import costs recorded their strongest increase since late 2022 as higher crude oil prices flowed through supply chains. Read More.
China CPI unchanged at 1.2%, PPI Climbs to Highest Since 2022
China's inflation story is increasingly split in two. Consumer inflation remained subdued in May as falling food prices kept CPI below expectations, while producer inflation climbed to its highest level in nearly three years as energy and commodity costs surged. Read More.
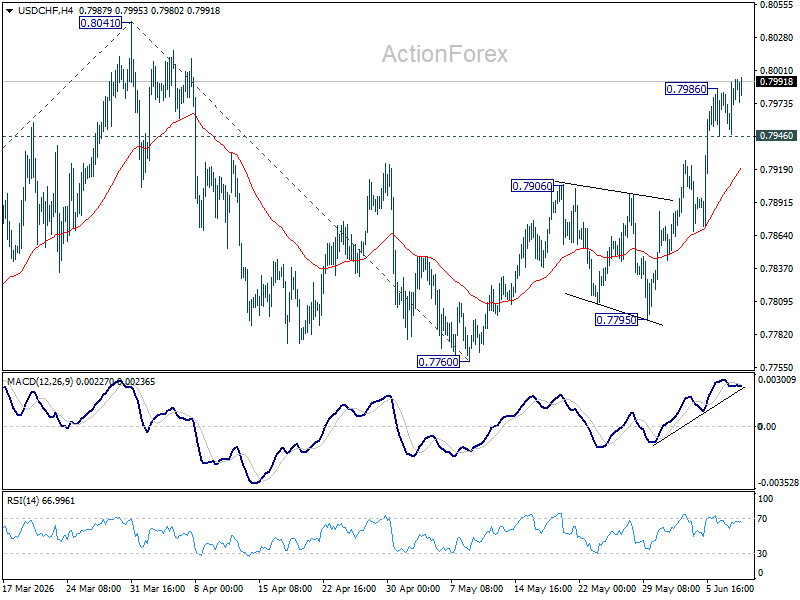
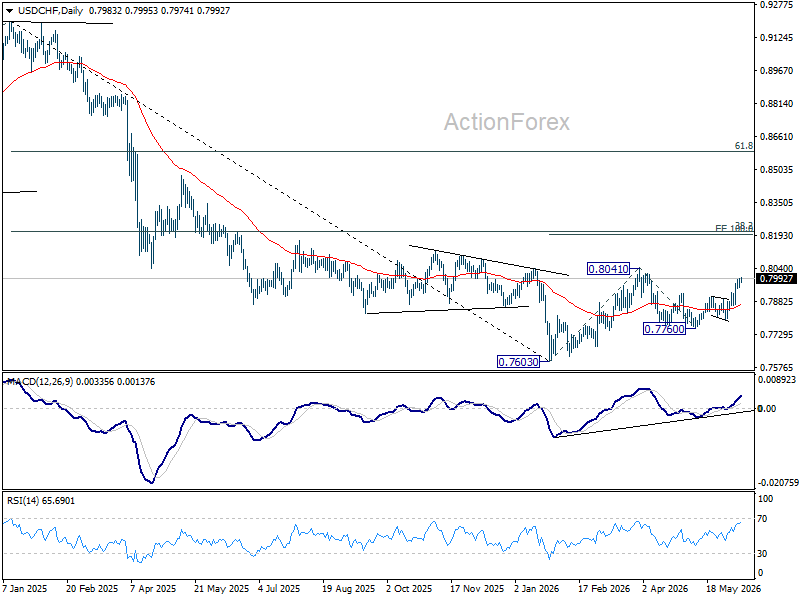
USD/CHF Daily Outlook
USD/CHF's rally resumed after brief consolidations .intraday bias is back on the upside for retesting 0.8041 high. Firm break there will resume the rise form 0.7603 and target 100% projection 0.7603 to 0.841 from 0.7600 at 0.8198 next. On the downside, below 0.7946 minor support will turn intraday bias neutral again.
In the bigger picture, while a medium term bottom was formed at 0.7603, it's still early to call for bullish trend reversal. As long as 38.2% retracement of 0.9200 (2025 high) to 0.7603 at 0.8213 holds, the larger down trend could still continue through 0.7603 at a later stage. However, firm break of 0.7603 will argue that the trend has reversed and turn focus to 0.8332 support turned resistance (2023 low) for confirmation.
US Inflation Climbs to 4.2%, But Core CPI Offers Fed Some Relief
US CPI accelerated from 3.8% yoy to 4.2% yoy in May, matching expectations and reaching its highest level in three years as the energy shock continued to work its way through the economy. However, the details of the report were somewhat slightly less alarming than feared. Core CPI edged up from 2.8% yoy to 2.9% yoy, also in line with expectations, while monthly core inflation slowed from 0.4% mom to 0.2% mom, coming in below forecasts of 0.3% mom.
Energy remained the dominant driver of inflation pressures. The energy index surged 23.5% yoy and rose another 3.9% mom in May following gains of 10.9% mom in March and 3.8% mom in April. According to the Bureau of Labor Statistics, energy accounted for more than 60% of the monthly increase in headline CPI. Food prices rose a more moderate 3.1% yoy.
For markets, the report is unlikely to dramatically alter the Fed outlook. The jump in headline inflation reinforces concerns that higher energy prices are feeding into the broader economy. However, the softer monthly core reading should provide some reassurance that underlying inflation pressures are not accelerating as rapidly as feared.
| Indicator | April | May | Forecast |
|---|---|---|---|
| CPI Y/Y | 3.8% | 4.2% | 4.2% |
| Core CPI Y/Y | 2.8% | 2.9% | 2.9% |
| CPI M/M | 0.6% | 0.5% | 0.5% |
| Core CPI M/M | 0.4% | 0.2% | 0.3% |
| Component | May Y/Y | May M/M |
|---|---|---|
| Energy | 23.5% | 3.9% |
| Food | 3.1% | 0.2% |
EUR/USD Daily Outlook
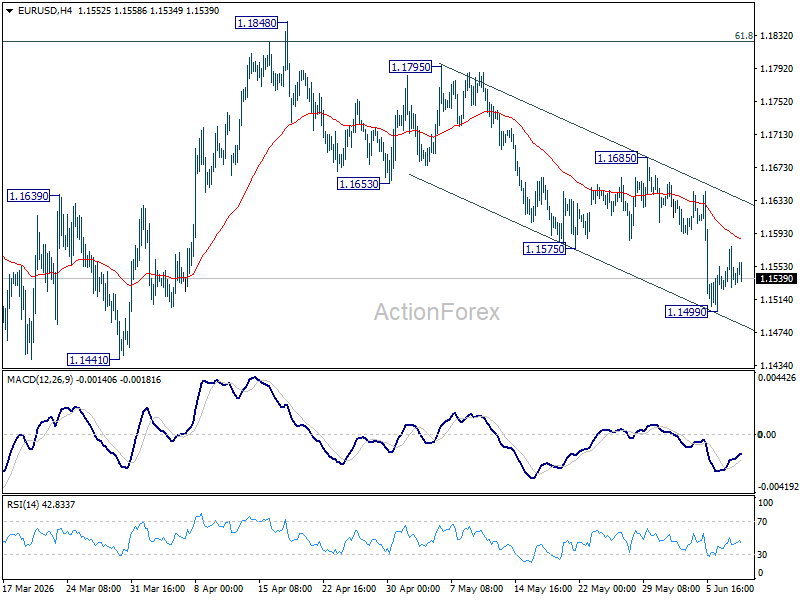
Intraday bias in EUR/USD remains neutral and some consolidations could be seen above 1.1499 temporary low. But risk will stay on the downside as long as 1.1685 resistance holds. Break of 1.4992 will resume the fall from 1.1848 to retest 1.1408 low next.
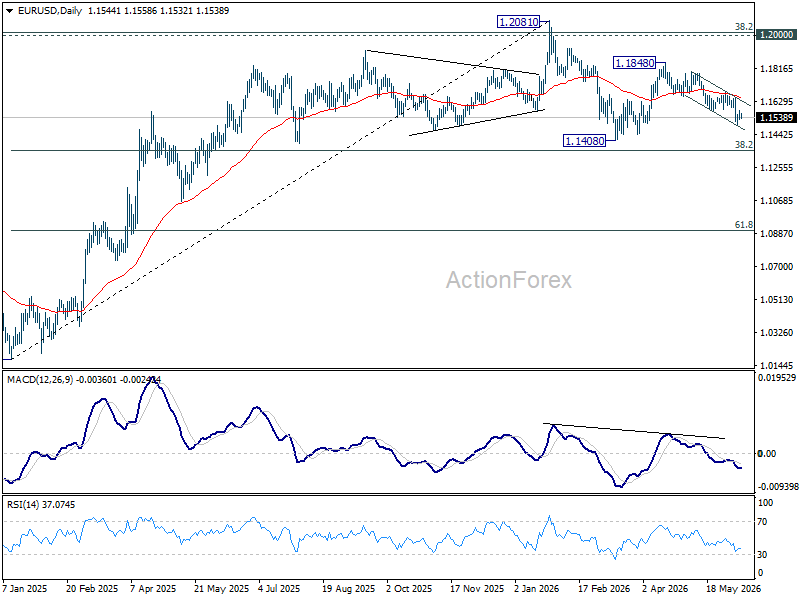
In the bigger picture, the strong support from 38.2% retracement of 1.0176 to 1.2081 at 1.1353 suggests that the pullback from 1.2081 is more likely a corrective move. Strong support was also found in 55 W EMA (now at 1.1547). Focus is back on 1.2 key cluster resistance level. Decisive break there will carry long term bullish implications. Nevertheless, break of 1.1408 support will revive the case of medium term bearish trend reversal.
USD/JPY Daily Outlook
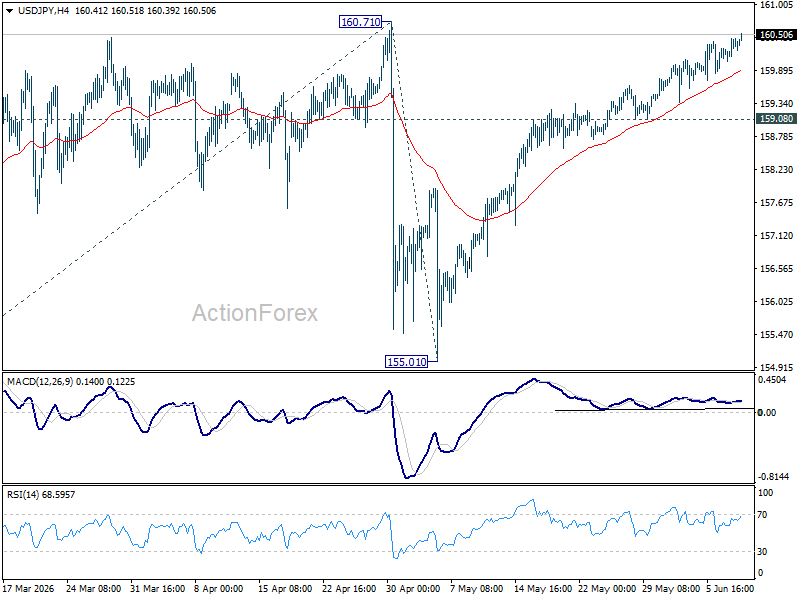
No change in USD/JPY's outlook. Further rise could still be seen. But strong resistance is still expected from 160.71. Break of 159.08 will turn bias back to the downside the extend the corrective pattern from 160.71 with the third leg. However, decisive break of 160.71 will confirm up trend resumption. That should push USD/JPY through 161.94 to 100% projection of 152.25 to 160.71 from 155.01 at 163.47 next.
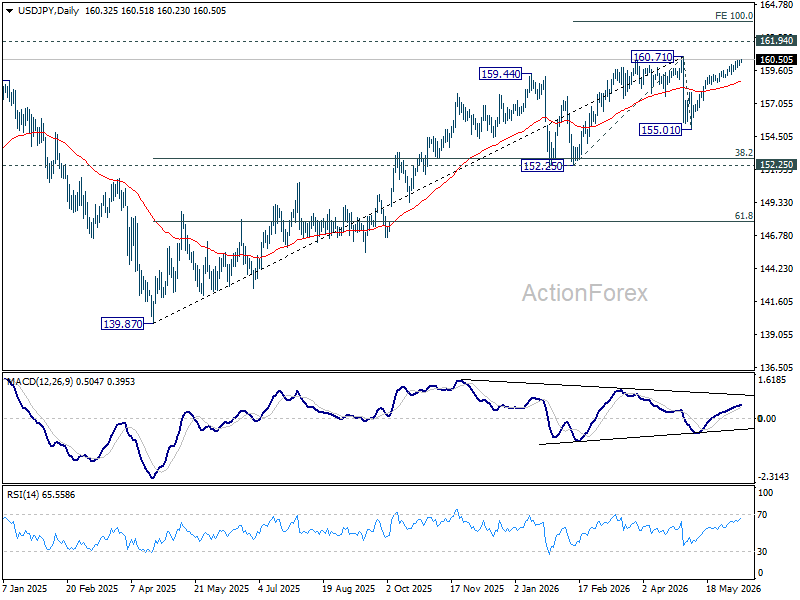
In the bigger picture, for now, corrective pattern from 161.94 (2024 high) is still seen as completed at 139.87. Rise from there is seen as resuming the long term up trend. So, break of 161.94 is expected at a later stage to resume the long term up trend. However, sustained break of 55 W EMA (now at 154.93) will dampen this view and bring deeper fall back towards 139.87 to extend the pattern from 161.94.
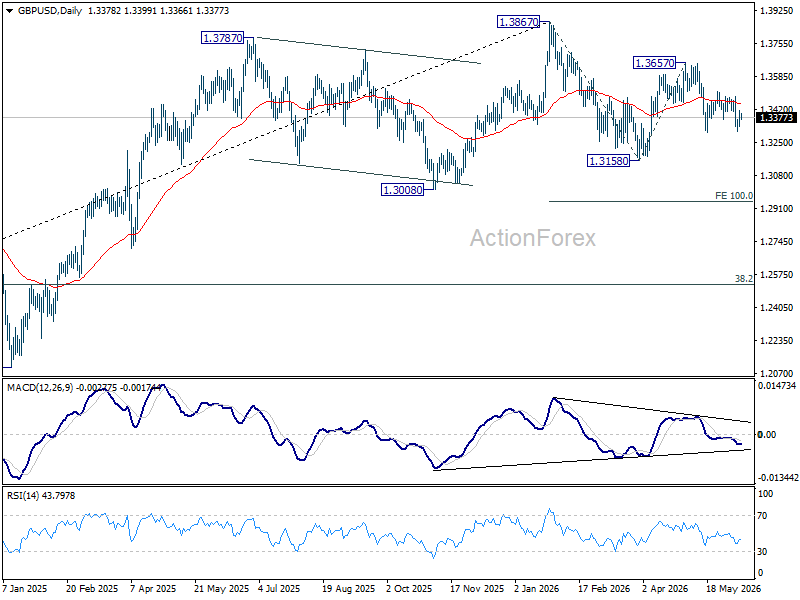
GBP/USD Daily Outlook
Intraday bias in GBP/USD remains neutral as range trading continues. On the downside, break of 1.3300 will target a retest on 1.3158. Firm break there will extend the whole fall from 1.3867 to 100% projection of 1.3867 to 1.3158 from 1.3657 at 1.2948. For now, risk is mildly on the downside as long as 1.3508 resistance holds, in case of recovery.
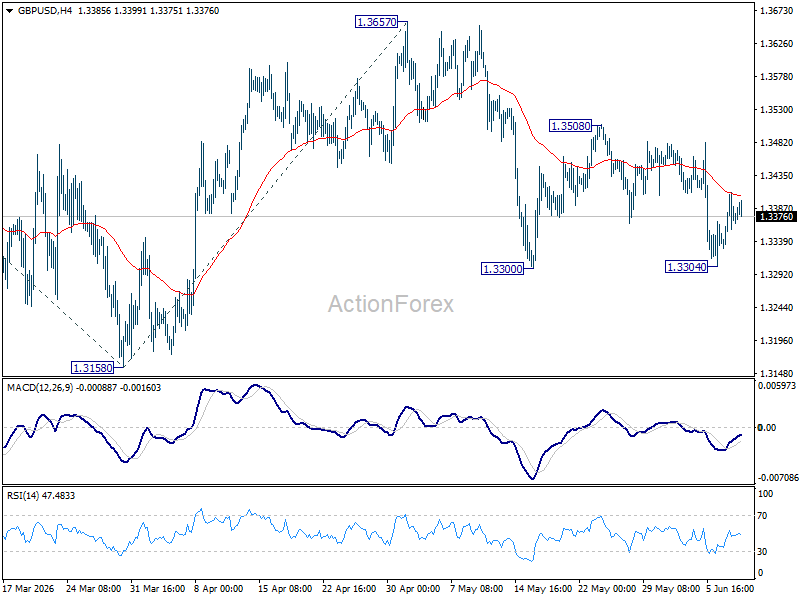
In the bigger picture, price actions from 1.3867 are a corrective pattern within the broader up trend from 1.0351 (2022 low). With 1.3008 support intact, medium term bullishness is maintained and break of 1.3867 is in favor for a later stage, towards 1.4248 key resistance (2021 high). However, firm break of 1.3008 will at least bring deeper fall to 38.2% retracement of 1.0351 to 1.3867 at 1.2524, with increased risk of bearish reversal.