
Sample Category Title
USD/CHF Daily Outlook
USD/CHF's rally resumed after brief consolidations .intraday bias is back on the upside for retesting 0.8041 high. Firm break there will resume the rise form 0.7603 and target 100% projection 0.7603 to 0.841 from 0.7600 at 0.8198 next. On the downside, below 0.7946 minor support will turn intraday bias neutral again.
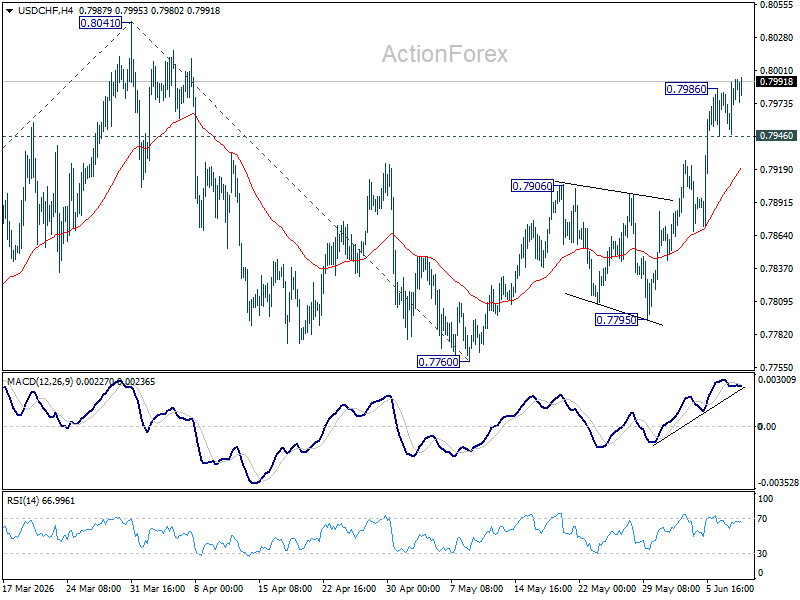
In the bigger picture, while a medium term bottom was formed at 0.7603, it's still early to call for bullish trend reversal. As long as 38.2% retracement of 0.9200 (2025 high) to 0.7603 at 0.8213 holds, the larger down trend could still continue through 0.7603 at a later stage. However, firm break of 0.7603 will argue that the trend has reversed and turn focus to 0.8332 support turned resistance (2023 low) for confirmation.
AUD/USD Daily Report
AUD/USD's fall from 0.7277 resumed after brief consolidations and intraday bias is back on the downside. Firm break of 100% projection of 0.7277 to 0.7076 from 0.7200 at 0.699 will target 161.8% projection at 0.6875. On the upside, above 0.7076 support turned resistance will turn intraday bias neutral first.
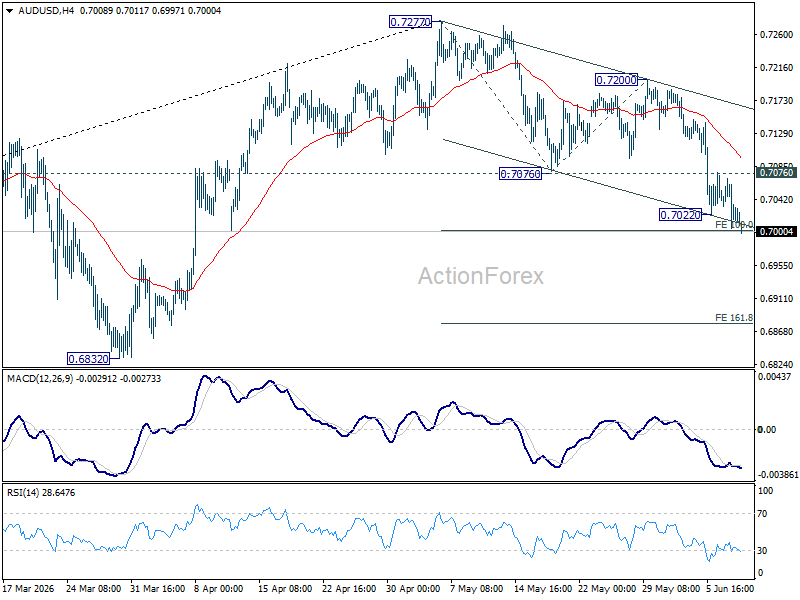
In the bigger picture, considering bearish divergence condition in D MACD, a medium term top could be formed at 0.7277 after failing to sustain above 61.8% retracement of 0.8006 (2021 high) to 0.5913 (2024 low) at 0.7206). Deeper fall could be seen to 38.2% retracement of 5913 to 0.7277 at 0.6756 as a correction. But strong support should be seen there to bring rebound. Consolidations would continue below 0.7277 for a while.
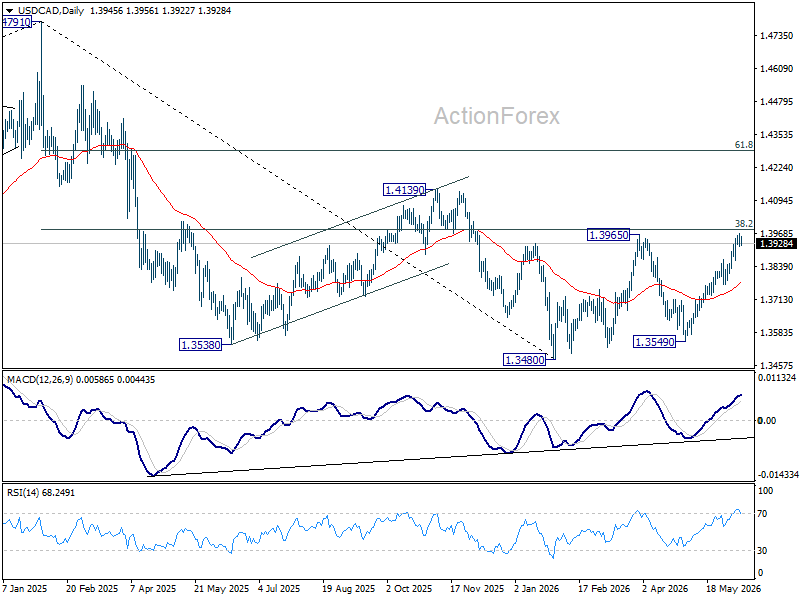
USD/CAD Daily Outlook
USD/CAD edged higher to 1.3967 but retreated again. Intraday bias remains neutral first. Further rise is expected as long as 1.3769 support holds. Decisive break of 38.2% retracement of 1.4791 to 1.3480 at 1.3981 will carry larger bullish implications and target 61.8% retracement at 1.4290 next.
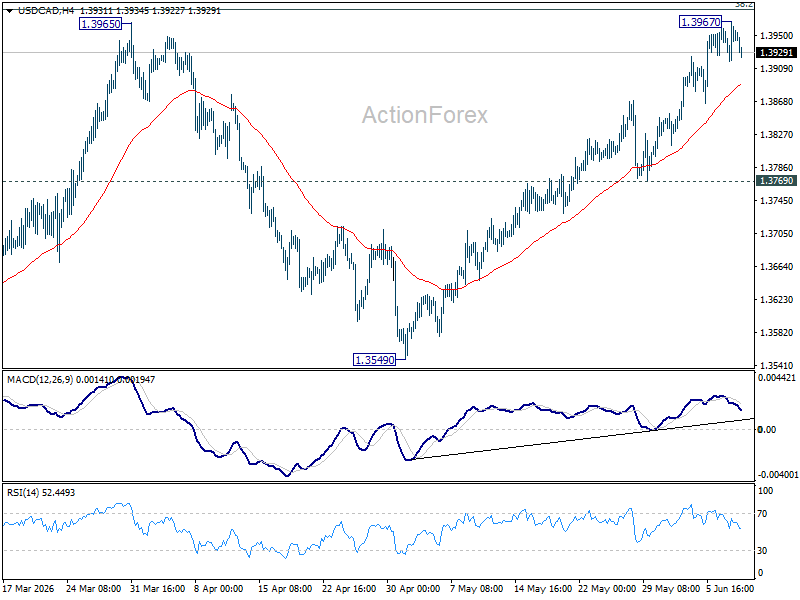
In the bigger picture, price actions from 1.4791 are seen as a corrective pattern to the whole up trend from 1.2005 (2021 low). Rejection by 38.2% retracement of 1.4791 to 1.3480 at 1.3981 will keep the decline intact, and bring another fall through 1.3480 at a later stage. However, firm break of 1.3981 will argue that the decline has completed, and set up further rise back to retest 1.4791 instead.
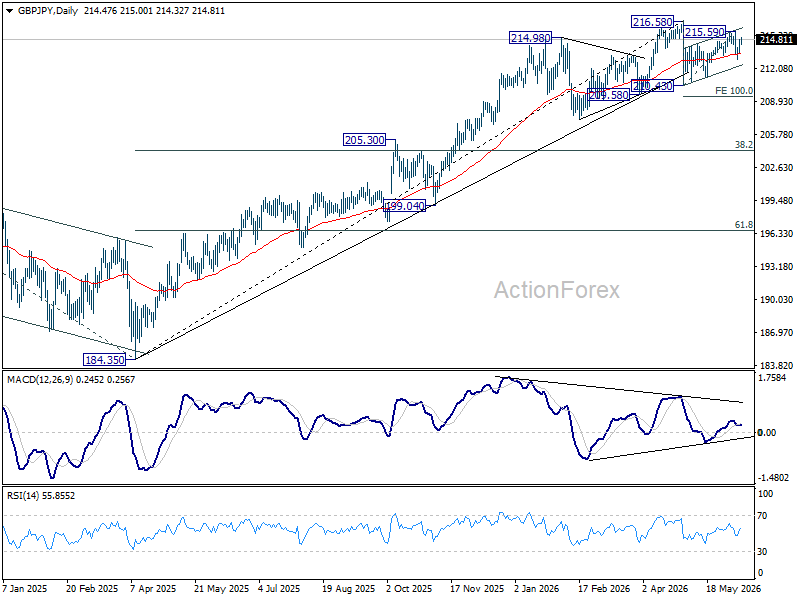
GBP/JPY Daily Outlook
Intraday bias in GBP/JPY remains neutral and risk stays mildly on the downside as long as 215.59 resistance holds. Below 212.90 will target 210.43/211.23 support zone. However, firm break of 215.59 will resume the rebound from 210.43 to retest 216.58 high instead.
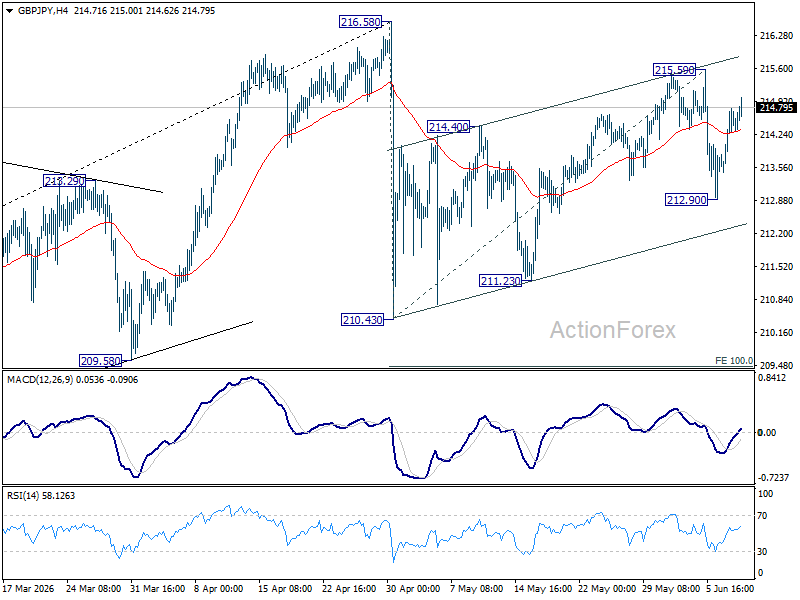
In the bigger picture, there is no clear sign of trend reversal yet. The long term up trend could still extend to 61.8% projection of 148.93 (2022 low) to 208.09 (2024 high) from 184.35 at 220.90 on resumption. However, sustained break of 55 W EMA (now at 206.77) will argue that it's already in medium term down trend for 184.35 support.
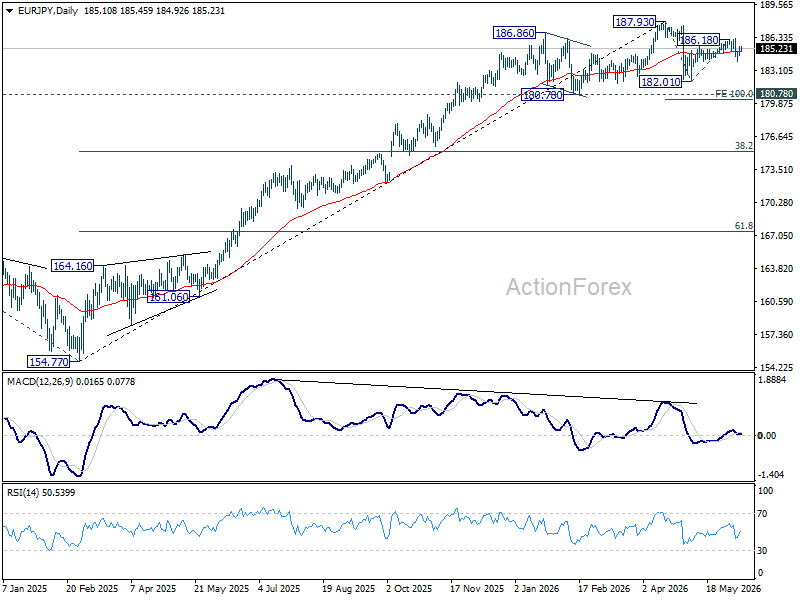
EUR/JPY Daily Outlook
Intraday bias in EUR/JPY remains neutral and risk stay mildly on the downside as long as 186.18 resistance holds. Below 183.95 will bring retest of 182.01 support first. However, firm break of 186.18 will resume the rebound from 182.01 to retest 187.93 high instead.
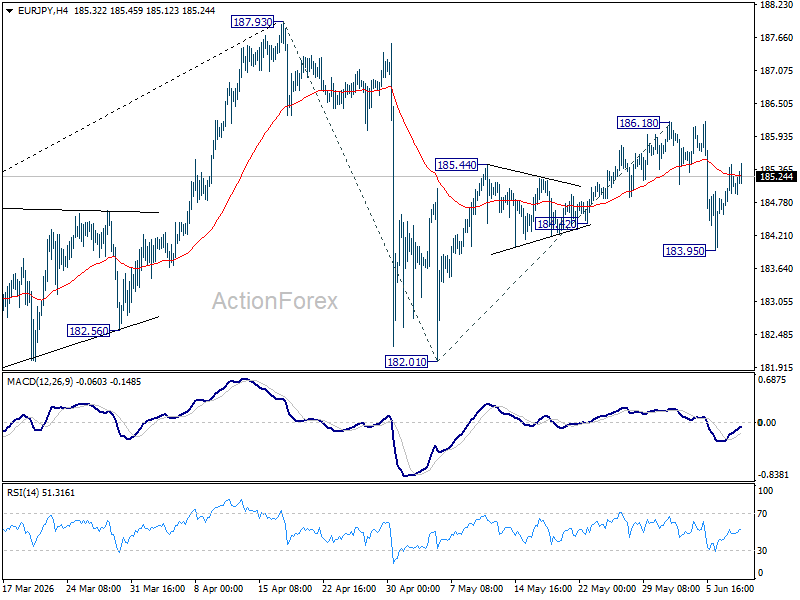
In the bigger picture, there is no sign of reversal yet. Uptrend from 114.42 (2020 low) is still expected to resume at a later stage to 78.6% projection of 124.37 (2022 low) to 175.41 (2025 high) from 154.77 at 194.88. However, sustained break of 55 W EMA (now at 178.95) will argue that it's already in a medium term down trend to 175.41 resistance turned support and below.
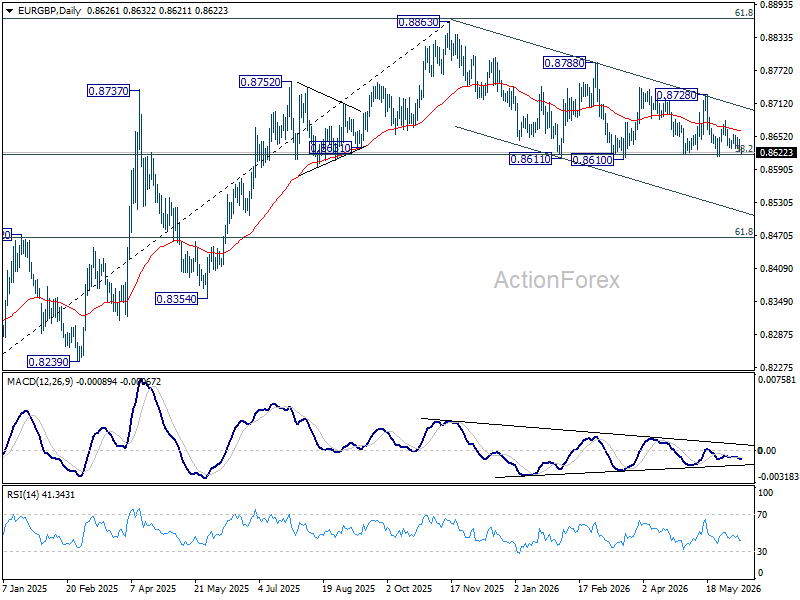
EUR/GBP Daily Outlook
No change in EUR/GBP's outlook as sideway trading continues. Intraday bias remains neutral at this point. On the downside, decisive break of 0.8610 support will revive the case of bearish trend reversal. On the upside, break of 0.8728 resistance will bring stronger rally back towards 0.8740 resistance.
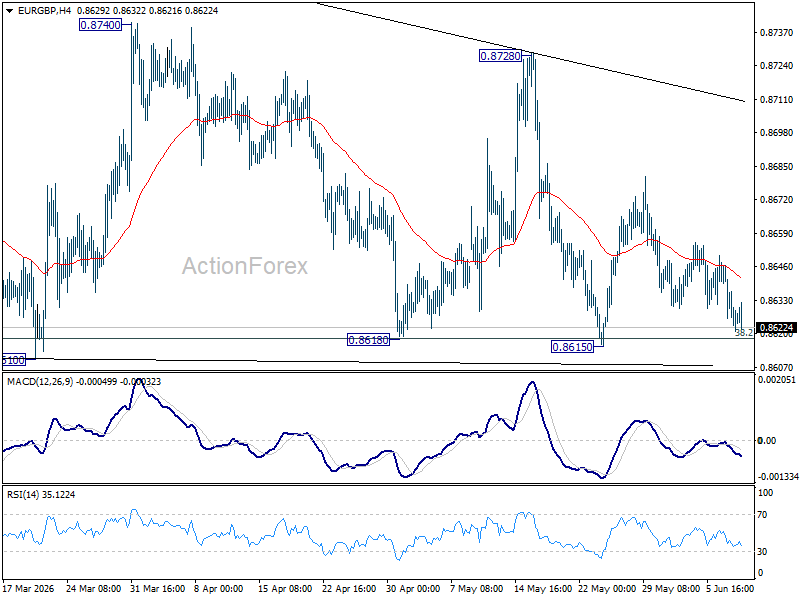
In the bigger picture, focus is staying on 38.2% retracement of 0.8821 to 0.8863 at 0.8618. Strong rebound from there will retain medium term bullishness. Rise from 0.8221 should resume through 0.8863 at a later stage. Nevertheless, sustained break of 0.8618 will confirm that whole rise from 0.8221 has completed at 0.8863. Deeper decline should then be seen to 61.8% retracement at 0.8466 at least.
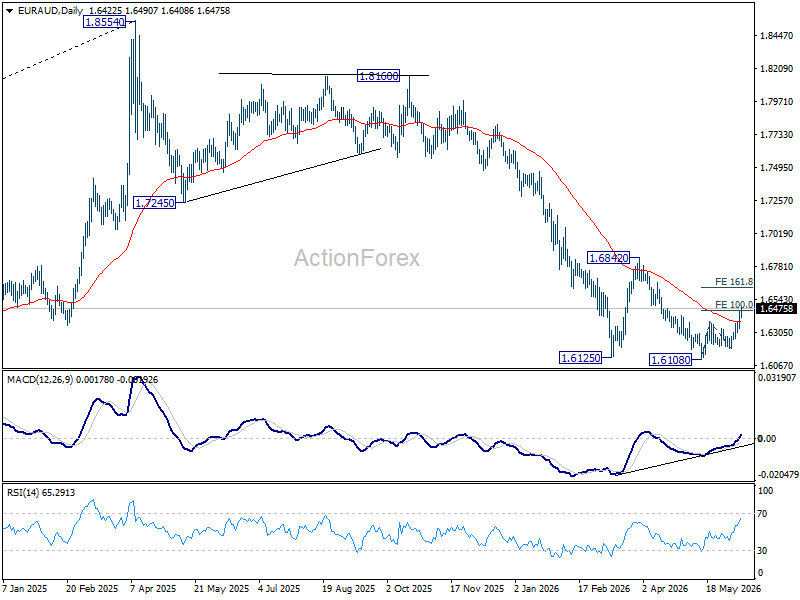
EUR/AUD Daily Outlook
EUR/AUD's rally continues today and broke 100% projection of 1.6108 to 1.6381 from 1.6186 at 1.6459. Intraday bias remains on the upside for 161.8% projection at 1.6628 next. On the downside, below 1.6480 minor support will turn bias neutral and bring consolidations first.
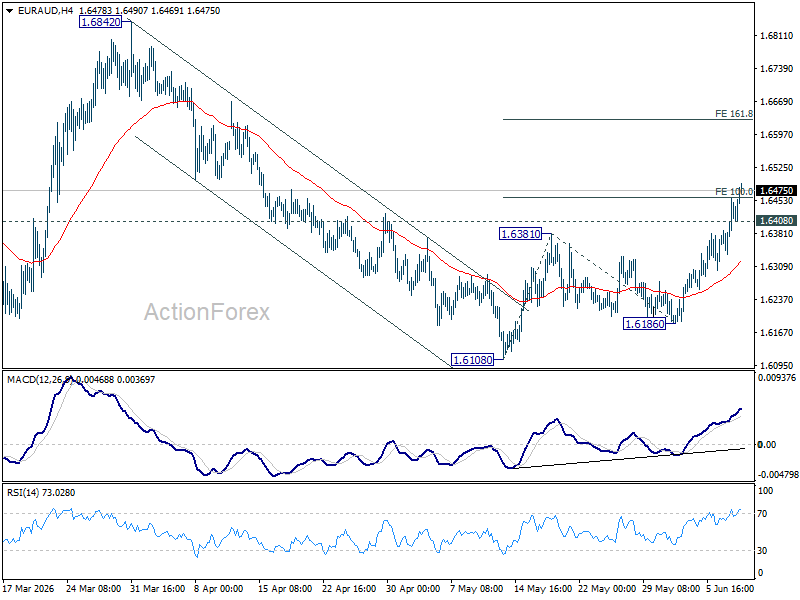
In the bigger picture, outlook will stay bearish as long as 1.6842 resistance holds. Fall from 1.8554 (2025 high) is expected to continue to 61.8% retracement of 1.4281 to 1.8554 at 1.5913. Decisive break there will pave the way back to 1.4281 (2022 low). However, firm break of 1.6842 should confirm medium term bottoming, and bring stronger rally.
EUR/CHF Daily Outlook
EUR/CHF's rise from 0.9094 is still in progress today and intraday bias remains on the upside. Further rally should be seen to 0.9264 resistance first. Firm break there will resume the rise from 0.8979 to 100% projection of 0.8979 to 0.9264 from 0.9094 at 0.9379. On the downside, below 0.9190 minor support will turn intraday bias neutral again.
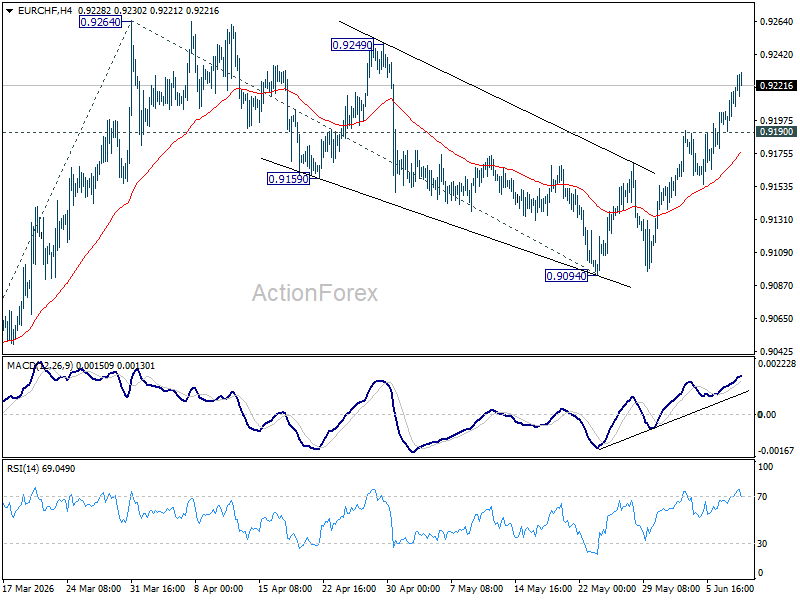
In the bigger picture, as long as 0.9394 resistance holds, down trend from 0.9928 (2024 high) should still be in progress. Firm break of 0.8979 will confirm down trend resumption. However, decisive break of 0.9394 will be an important sign of medium term bullish reversal.
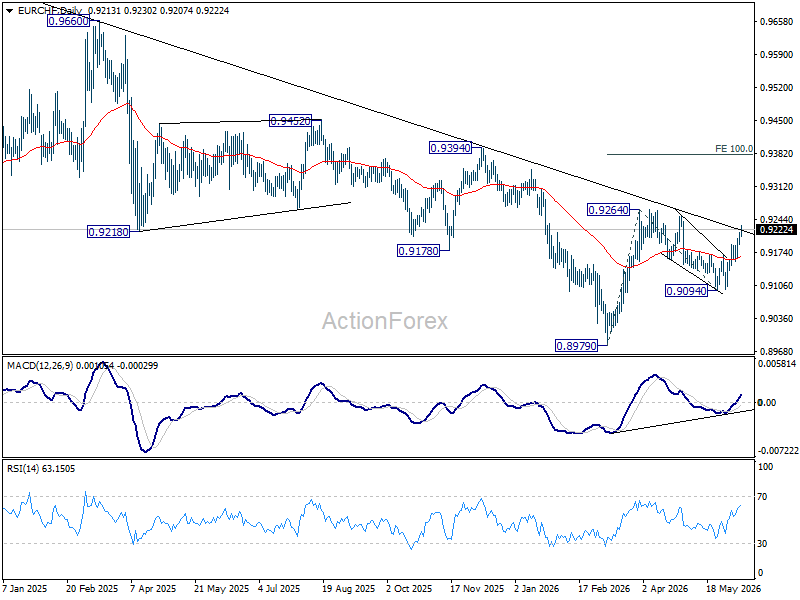
Chart Alert: USD/JPY Advances Toward the Next 161.60/95 Key Intervention Levels
Key takeaways
- USD/JPY remains supported by a widening US-Japan yield differential. Markets are increasingly pricing a more hawkish Federal Reserve, with rising expectations of a Fed rate hike later in 2026, while the Bank of Japan appears likely to slow or pause its bond tapering programme despite an expected rate increase next week.
- The pair is approaching a key intervention zone near 160.40–160.70. Japanese authorities have already spent a record amount defending the yen earlier this year, making this area a critical level where renewed verbal or direct intervention risks may emerge.
- Technical momentum remains constructive in the near term. USD/JPY continues to trade within both a medium-term ascending wedge and a shorter-term rising channel, with momentum indicators remaining supportive of a further advance toward the 160.65, 161.14/20, and 161.60/95 resistance levels.
The US CPI shock and a hawkish Fed
The market enters today’s US CPI print, facing building macro headwinds and energy shocks stemming from the ongoing Middle East conflict. Following a complete evaporation of Fed rate-cut bets for 2026, the market is aggressively positioned for a bear-flattening yield curve environment under Fed Chair Kevin Warsh. With futures now pricing in a 61% probability of a 25-bps hike in October, an upside surprise in today’s CPI, potentially pushing inflation to multi-year highs, will solidify the higher-for-longer regime and maintain structural upward pressure on the greenback.
BoJ’s balancing act - The June rate hike vs. bond taper pause
Next week (June 15-16), the Bank of Japan is widely expected to shift its narrative toward becoming an active “inflation fighter”. Aggregated polls show nearly 94% of economists expect Governor Ueda to deliver a 25-basis-point hike, lifting the short-term policy rate to 1.00% from 0.75%, a level last seen in 1995. This hawkish tilt is directly responsive to the persistent inflationary impulses generated by the US-Iran war.
Crucially, to mitigate political friction with Prime Minister Sanae Takaichi and stabilise a volatile sovereign bond market where the 10-year Japanese Government Bond (JGB) yield has recently hit a 30-year high of 2.8%, the BoJ is leaning towards pausing or slowing its bond-purchase taper next fiscal year.
By freezing further monthly purchase reductions (potentially keeping them steady near 2.1 trillion yen), the central bank hopes to cap the blowout of debt-servicing costs before yields breach the painful 3% threshold.
The 2-year US Treasury/JGB yield spread is widening
Fig. 1: 2-YR & 10-YR US Treasuries/JGBs yield spreads as of 10 Jun 2026 (Source: TradingView). The information presented is historical information, and past performance is not indicative of future performance.
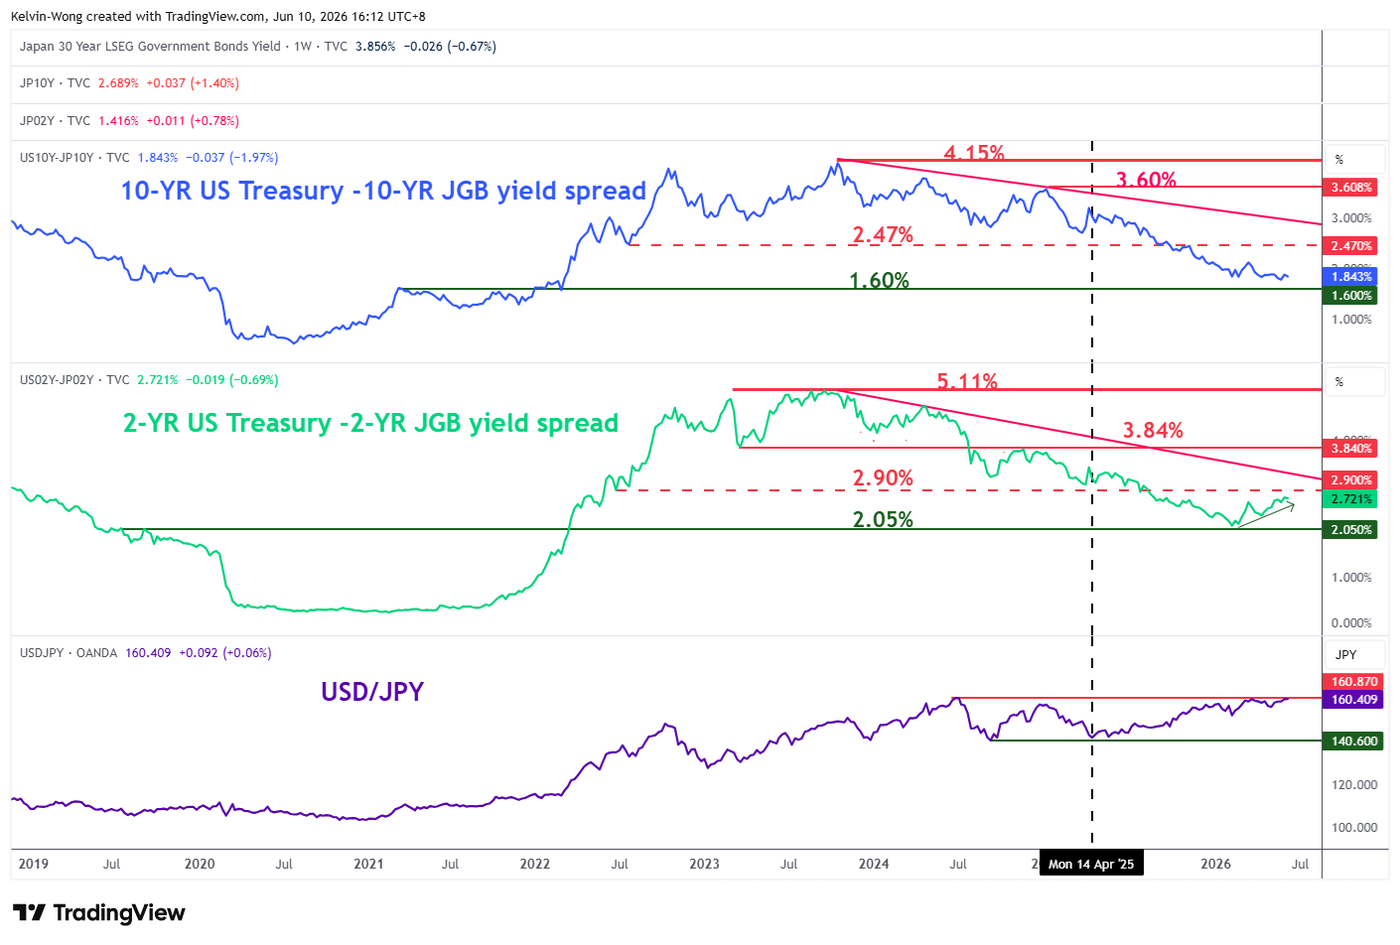
The shorter-term yield spread between the 2-year US Treasury and the Japanese Government Bond (JGB) has started to widen since hitting a 4-year low of 2.12% earlier in February 2026, which is also just a whisker above a major support of 2.05% (see Fig. 1).
The spread of the 2-year US Treasury-JGB yield has rebounded by 60 basis points to 2.72% as of Wednesday, 9 June 2026, which implies that the US Federal Reserve is adopting a more hawkish monetary policy stance over the Bank of Japan, in turn putting downside pressure on the Japanese yen as it flirts around the prior intervention area of 160.40/70, where Vice Finance Minister Mimura, in charge of foreign exchange issued a “final verbal warning” to speculators on 30 April 2026 before actual intervention took place on the same day.
Japanese authorities have spent a record $ 74.1 billion in the latest round of FX intervention to buy yen between 30 April 2026 and 6 May 2026, according to Finance Ministry data.
Let’s now unpack the short-term trajectory (1 to 3 days) of the USD/JPY from a technical analysis perspective.
Grinding up towards “Ascending Wedge” upper boundary at 160.60/95
Fig. 2: USD/JPY medium-term trend as of 10 Jun 2026 (Source: TradingView). The information presented is historical information, and past performance is not indicative of future performance.
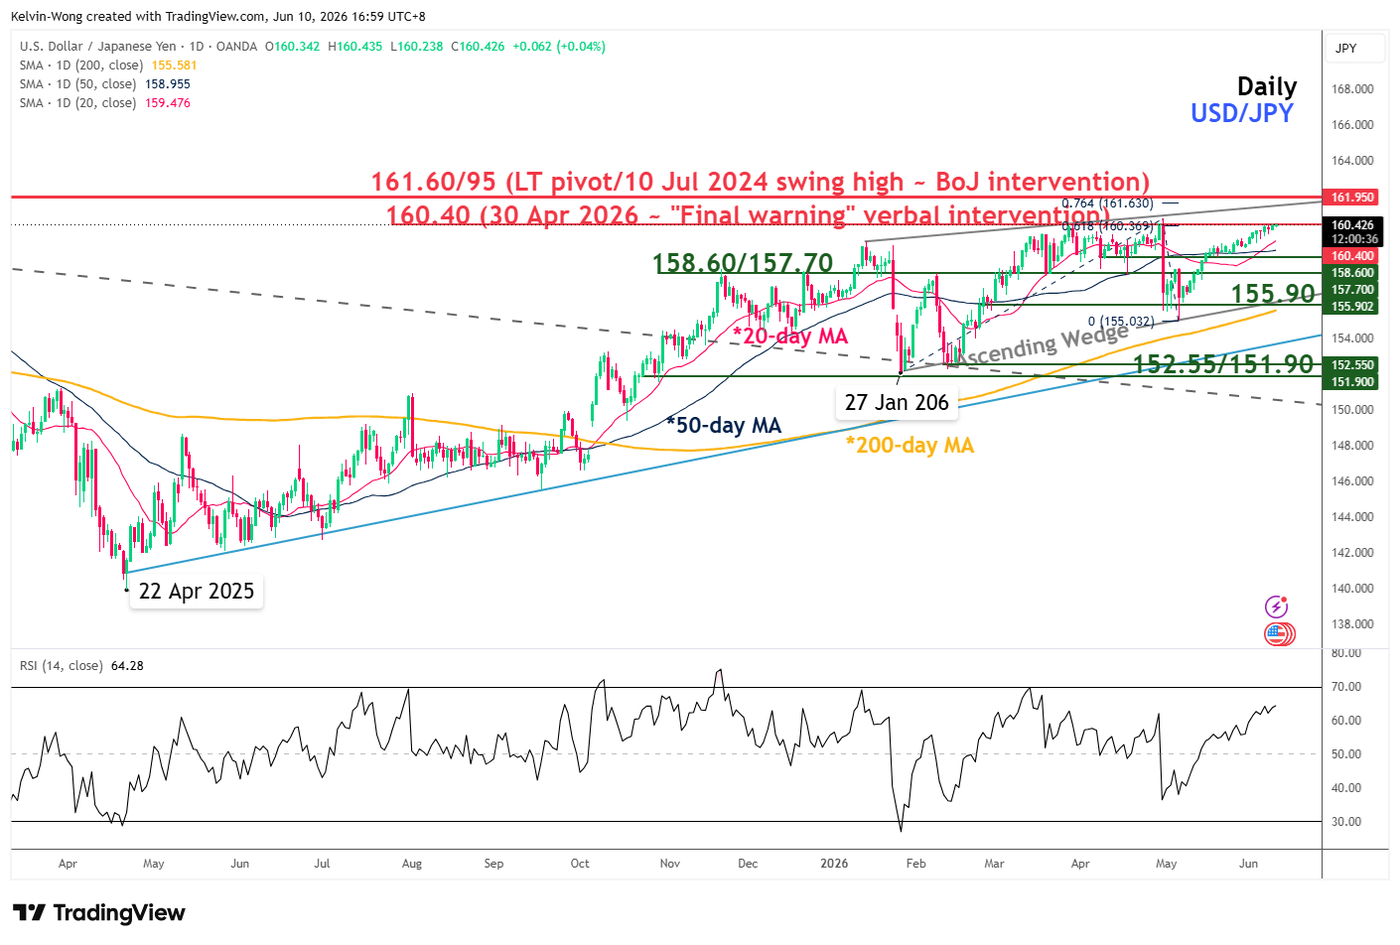
Fig. 3: USD/JPY minor trend as of 10 Jun 2026 (Source: TradingView). The information presented is historical information, and past performance is not indicative of future performance.
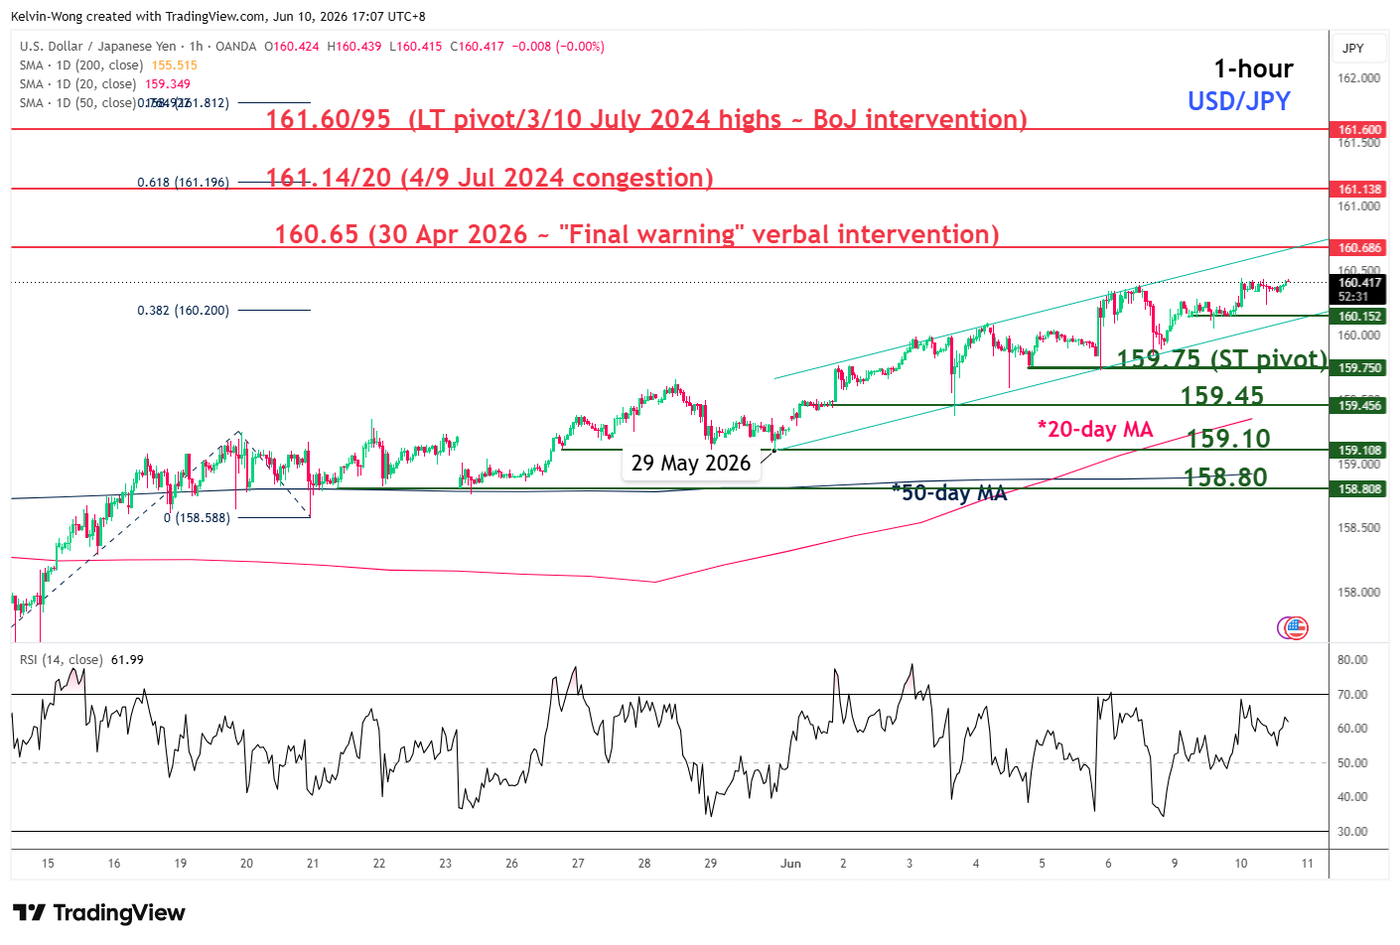
Trend bias: Minor uptrend with key short-term support pivotal at 159.75.
Resistances: 160.65 (30 Apr 2026 high), 161.14/20 (4/9 Jul 2024 congestion & Fibonacci extension), 161.60/95 (long-term pivot) (see Fig. 3).
Next supports: 159.45 (1/3 Jun 2026 congestion & 20-day MA), 159.10 (29 May 2026 low), 158.80 (21/25 May 2026 low & 50-day MA).
Key elements to support the short-term bullish bias on USD/JPY
- Price actions of the USD/JPY have been oscillating within a medium-term “Ascending Wedge” configuration since the 27 January 2026 low, with its upper boundary coming in at 161.60/95 (see Fig.2).
- The recent minor uptrend phase remains intact, as price action in USD/JPY continues to evolve within a minor ascending channel in place from the 29 May 2026 low at 159.10 (see Fig. 3).
- The hourly RSI momentum indicator remains short-term bullish, holding above the 50 level (see Fig. 3).
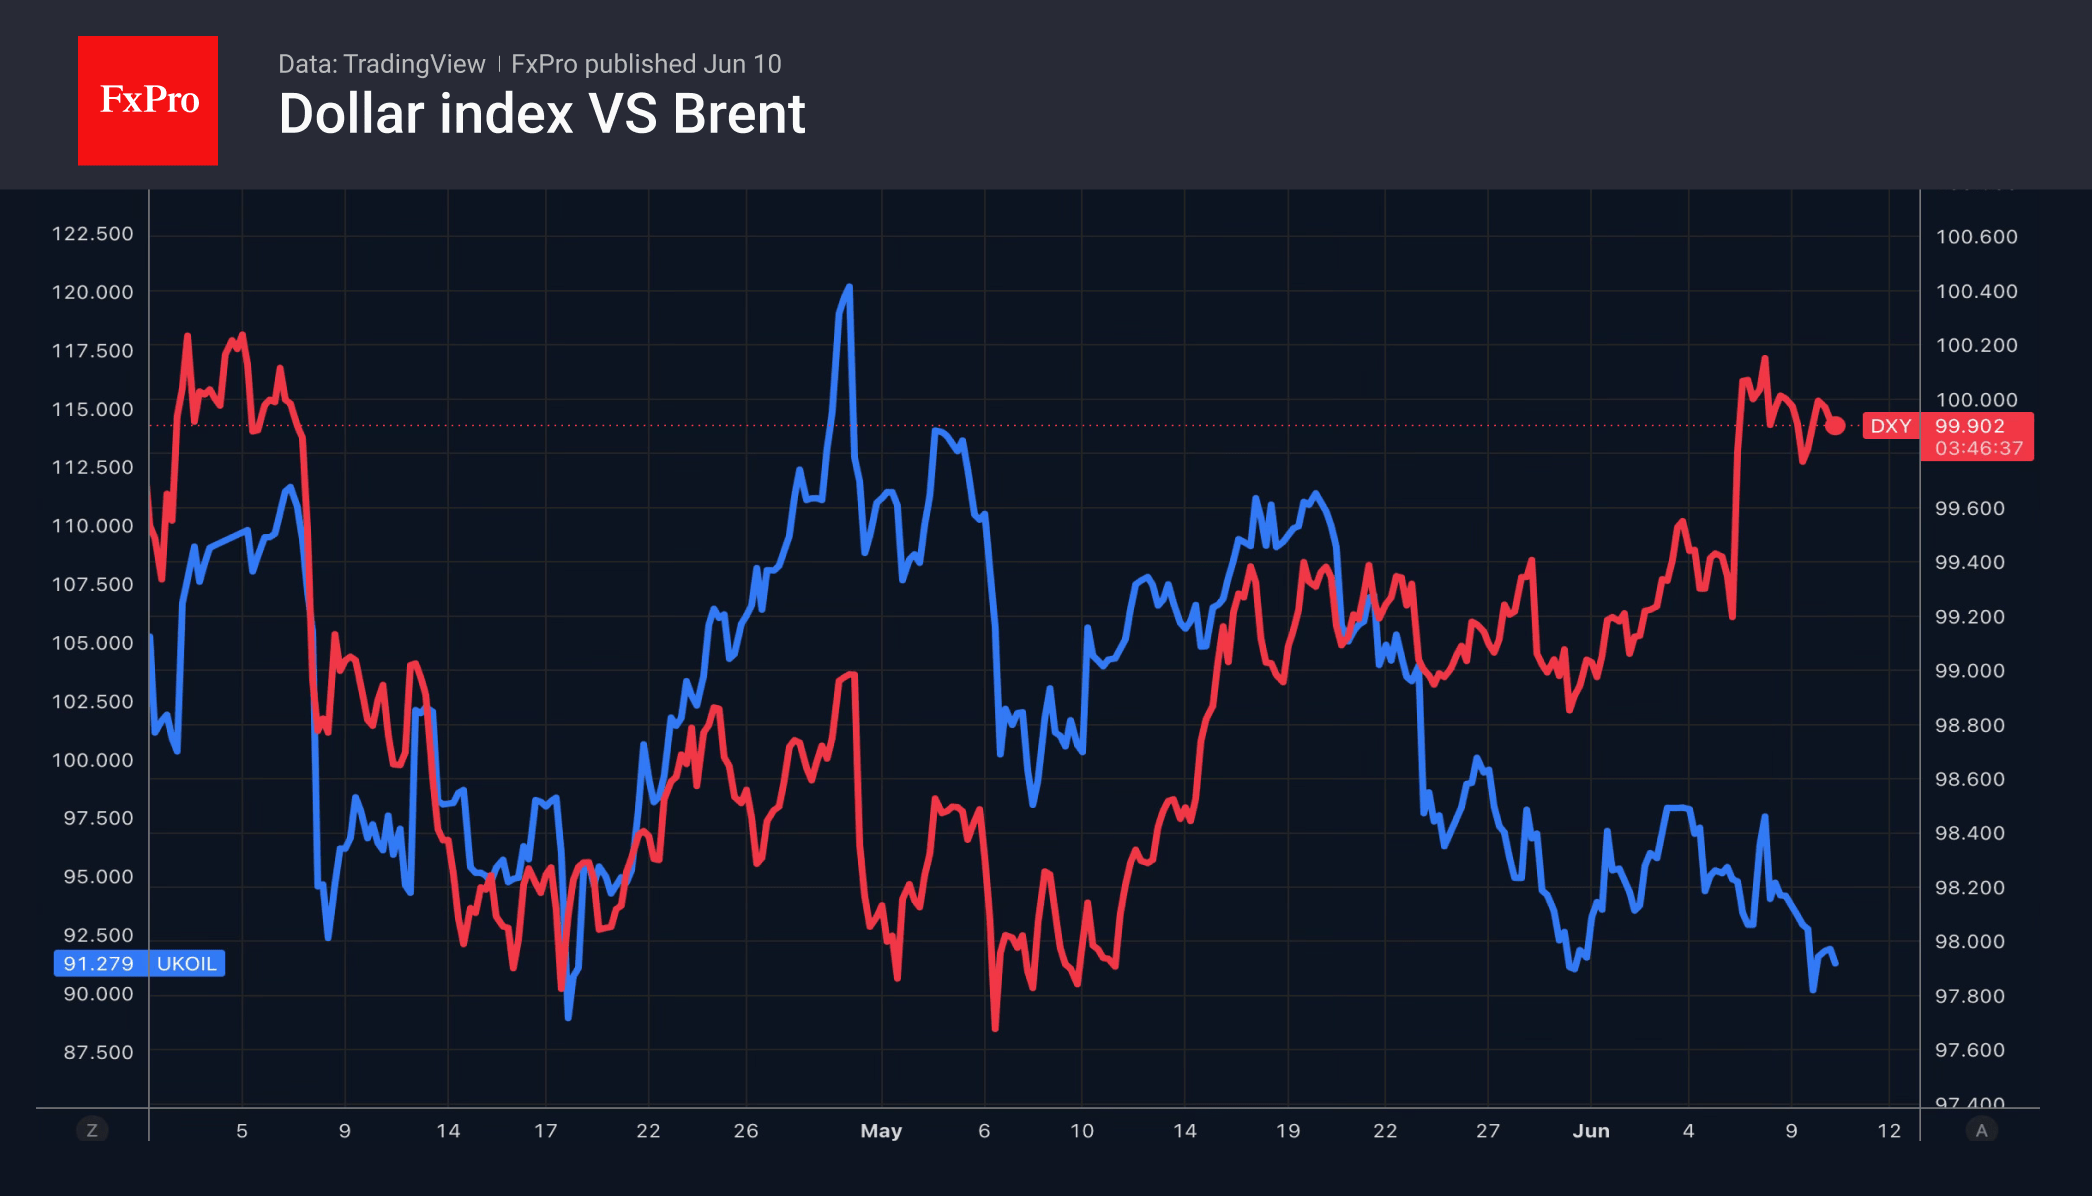
Oil: Escalation Is No Reason for a Rally
- The escalation in the Middle East has not led to a rise in Brent prices.
- The US dollar has been unable to capitalise on the favourable oil situation.
The US dollar has recorded modest gains amid the recent escalation of the conflict in the Middle East, while oil prices have fallen. This is typical behaviour during a relatively smooth reassessment of monetary policy prospects, rather than a nervous reaction to geopolitical events. A barrel of Brent crude is trading around $91, close to the lower end of the range over the past three months, despite clear signs of global stockpile depletion.
According to S&P Global Energy research, 500 million barrels are needed to replenish oil stocks outside the Persian Gulf. In other words, to return stocks to February levels by the end of the year, a surplus of 1 million barrels per day is required.
However, the market is paying more attention to the balance than to stocks. Brent is trading 30% above pre-conflict levels in the Middle East. At the same time, high prices are reducing global demand. China is a clear example, with oil imports falling to 7.8 million bpd in May, the lowest level in eight years. By comparison, the average for 2025 was almost 4 million bpd higher.
Coupled with record US energy exports, Saudi Arabia’s price cuts for its customers, and the resumption of supplies from Kuwait to Asia, these developments point to the oil market having adapted in recent weeks. Without this, oil would have been set to rise amid a 9.12-million-barrel decline in commercial stocks over the week and eight consecutive weeks of declines.
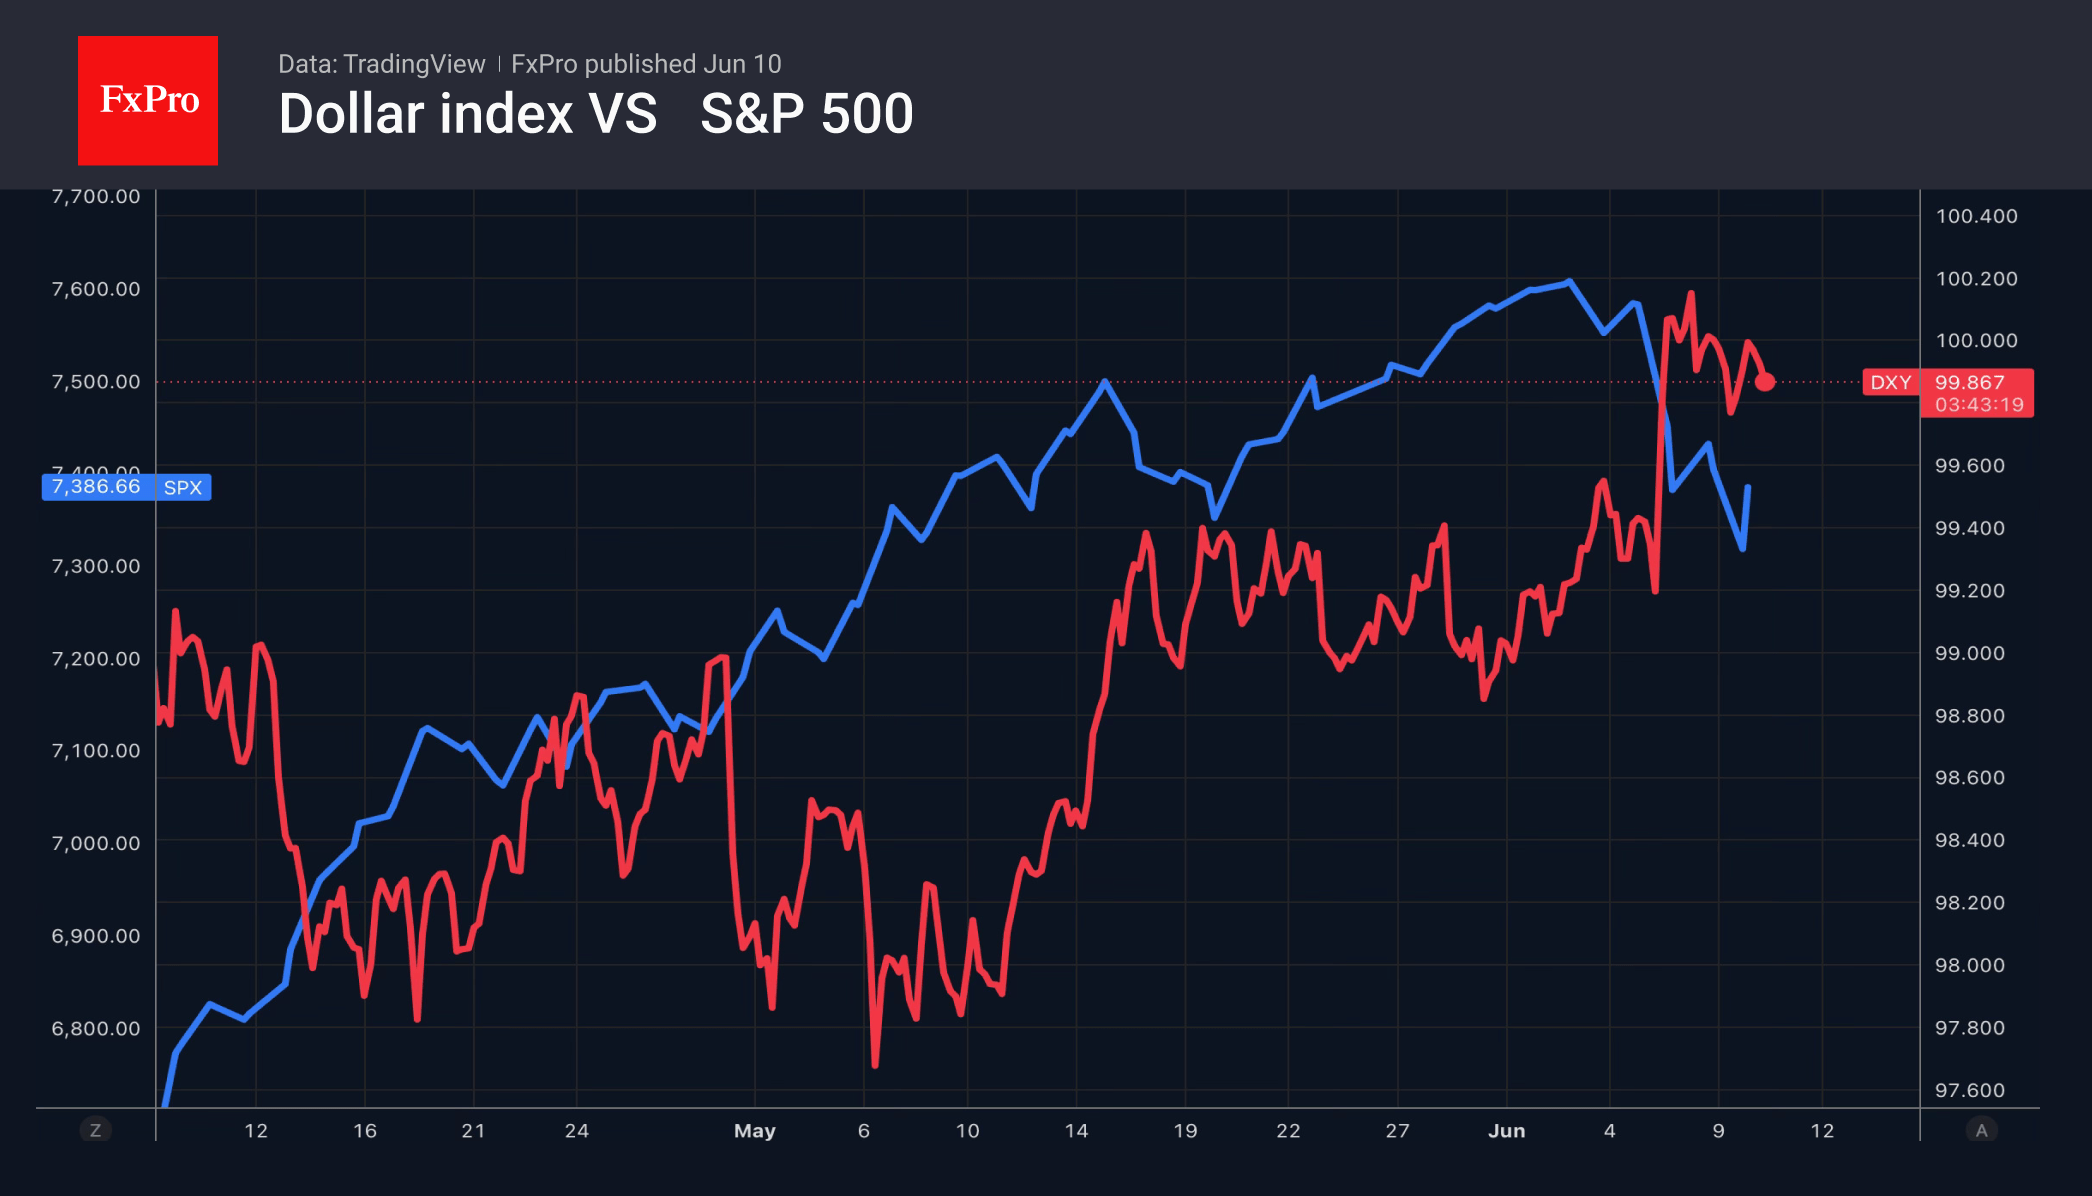
Without oil support, the US dollar is currently out of its depth. Neither the high demand for safe-haven assets nor the decline in global risk appetite—evident in the sell-off in equities and gold—is supporting the greenback. Fears that inflation will surge to three-year highs in May are fuelling rumours of a Fed rate hike and triggering sell-offs in tech stocks and the S&P 500.
Could inflation figures help the US dollar? Only if there are clear signs of accelerating price growth that even Warsh cannot ignore.