
Sample Category Title
Gold Price Holds Range — But Weakness Could Resurface
Key Highlights
- Gold started a downside correction from the $3,500 resistance zone.
- A key contracting triangle is forming with resistance at $3,335 on the 4-hour chart.
- EUR/USD is consolidating gains below the 1.1420 resistance zone.
- WTI Crude Oil prices are again moving lower below the $62.00 resistance.
Gold Price Technical Analysis
Gold prices started a downside correction from the $3,500 resistance zone. The price declined below the $3,420 and $3,350 support levels.
The 4-hour chart of XAU/USD indicates that the price even declined below $3,300. A low was formed at $3,260 and the price is now consolidating losses. The price is still well above the 200 Simple Moving Average (green, 4 hours) and the 100 Simple Moving Average (red, 4 hours).
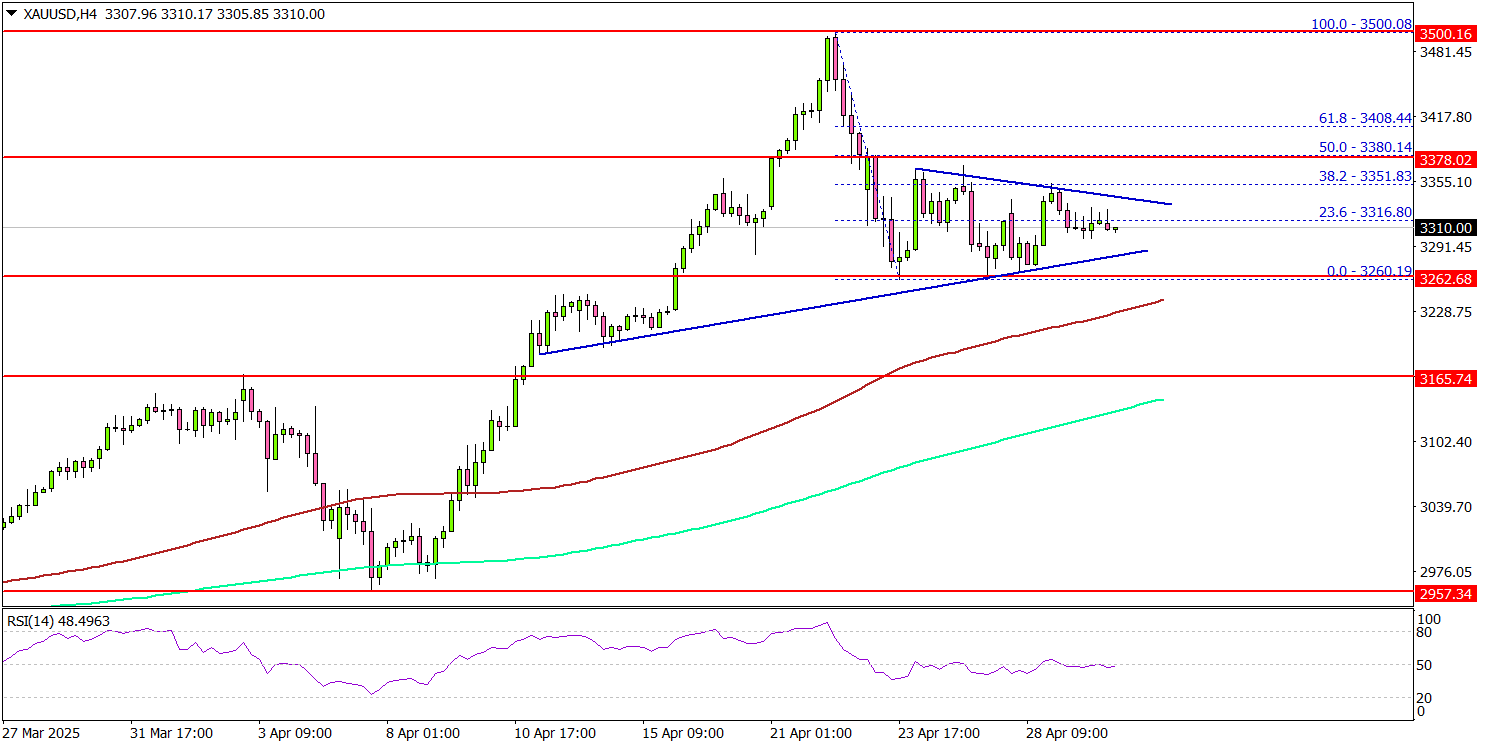
There is also a key contracting triangle forming with resistance at $3,335 on the same chart. On the upside, immediate resistance is near the $3,335 level.
The next major resistance sits near the $3,350 level. A clear move above the $3,350 resistance could open the doors for more upsides. The next major resistance could be $3,380, above which the price could rally toward the milestone level of $3,420.
On the downside, initial support is near the $3,285 level. The first key support is near $3,265. The next major support is near the $3,250 level. The main support is now $3,235. A downside break below the $3,235 support might call for more downsides. The next major support is near the $3,200 level.
Looking at EUR/USD, the pair started a short-term downside correction and might soon aim for a fresh increase if it clears the 1.1420 resistance.
Economic Releases to Watch Today
- US Gross Domestic Product for Q1 2025 (Preliminary) – Forecast 0.4% versus previous 2.4%.
- US Personal Income for March 2025 (MoM) - Forecast +0.4%, versus +0.8% previous.
S&P 500 Index Wave Analysis
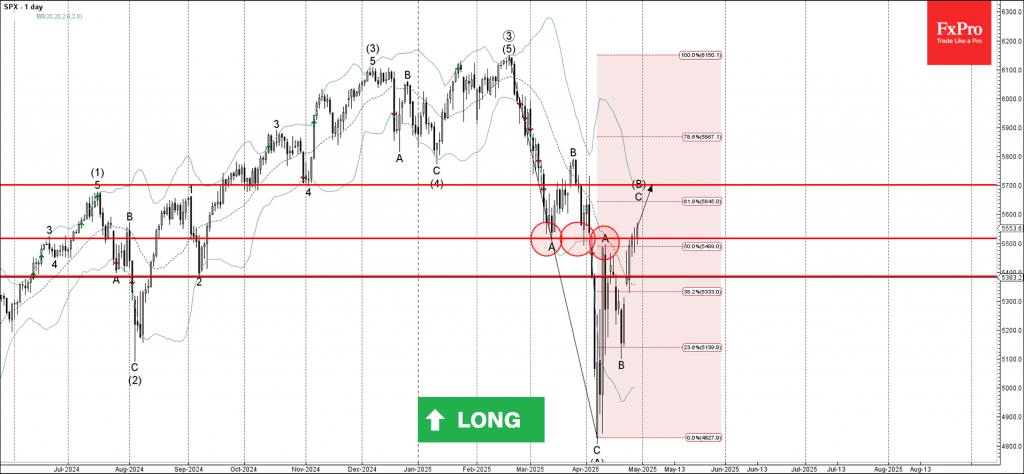
S&P 500 index: ⬆️ Buy
- S&P 500 index broke key resistance level 5500.00
- Likely to rise to resistance level 5700.00
S&P 500 index recently broke the key resistance level 5500.00 (former support from March, which also stopped A-wave of the active ABC correction B from the start of April).
The breakout of the resistance level 5500.00 coincided with the breakout of the 50% Fibonacci correction of the downward impulse from February.
S&P 500 index can be expected to rise toward the next resistance level 5700.00, target price for the completion of the active impulse wave C.
WTI Wave Analysis
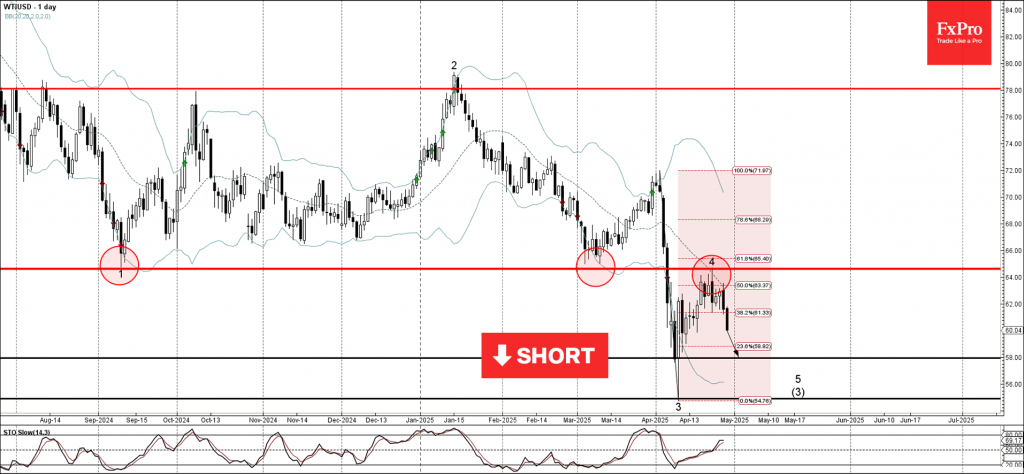
WTI: ⬇️ Sell
- WTI reversed from the resistance area
- Likely to fall to support level 58.00
WTI crude oil recently reversed from the resistance area between the resistance level 64.60 (former multi-month low from September 2024), the 20-day moving average and the 61.8% Fibonacci correction of the downward impulse from the start of April.
The downward reversal from this resistance started the active short-term impulse wave 5, which belongs to the intermediate impulse sequence from last year.
Given the clear daily uptrend, WTI crude oil can be expected to fall toward the next support level 58.00.
Strong Franc Sparks Bets on SNB Negative Rates
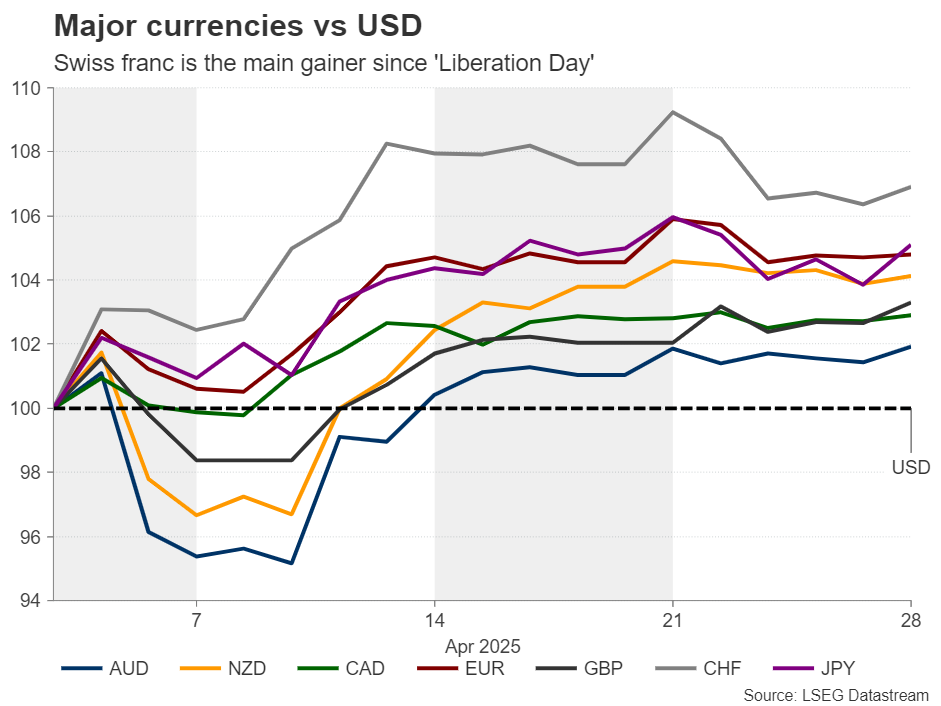
- Franc the main FX winner since “Liberation Day”.
- Could hit Swiss exports, lead the nation into deflation.
- How will the SNB respond: Negative rates or intervention?
- Risk reversals point to strong setback should appetite improve further.
Swiss franc the ultimate FX haven
The Swiss franc seems to be the ultimate safe haven in the FX arena amidst the market turbulence caused by US President Trump’s trade policy and the rhetoric surrounding it. Since the so-called “Liberation Day,” when Trump announced tariffs on all the US’s main trading partner, the franc has been the best performing major currency, with the other safe haven, the Japanese yen, taking second place. In third place, very close to the yen, stands the euro, which benefited from the selling of US assets amid recession fears by the recent fiscal shift in Germany.
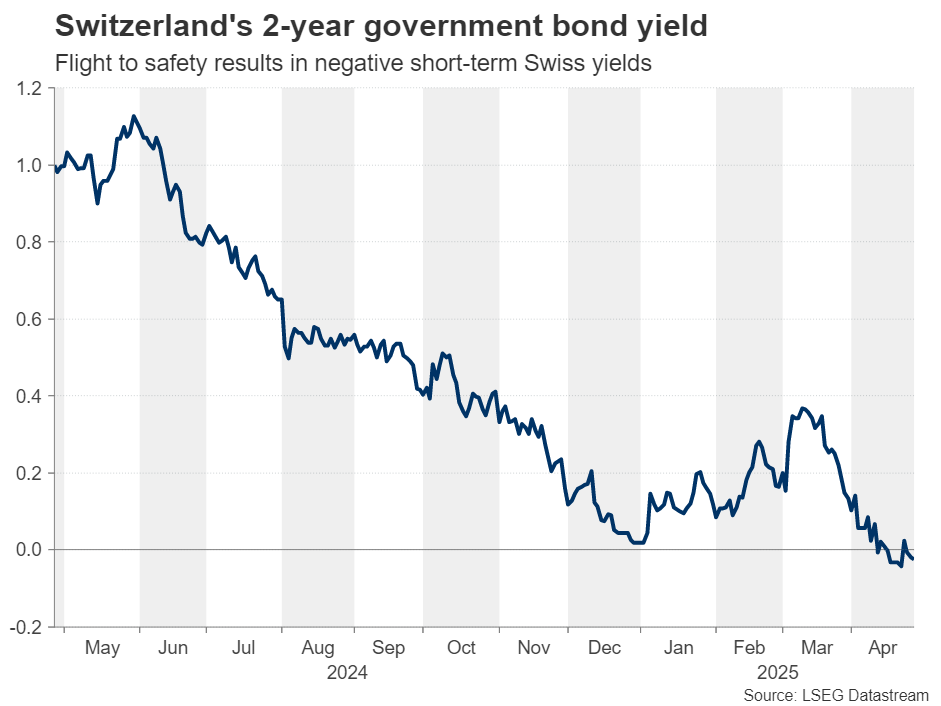
But why did the franc gain the most? Why didn’t the yen follow suit? Switzerland is considered a safe-haven destination for investors due to its strong banking and financial system, its political stability and neutrality, its trade surplus, its favourable tax laws and its strong legal system. Investors were so willing to divert their flows there that they allowed the Swiss 2-year government bond yield to drop into negative territory. This means that investors are willing to lose some money in nominal terms in exchange for the safety of their capital. The yen did not perform in a similar manner, perhaps as traders scaled back their BoJ rate hike bets amid the trade uncertainty.
Surge threatens exporters, increases deflation risk
Having said all that, the appreciation of the franc is a major threat to Swiss exporters as it raises the price of what Switzerland’s trading partners are paying for Swiss goods. Switzerland is a net exporting nation, and the biggest importer of its products is the European Union. Although the euro also appreciated, it did not shine as the franc, leading to a drop in euro/franc and an increase in the price of Swiss products in the rest of Europe.
And the timing couldn’t be worse as US tariffs are also threatening Swiss exporters. On April 2, the US imposed a 31% tariff rate on Swiss goods, before the broader 90-day delay was announced.
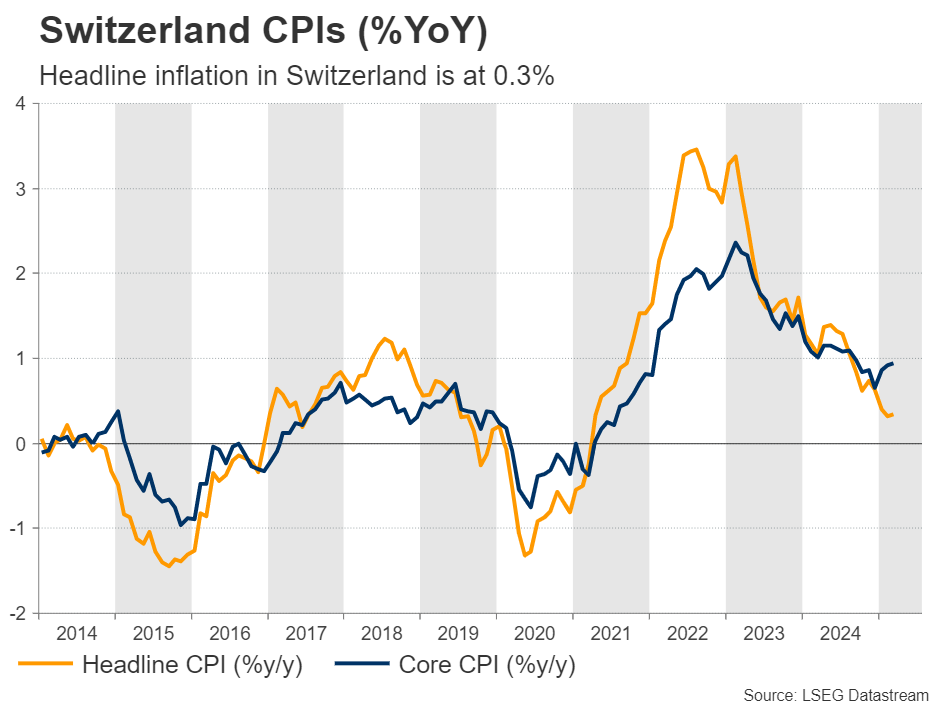
All this could weigh on Swiss inflation and it is very likely to result in deflation. After all, the year-over-year CPI rate in Switzerland is already very low, at 0.3%. And the big question on many market participants’ minds nowadays may be: How will the Swiss National Bank (SNB) respond to that?
Negative interest rates or Intervention
There are two channels through which the SNB had battled the appreciation of the franc. One is through cutting interest rates as most central banks around the globe are doing, and the other is through intervention, by buying its own currency and selling foreign reserves.
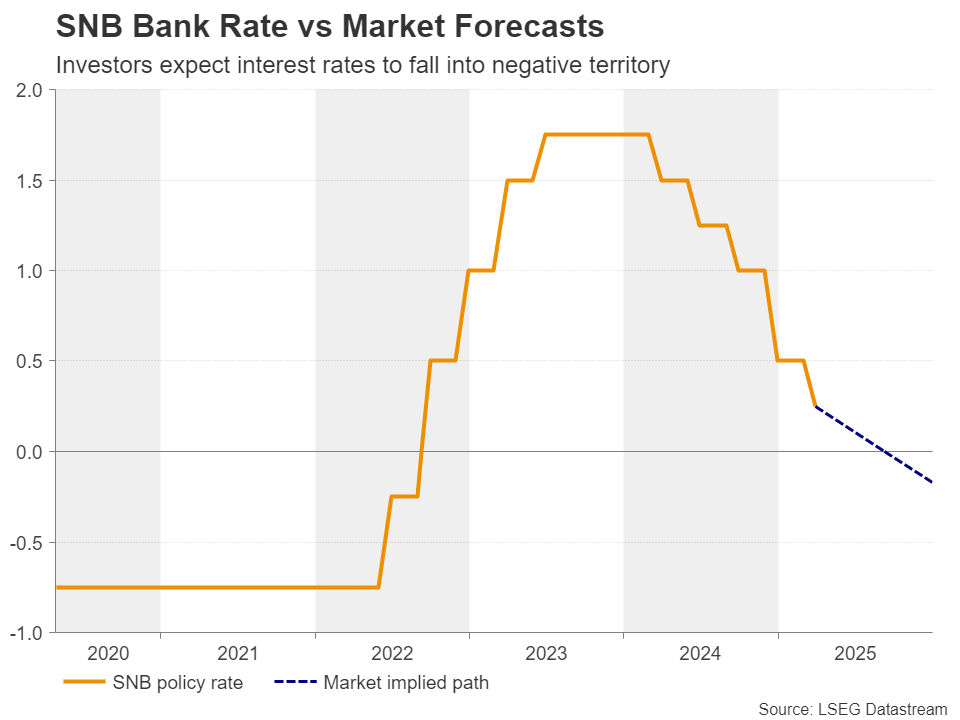
Getting the ball rolling with interest rates, the SNB has the lowest benchmark rate among major central banks, currently at 0.25%, and the franc’s appreciation may have raised speculation that policymakers could push interest rates into negative territory again. Indeed, according to Switzerland’s Overnight Index Swaps (OIS) market, there is an around 80% chance for a quarter-point cut to zero at the Bank’s next decision on June 19, with another 10bps worth of cuts expected by September.
SNB Chairman Martin Sclegel has not ruled out the likelihood of interest rates diving into negative territory but noted several times in the past that such a step would not be taken lightly.
This makes the option of intervention as the more likely one. Or not? According to a Bloomberg analyst-based survey, most participants predict that the Bank will avoid cutting interest rates below zero, with only Goldman Sachs holding such a forecast.
Nonetheless, intervention will not come without consequences. Such a policy risks stirring the US hornets’ nest, with Trump likely branding again Switzerland as currency manipulator as he did back in 2020. Although this could weaken Switzerland’s negotiating hand in potential trade talks, the President of the Swiss Confederation Karin Keller-Sutter said recently that she is not worried about that, which keeps intervention as a more likely option than negative interest rates.
The painless way
The painless way is for the Swiss franc to further weaken on its own. The SNB could still cut interest rates to zero, but officials could refrain from taking them into negative zone and also abstain from intervening. However, for that to happen, risk aversion may need to improve further, driven by new headlines about easing tariff tensions and the potential of trade negotiations.
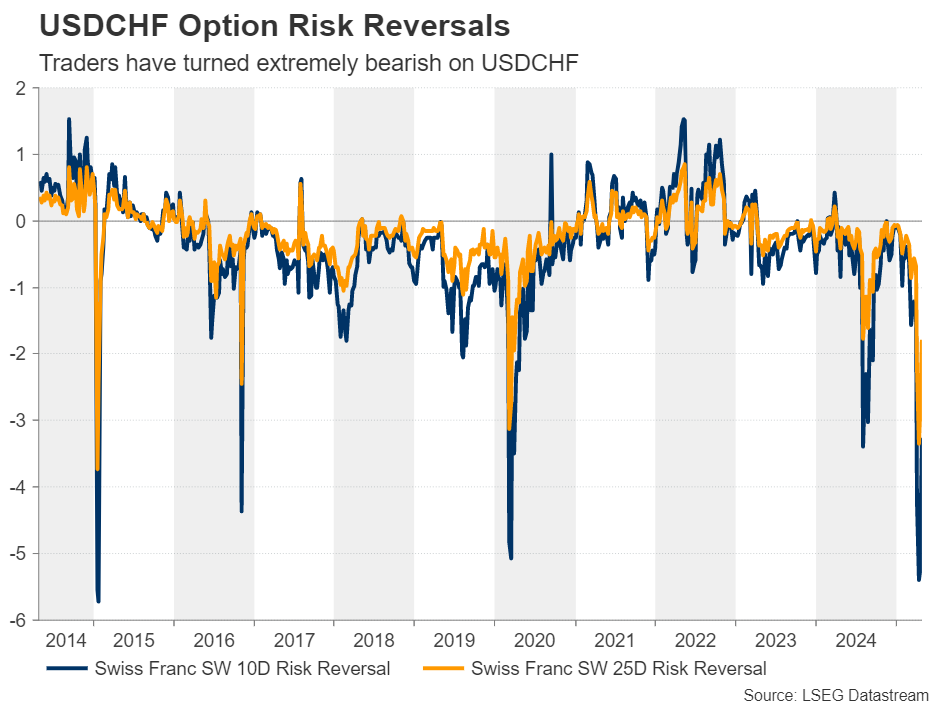
The Swiss franc could fall notably, leading to impressive rebounds in franc pairs. What supports this notion is the fact that, on April 11, the 10-day and 25-day risk reversals of dollar/franc options hit their lowest since January 2015, when the SNB abandoned the 1.20 floor in euro/franc. This points to extremely bearish conditions, which suggests that there may be very little room for the franc to appreciate further and a lot of downside potential in case the broader market environment brightens further.
May Flashlight for the FOMC Blackout Period: Waiting for the Fog to Lift
Summary
- We expect the FOMC will leave its target range for the federal funds rate unchanged at 4.25-4.50% at its upcoming meeting on May 6-7, a view widely shared by financial markets and economists. Market pricing currently implies only a 9% probability of the FOMC cutting the fed funds rate by 25 bps.
- Since the FOMC concluded its last policy meeting on March 19, the Trump administration has announced unprecedented changes to trade policy. While some of these plans have been temporarily paused, tariffs remain significantly higher than what was generally anticipated prior to the April 2 "Liberation Day" announcement. After severe turmoil in financial markets initially following the announcement, markets have calmed somewhat, but financial conditions remain tighter than when the FOMC gathered nearly six weeks ago.
- "Soft" survey data on consumer and business sentiment have also weakened sharply over the past six weeks. Yet, "hard" economic data have remained in good shape. Steady initial jobless claims point to the labor market maintaining its footing, while the year-over-year rate of core PCE inflation is on track to ease to a four-year low of 2.6% when data for March print on April 30.
- Public comments by Fed officials during the inter-meeting period have emphasized the uncertainty that hangs over the outlook as a result of the changing trade environment. Higher tariffs present a tricky challenge for the Committee, as they threaten to both weaken the labor market and raise prices. There seems to be broad consensus on the Committee that the current monetary policy setting is well positioned to respond to changes in the outlook that threaten either side of the dual mandate.
- Our current forecast looks for the FOMC to reduce the federal funds rate by 125 bps this year, starting with the June meeting. Some dialing back in the U.S. posture on tariffs, the relatively benign run of recent "hard" data and the patient comments from key Fed officials in recent weeks lead us to believe the risks are skewed toward the first rate cut occurring later than the June meeting. That said, with monetary policy still somewhat restrictive and weaker economic growth expected to weigh on the labor market in the months ahead, we still think the FOMC will reduce the federal funds rate this year by more than the 50 bps implied by the median projection in the March meeting's summary of economic projections.
When in Doubt, Wait It Out
Unprecedented changes in U.S. trade policy, which have caused financial markets to whipsaw, have dominated the headlines since the Federal Open Market Committee (FOMC) concluded its last policy meeting on March 19. President Trump announced his "Liberation Day" tariffs on April 2. As we noted in a report we published at that time, Trump imposed a 10% universal levy on all of America's trading partners. Additionally, he announced "reciprocal" tariff rates that were based largely on the size of an individual country's bilateral trade surplus with the United States.
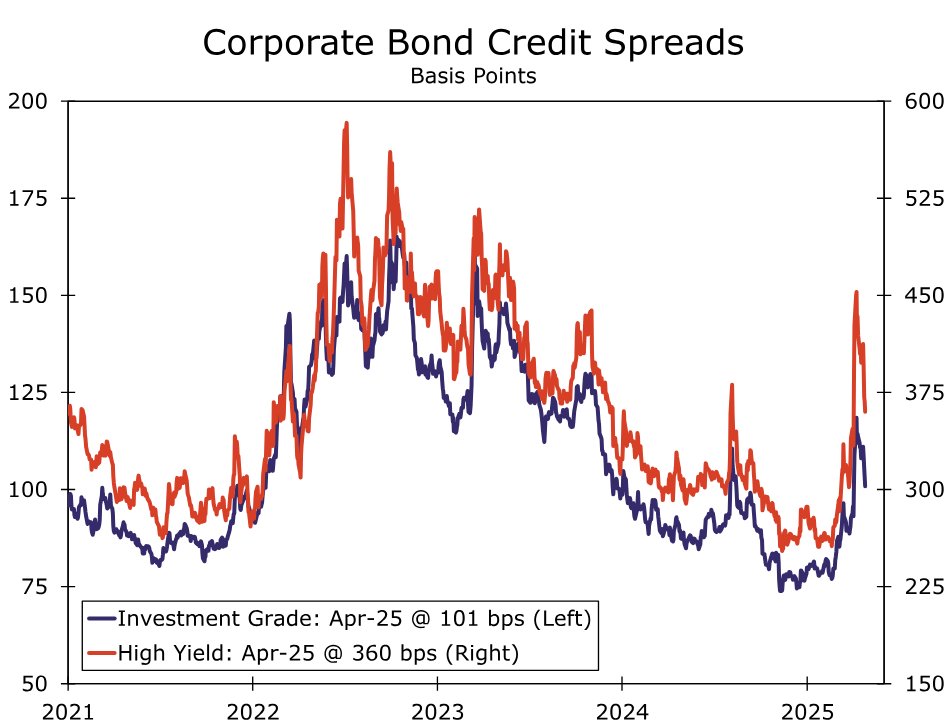
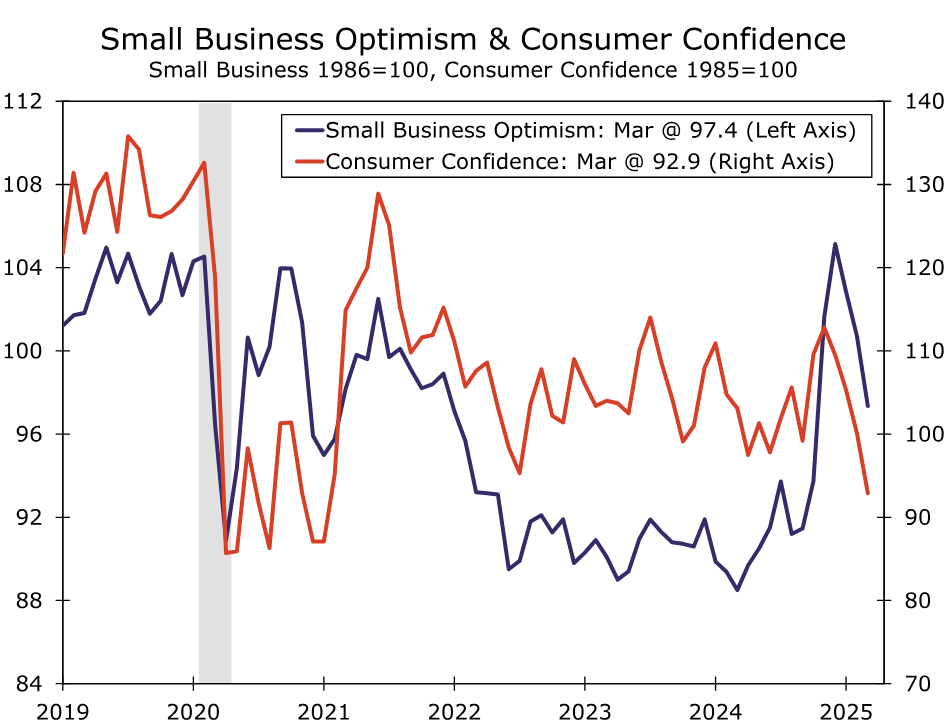
The reciprocal tariff rates, which were generally higher than most observers had expected, immediately caused financial markets to nosedive. The S&P 500 index plunged about 15% between its close on April 2 and its low on April 7, while corporate bond spreads widened markedly (Figure 1). Financial markets have steadied, due in part to the president's decision on April 9 to pause implementation of the reciprocal tariffs for 90 days, but stock market indices generally remain lower and corporate bond spreads wider than when the FOMC last met. "Soft" data that measure consumer and business sentiment generally have deteriorated over the past six weeks or so (Figure 2). The optimism component of the NFIB small business survey has fallen to its lowest level since the November elections while the Conference Board's measure of consumer confidence has retreated to its lowest level since the pandemic.
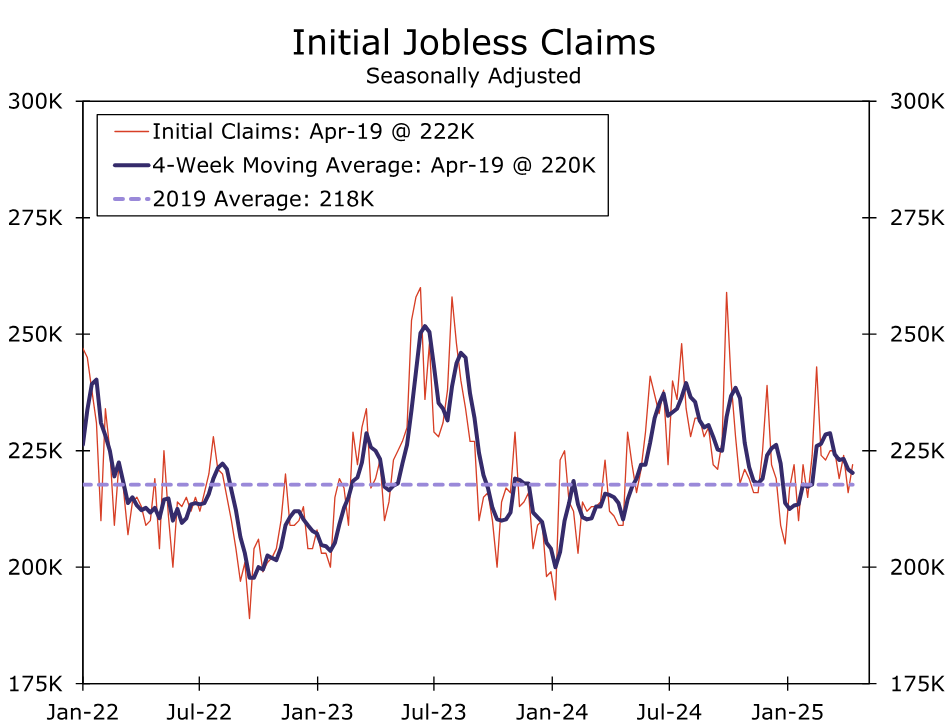
That said, there are few signs of doom and gloom in the "hard" data. The employment report released on April 4 showed nonfarm payrolls growing a strong 228K in March, while the 0.1 percentage point rise in the unemployment rate was due largely to rounding effects. The number of individuals filing for unemployment insurance for the first time has remained low in recent weeks, indicating that businesses remain hesitant to displace workers (Figure 3). Retail spending increased by a robust 1.4% in March relative to the previous month, although some of this strength likely reflects consumer purchases ahead of tariff-related price increases or shortages. Even manufacturing output rose at a respectable 5.6% annualized pace in Q1.
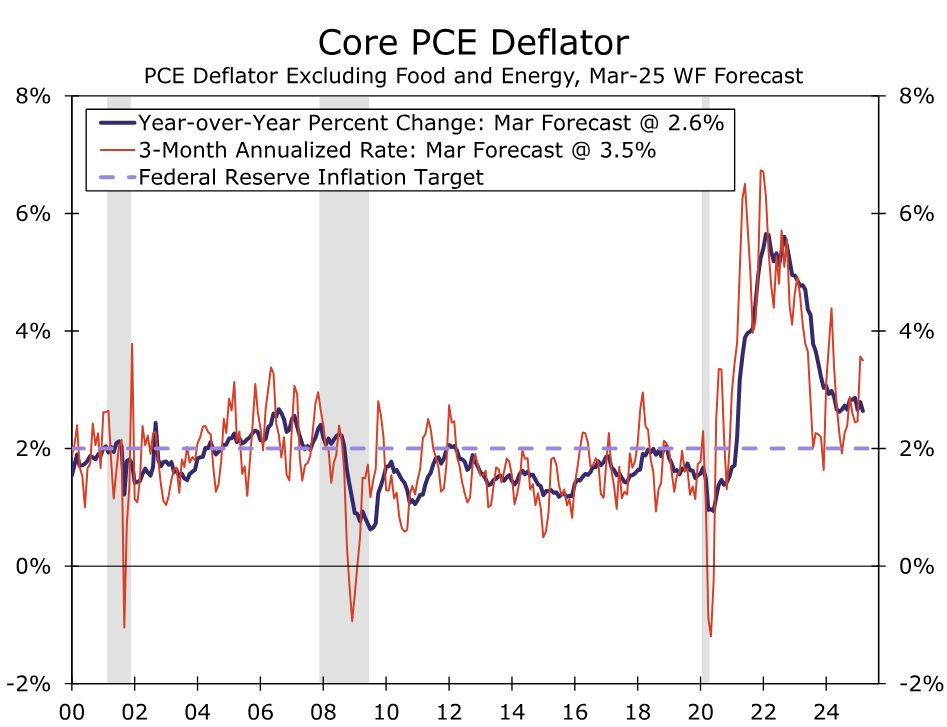
On the inflation front, there are few signs of tariff-related increases in consumer prices, at least thus far. Excluding food and energy prices, the consumer price index (CPI) edged up only 0.1% in March relative to February. We project the core PCE deflator, which most Fed officials believe is a better measure of underlying price growth than the core CPI, also will rise only 0.1% in March. (PCE inflation data for March are scheduled for release on April 30.) If realized, the year-over-year rate of core PCE inflation would drop to 2.6%, the lowest rate since March 2021 (Figure 4).
Of course, hard data tend to be backward looking, and it is still far too early to proclaim that the president's tariffs, both implemented and threatened, have been a non-event for the U.S. economy. Fed Governor Christopher Waller used the words "uncertain" or "uncertainty" ten times in a speech on the U.S. economic outlook that he delivered on April 14. A few days later, Chairman Jerome Powell stated that "the U.S. economy is still in a solid position," but he noted that the effects of the administration's policy changes "on the economy remain highly uncertain." Powell went on to say that, for now, the FOMC is "well positioned to wait for greater clarity before considering any adjustments to our policy stance." John Williams, the president of the Federal Reserve Bank of New York, said that the U.S. economy, is "in a very good place" and that he does not "see the need to change the fed funds rate any time soon." Other Fed officials also have made clear that they want to await further clarity in the economic data and on the economic policy front before changing course for U.S. monetary policy.
Given these recent public comments by Federal Reserve officials, we firmly believe the FOMC will keep its policy stance unchanged at the conclusion of its meeting on May 7. Our expectation is also reflected in current market pricing which, as of this writing, implies a 9% probability of a 25 bps rate cut on May 7. We also expect the post-meeting statement and press conference to remain noncommittal about future policy action in an effort to preserve maximum flexibility. The statement may change to more directly emphasize the uncertainty and risks caused by the recent changes to trade policy, but otherwise we see few other changes to the statement. In the press conference, Chair Powell probably will reiterate that uncertainty remains high but that policy is well positioned to respond to conditions as they evolve to both sides of the dual mandate. We will be listening closely for any signs of how Powell and the rest of the Committee are thinking about the balance of risks to the dual mandate and how timing effects may influence future policy decisions (e.g., what if price increases occur before layoffs, or vice versa?).
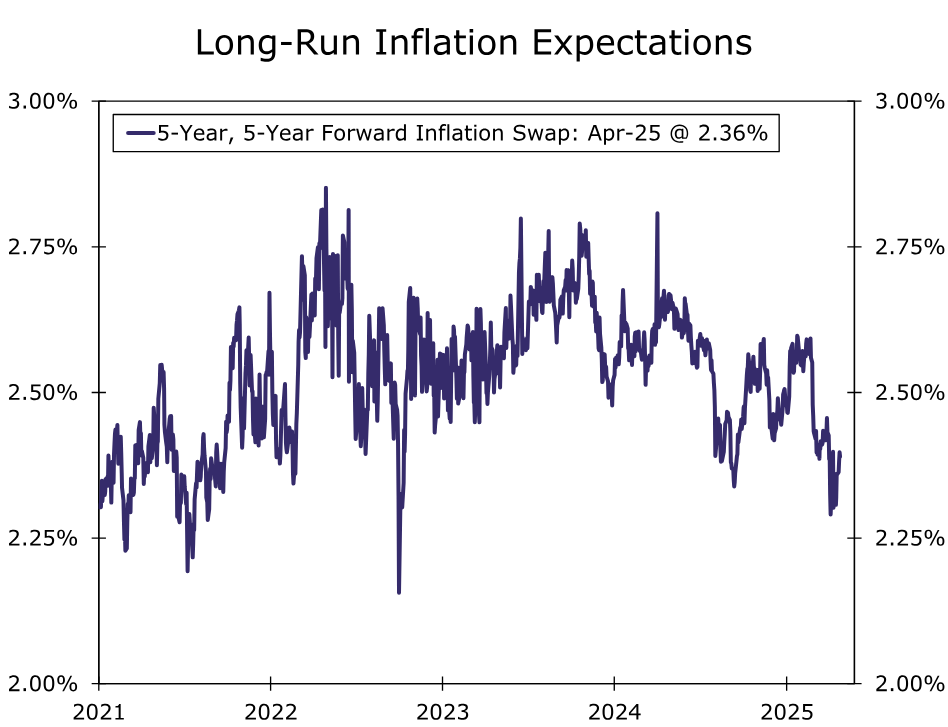
We believe the hit to U.S. economic growth and the labor market from higher tariffs will induce the FOMC to move toward a more neutral policy stance as the year progresses, even in the face of higher inflation. Econometric models suggest that the increase in inflation from tariffs should be transitory so long as long-term inflation expectations remain well-anchored. Although the University of Michigan's survey of consumer sentiment has shown rising long-term inflation expectations in recent reports, other surveys, such as the New York Fed's Survey of Consumer Expectations, have not shown the same increase. Furthermore, market-based measures of longer-term inflation expectations remain well-anchored and actually have fallen slightly in the weeks since President Trump announced his Liberation Day tariffs on April 2 (Figure 5).
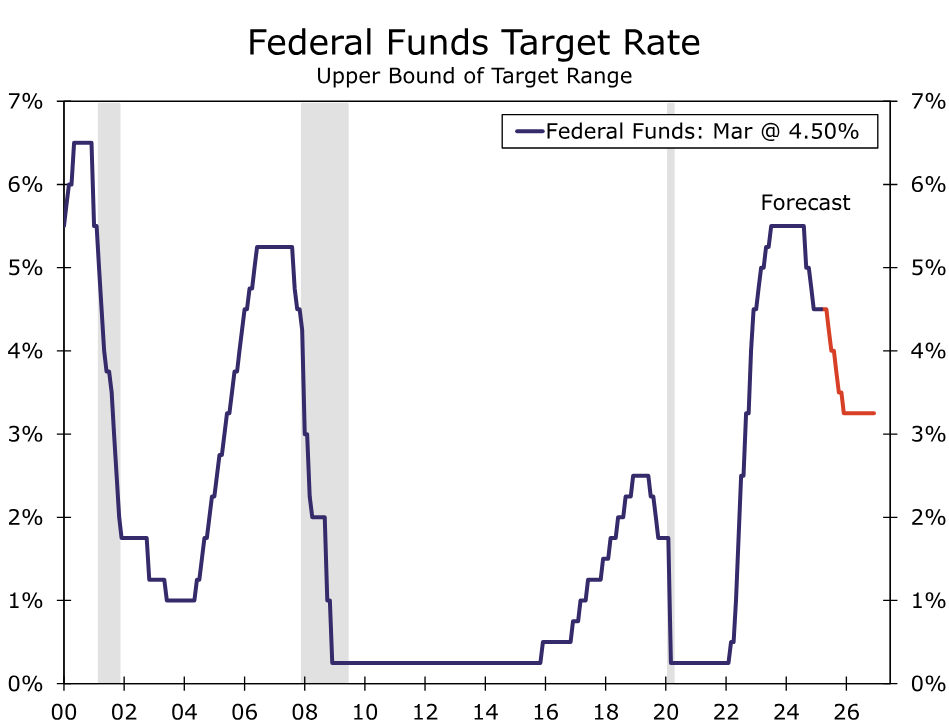
Our current forecast looks for the FOMC to reduce the federal funds rate by 125 bps this year, with no change to the policy rate in 2026 (Figure 6). More specifically, our forecast projects five 25 bps rate cuts at the final five FOMC meetings of the year, starting with the June meeting. Some dialing back in the U.S. posture on tariffs, the relatively benign run of recent "hard" data and the patient comments from key Fed officials in recent weeks lead us to believe the risks are skewed toward the first rate cut occurring later than the June meeting. That said, we still think the FOMC will reduce the federal funds rate this year by more than the 50 bps implied by the median projection in the March meeting's summary of economic projections. We will update our economic forecast the week of May 5, after we have heard from the FOMC and seen the April employment report.
Lost Confidence: Consumers Increasingly Worried About Job Prospects
Summary
The drop in March Consumer Confidence tells us that while households are not overly pessimistic on current conditions, they're growing increasingly worried about the future—particularly when it comes to employment prospects and their income.
Slippery Slope
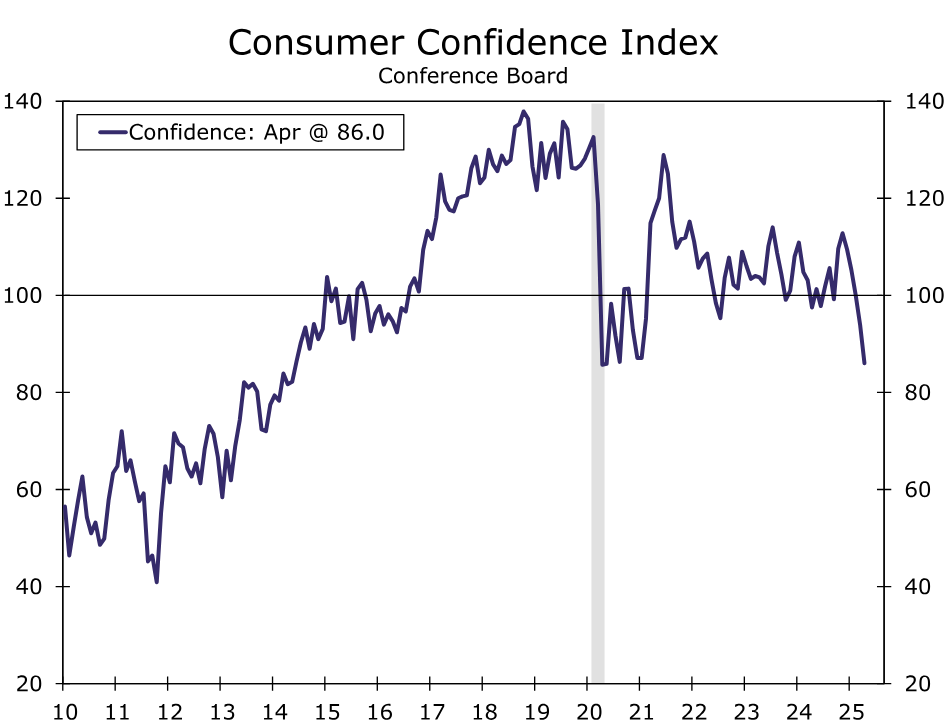
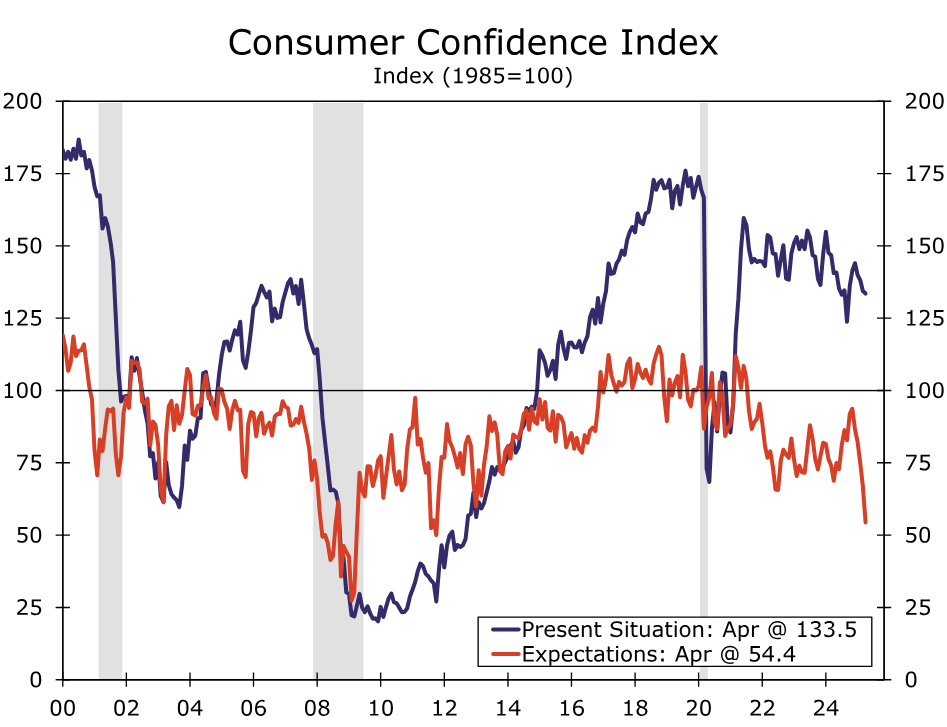
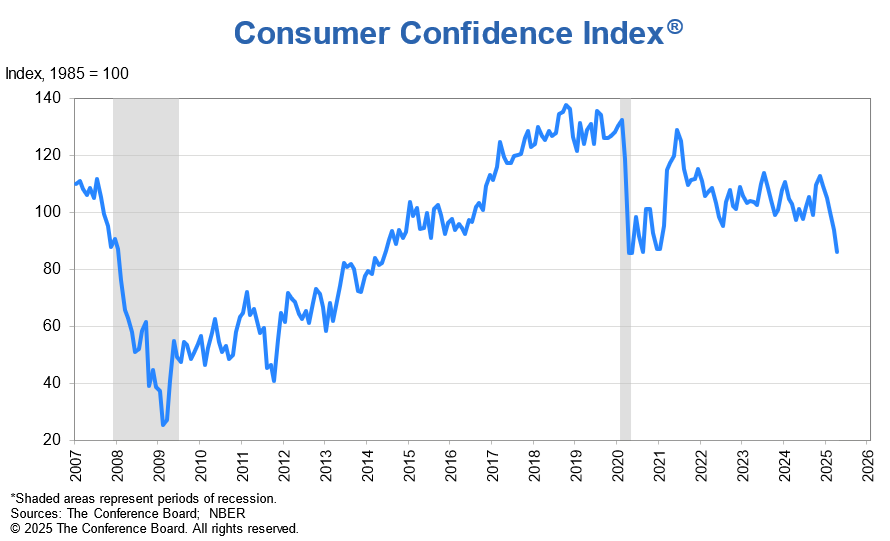
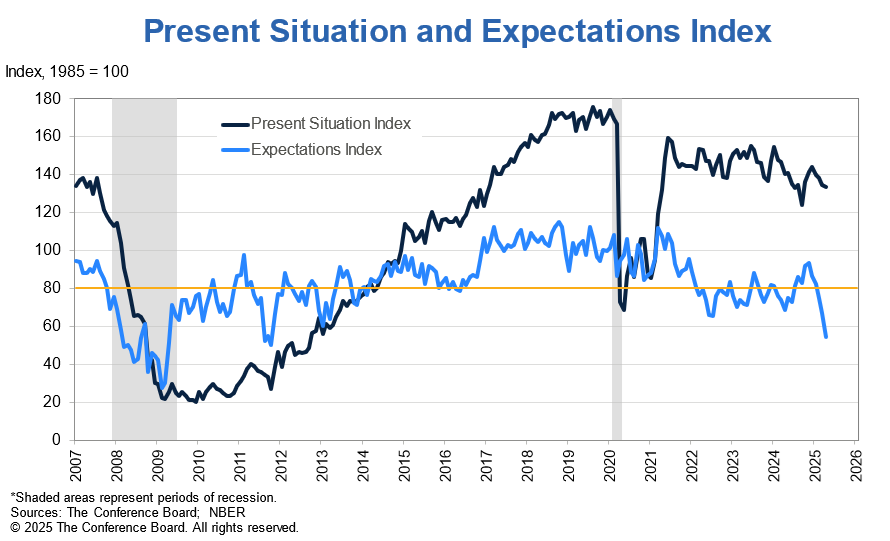
Consumers are growing more and more anxious about their financial situation. The Conference Board's Consumer Confidence Index slipped for the fifth-straight month to 86.0 in March, which rivals the lows hit during the pandemic (chart). While households have grown more uneasy about their current situation, decreased expectations around the future is what's driving optimism lower today. The present situation index slipped to 133.5, which is only about eight percentage points off its post-pandemic average, while at 54.4 the expectations index is comfortably in the low-end of its recent range (chart).
It's not hard to justify consumer angst today. Talk around tariffs has spooked consumers into believing inflation will be higher in the future, and its depressed their expectations around the economy generally. Inflation expectations are up, with the median by this measure reaching 6% in April, or the highest since mid-2022. The separate Consumer Sentiment report out of the University of Michigan more closely tracks household feelings around financial metrics, like expectations around inflation. This Confidence report is a better gauge of business conditions and employment.
To that end, an increasing share of households (34.8%) expect business conditions to worsen in the next six months, while more households (18.2%) also expect income to weaken. For the first time since July 2022, more households expect income to decrease than increase in the next six-months.
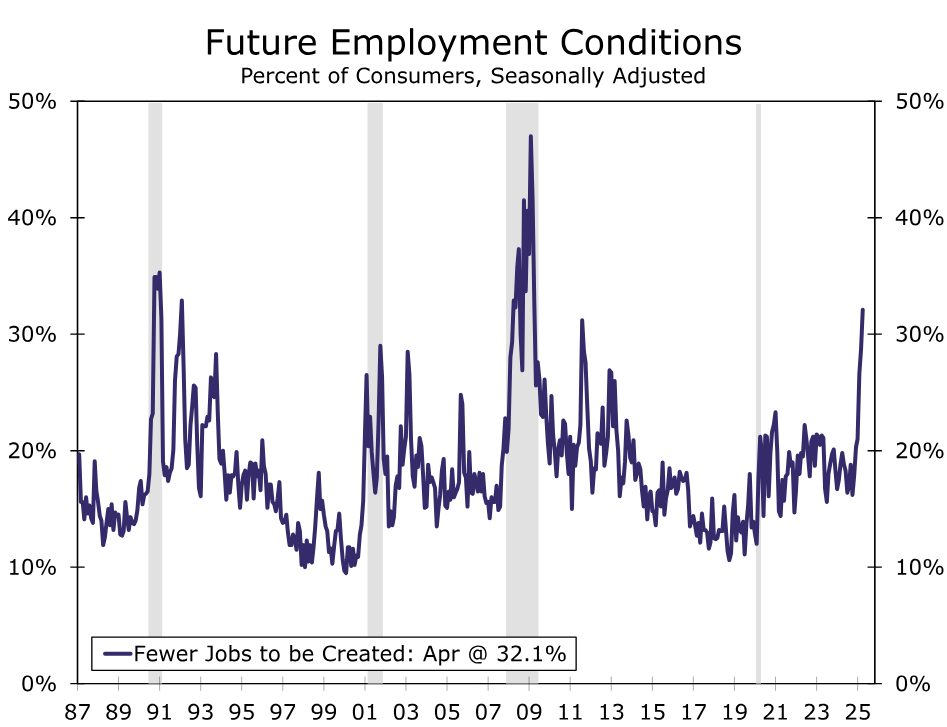
This all stems from fear of job prospects. Consumer views on the labor market weakened in April, revealing broad worry about the outlook for future employment conditions. The labor differential, or the share of consumers reporting jobs as “plentiful” less those reporting jobs as “hard to get,” fell to 15.1%, its lowest reading in seven months. The 2.4 percentage point drop from 17.5% in March was driven both by a decrease in those reporting jobs as plentiful and an increase in those reporting them as hard to get. Further, the share of consumers expecting there to be fewer jobs created over the next six months rose to 32.1% in April from 28.8% in March—this gauge of labor market expectations is now higher than at any time since 2009 (chart).
Current data suggest the labor market remains stable. While businesses aren't hiring as much, they're not laying off workers in droves either—the level of job openings in the economy continues to subside, but claims for unemployment insurance remain in-check. While a further deterioration in the labor market would force a pull back in consumer spending, continued uncertainty could be enough to spook consumers. Pessimism can be a slippery slope.
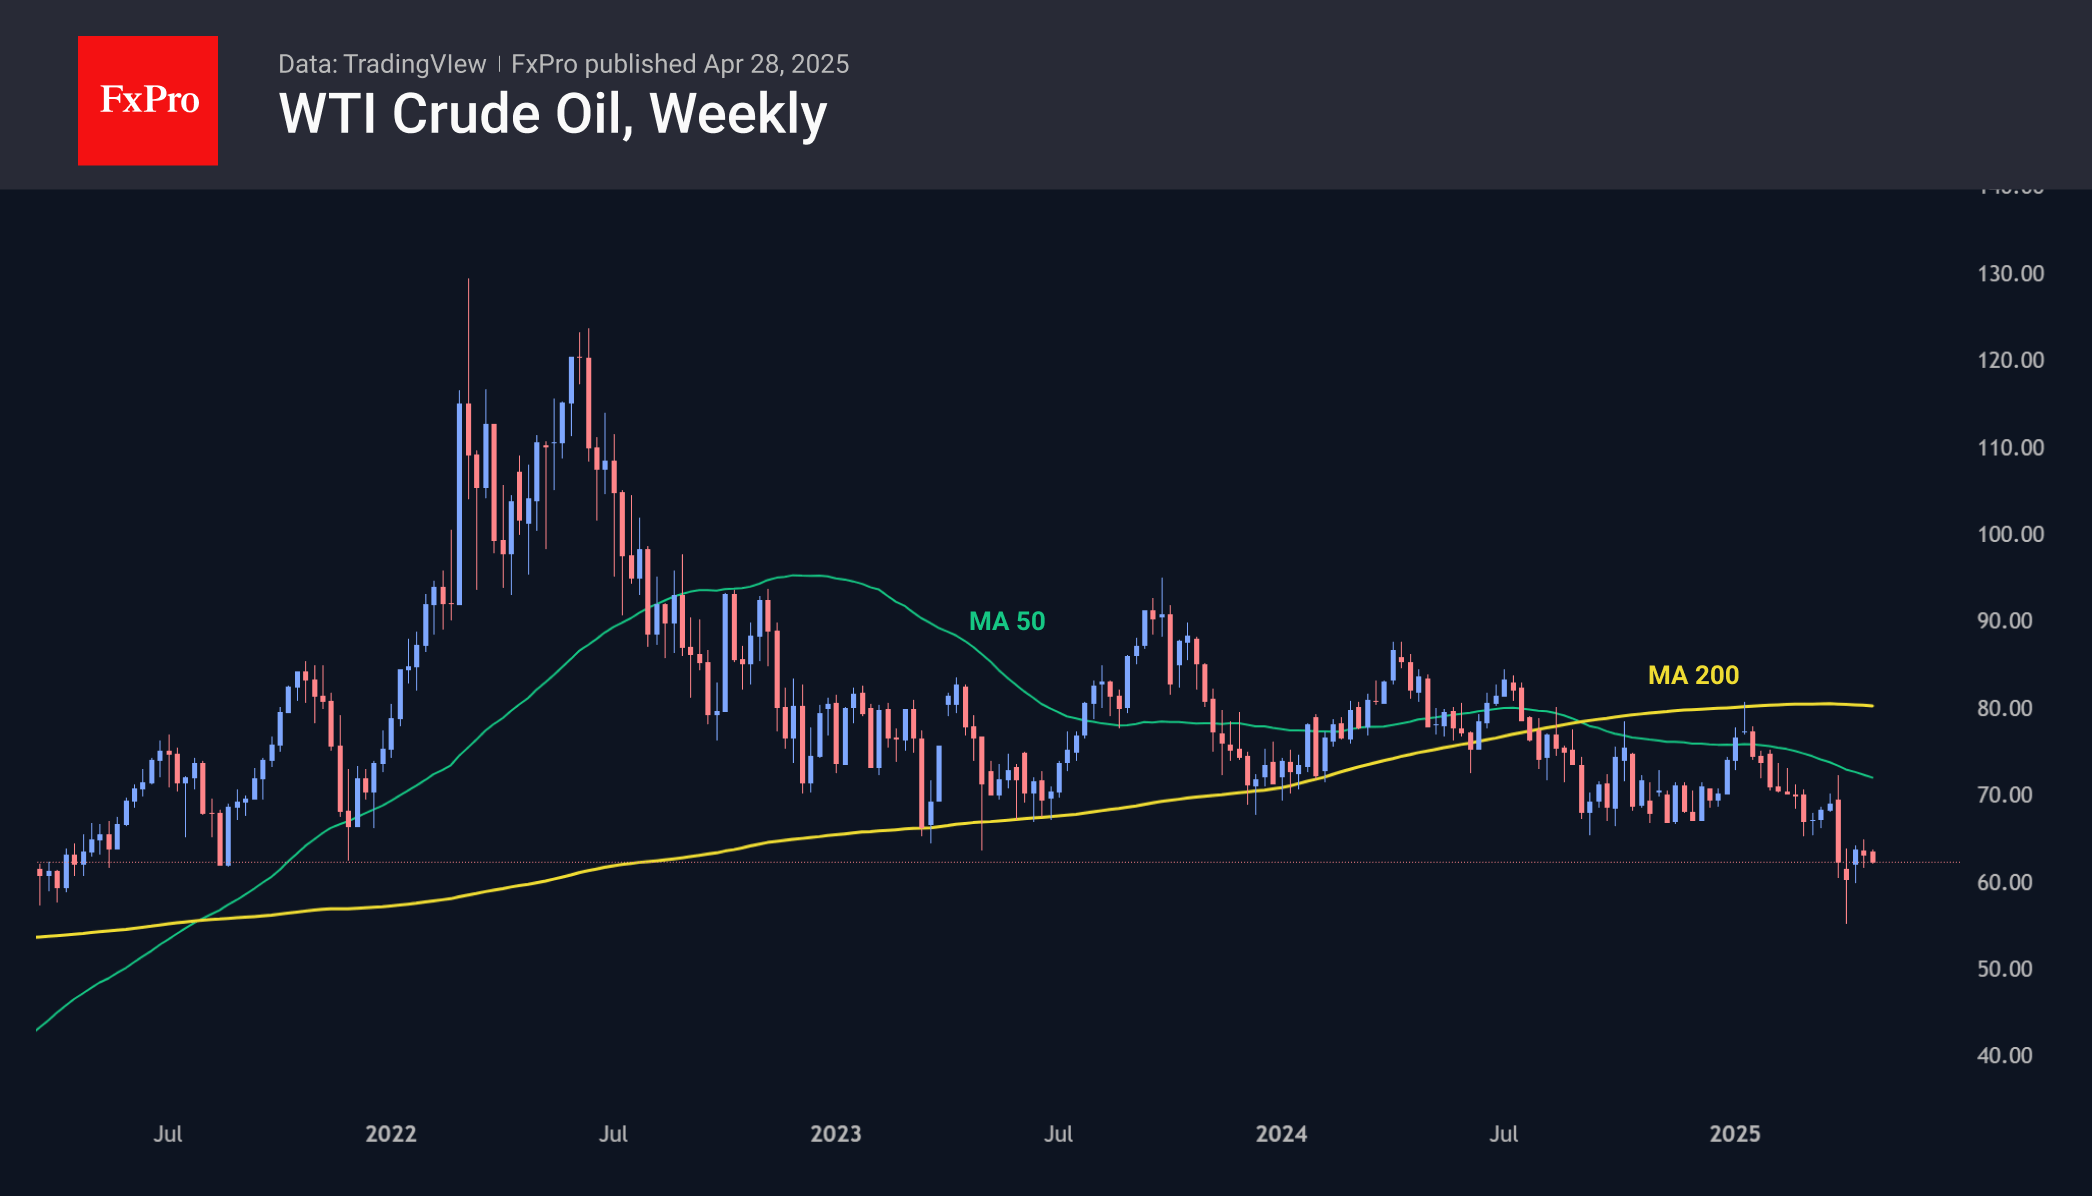
Oil Loses Recovery Momentum
The price of crude oil was down by about 3% so far this week, having encountered sellers’ resistance at $63 for WTI. A week earlier, the resistance was at $64/bbl.
In early April, oil collapsed due to fears of a global slowdown due to tariffs (less demand) and OPEC+’s intention to raise production (more supply). However, over the last three weeks, we have seen a smooth recovery trend, which has allowed about half of the initial decline to be recovered.
Last week’s US data was also on the sellers’ side. Commercial inventories have risen in 11 of the last 13 weeks, adding a cumulative 31.4 million barrels. Strategic stocks also rose over that time, albeit by a rather modest 2.7 million barrels.
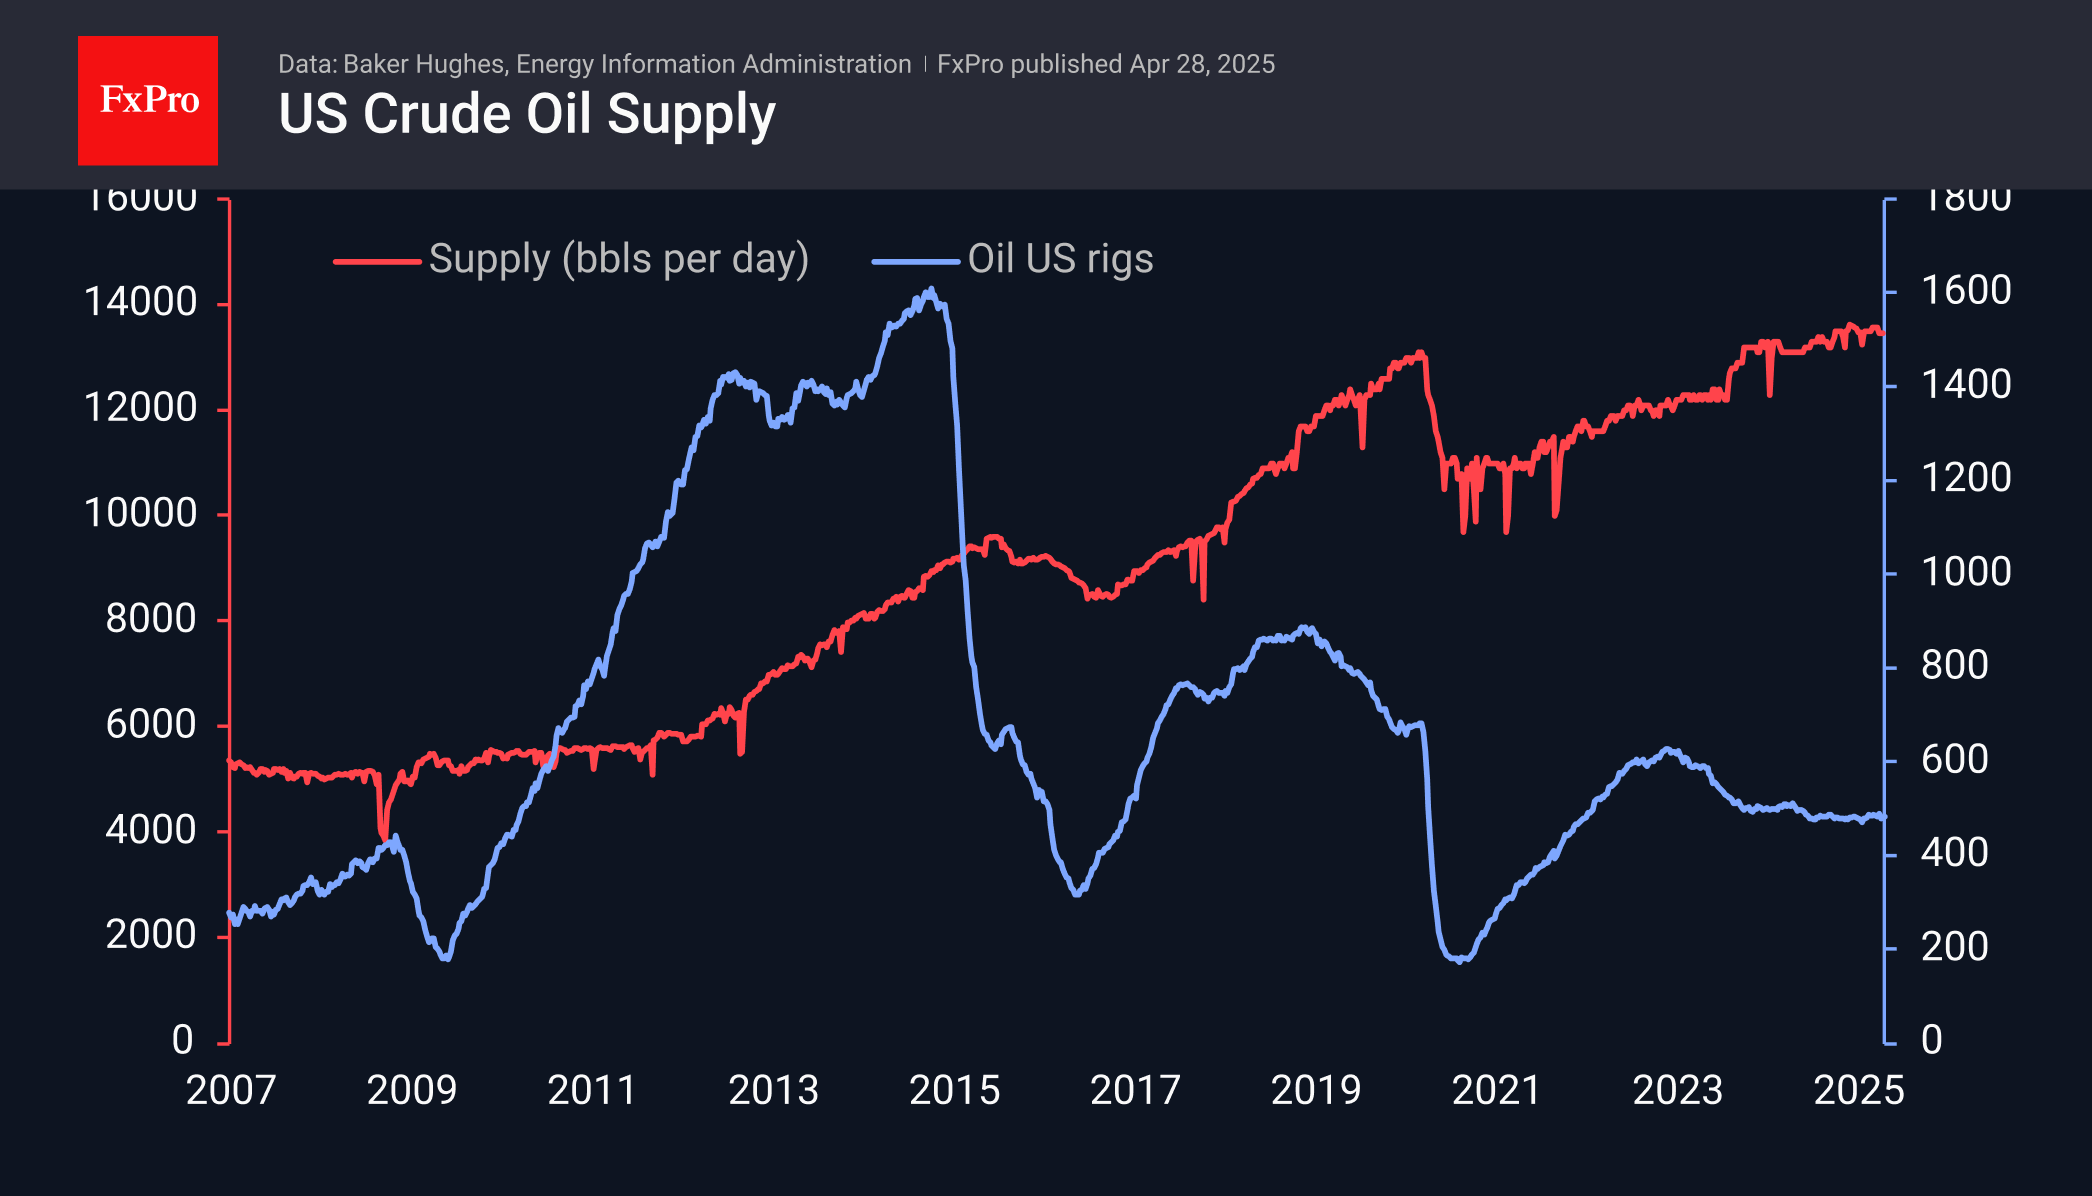
Interestingly, drilling activity has picked up, as the number of oil rigs has recovered to 483 from 480 a fortnight ago in the last couple of weeks.
That said, so far, production has stagnated at 13.5 million bpd. These swings are near record highs, but there has been no upward movement.
While the data changes are not overly dramatic, there are still more factors in favour of a lower oil price as the initial rebound fades.
In our view, the status quo is working against oil now, as the already imposed tariffs and the degree of uncertainty are eating away at confidence and therefore putting pressure on futures.
The longer-term technical picture shows the recovery momentum depleting on the approach to the former strong support line, which promises to make it an equally strong resistance. This picture suggests that without a breakthrough in tariff negotiations, there is a greater chance that oil will go down further, and the latest recovery will only whet the bears’ appetite.
US consumer confidence falls to 86, expectations slumps to 13-year low signaling rising recession risks
US Conference Board Consumer Confidence fell for the fifth consecutive month from 93.9 to 86.0, missing expectations of 87.1. Present Situation Index dipped slightly by -0.9 points to 113.5. But the real alarm came from Expectations Index, which plummeted by -12.5 points to 5.4, the lowest level since October 2011. It is far below the threshold of 80, which traditionally signals a recession is likely within the next year.
Stephanie Guichard, Senior Economist at The Conference Board, noted that the deterioration was driven almost entirely by weakening expectations around business conditions, employment prospects, and future income.
Of particular concern, the percentage of consumers expecting fewer jobs in the next six months surged to 32.1%, a level last seen during the depths of the Great Recession in 2009. For the first time in five years, expectations about future income prospects turned negative, suggesting that economic worries are now spilling over into personal financial concerns.
Sunset Market Commentary
Markets
At the least at the time of writing this report, markets again are engaged in some kind of short-term wait-and-see, consolidation trading. Of course, yesterday’s intraday trading in the US showed the fragility of this balance. For now, there is no high profile news/headlines from the trade tariffs area. In this context, the focus might turn a bit more to the upcoming economic data today and later this week. The Fed recently made any reassessment on a restart of the easing cycle dependent on a (substantial) deterioration in the labour market. In this respect, the JOLTS job vacancies and labour market subseries in the Conference Board consumer sentiment survey will be in focus. So are tomorrow’s ADP job report and Friday’s US payrolls. For now, US yields are trading little changed/rising marginally, holding within reach of the short-term lows but this still can turn out quite different later today. German yields also show very limited moves, easing 1-2 bps across the curve. European investors also still are pondering recent comments of at least some ECB members on the potential deflationary impact of tariffs on the EMU economy. Even so, the ECB March consumer survey (cf topic below) suggests that at least consumers see the current context as containing more rather than less inflationary risks. The immediate impact of the survey release on markets was limited. Even so, we have the impression European markets recently focused (more than) enough on growth risks. If upcoming inflation data don’t fit the disinflation narrative, maybe at some point there is room for some rebalancing of market themes also in EMU. European equities stall after recent rebound (Eurostoxx -0.4%). US indices open with a similar loss (S&P 500). After a rebound last week, oil is also again drifting lower (Brent $ 64.5 p/b).
The ‘stalemate’ in interest rate markets and equities also reigns the major USD cross rates. However, for now the dollar looks unable to take out any significant technical resistance levels. DXY gain trades near 99.1. EUR/USD rebounded to the 1.14 big figure. USD/JPY is changing hands near 142.3 compared to a ‘short-term top’ near 144 end last week. Any negative news for the upcoming data is a risk of causing return action to the recent USD lows. After staging a nice technical comeback of late, the ST sterling rebound also shows signs of petering out. EUR/GBP holds close to even marginally north of 0.85.
News & Views
In the ECB’s March consumer inflation survey, expectations for the annual price increase for the year ahead rose from 2.6% to 2.9%. The 3-year ahead gauge picked up 0.1 ppt to 2.5%. These highest readings since April and March 2024 respectively were recorded in a survey period that just missed out on the April 2 tariff announcement by US president Trump. The 5-year forward looking indicator, published for the first time, stabilized for a fourth month straight at 2.1%. European consumers expect their nominal income to grow by 1%, the same as in February, while spending growth is seen at 3.4% vs 3.5% in February and 3.6% in January. Expectations for economic growth and unemployment have been fluctuating within a narrow range over the previous months with the former coming in at -1.2% (unchanged) and the latter 10.4% (slightly lower from 10.5%). In terms of housing, consumers believe prices of their homes to rise by 3.1% over the next 12 months, a small uptick from February. Mortgage rates are thought to remain broadly the same (4.4%).
Belgian GDP was up 0.4% Q/Q in 2025Q1 with the year-on-year growth rate coming in at 1.1%. Economic activity accelerated from 2024Q4 (0.2%) thanks to the construction sector, where value added climbed 0.9%. Services sector activity increased by 0.4% while the industry stabilized. On the price front, inflation in April eased to 2.55% from 2.91% thanks to a 0.83% m/m drop. This in turn was the result of a sharp decline in energy prices: natural gas tanked by 5.9%, electricity fell by 4.6% and motor fuels by 1.4%. Dairy products & eggs (-2.8%) and city trips (-4.6%) also helped push the headline index lower. Offsetting this was a sharp uptick in plane prices (+11.1%) and hotel rooms (5.4%). Stripping the index for food and energy, core CPI quickened from 2.71% to 2.82% while services inflation accelerated too (3.96% from 3.88%). Inflation measured according the European rules (HICP) comes in at 3.1%.