Sample Category Title
EUR/USD Mid-Day Outlook
Daily Pivots: (S1) 1.1358; (P) 1.1391; (R1) 1.1454; More...
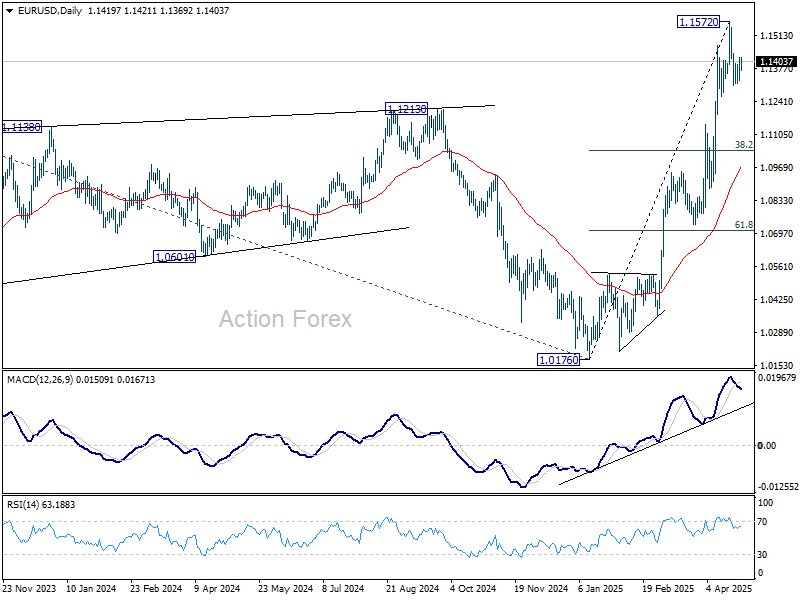
Intraday bias in EUR/USD stays neutral for the moment. On the downside, break of 1.1306 will extend the correction from 1.1572. But strong support should be seen from 38.2% retracement of 1.0176 to 1.1572 at 1.1039 to contain downside. On the upside, break of 1.1572 will resume larger up trend.
In the bigger picture, rise from 0.9534 long term bottom could be correcting the multi-decade downtrend or the start of a long term up trend. In either case, further rise should be seen to 100% projection of 0.9534 to 1.1274 from 1.0176 at 1.1916. This will now remain the favored case as long as 55 W EMA (now at 1.0792) holds.
GBP/USD Mid-Day Outlook
Daily Pivots: (S1) 1.3334; (P) 1.3389; (R1) 1.3499; More...
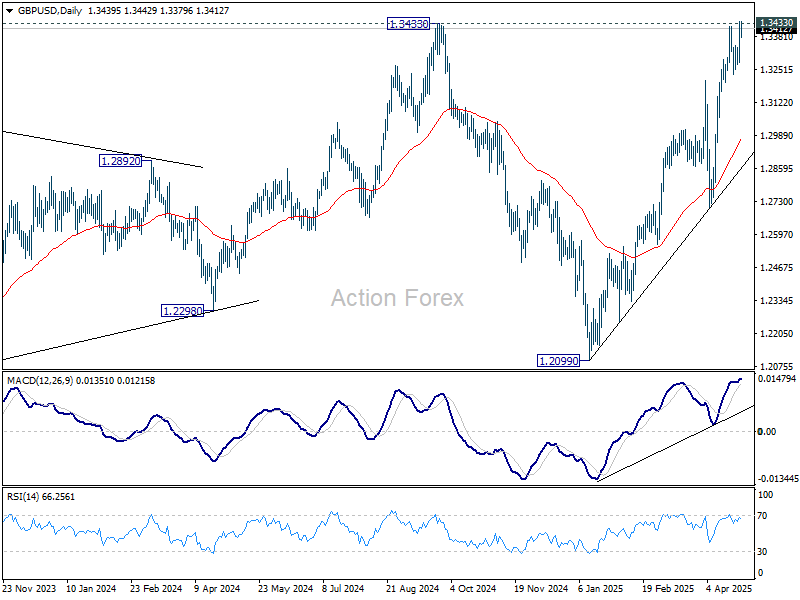
Intraday bias in GBP/USD remains on the upside for the moment. Firm break of 1.3433 key resistance will confirm larger up trend resumption. Next near term target is 61.8% projection of 1.2706 to 1.3422 from 1.3232 at 1.3674. However, break of 1.3232 support will indicate rejection from 1.3433, and bring deeper decline back to 55 D EMA (now at 1.2978) and possibly below.
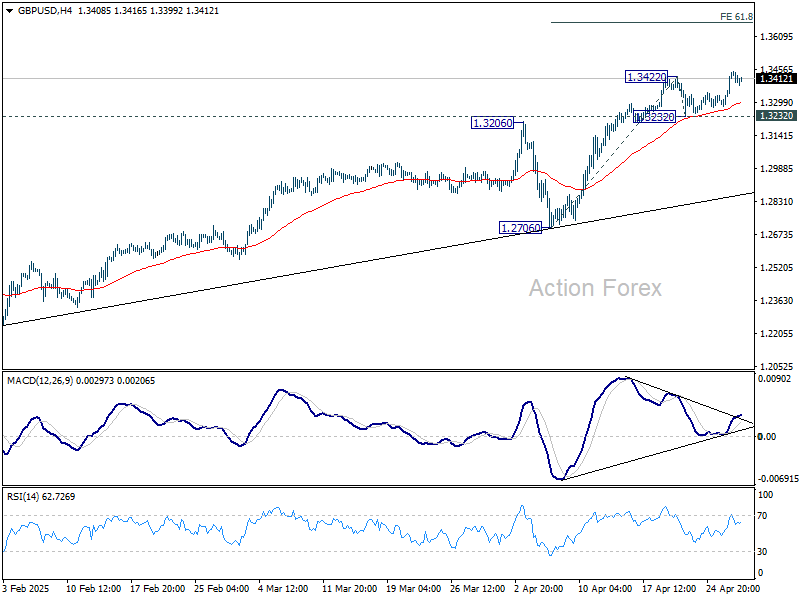
In the bigger picture, price actions from 1.3433 are seen as a corrective pattern to the up trend from 1.3051 (2022 low). Rise from 1.2099 could either be resuming the up trend, or the second leg of a consolidation pattern. Overall, GBP/USD should target 1.4248 key resistance (2021 high) on break of 1.3433 at a later stage.
USD/JPY Mid-Day Outlook
Daily Pivots: (S1) 141.37; (P) 142.64; (R1) 143.28; More...
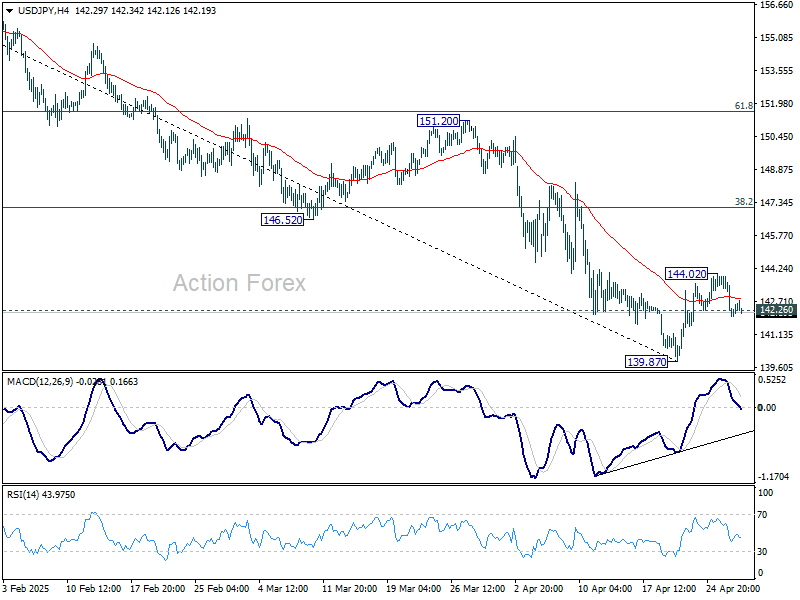
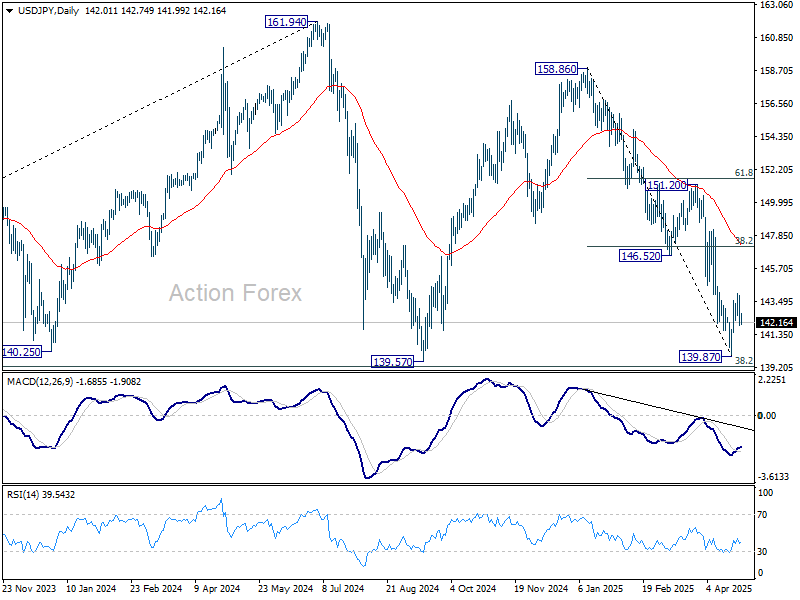
No change in USD/JPY's outlook and intraday bias stays neutral. On the upside, above 144.02 will resume the rebound from 139.87. But ear term outlook will stay bearish as long as 38.2% retracement of 158.86 to 139.87 at 147.12 holds. On the downside, firm break of 142.26 will argue that the recovery from 139.87 short term bottom has completed as a corrective move. Retest of 139.87 should then be seen next in this case.
In the bigger picture, price actions from 161.94 are seen as a corrective pattern to rise from 102.58 (2021 low), with fall from 158.86 as the third leg. Strong support should be seen from 38.2% retracement of 102.58 to 161.94 at 139.26 to bring rebound. However, sustained break of 139.26 would open up deeper medium term decline to 61.8% retracement at 125.25.
USD/CHF Mid-Day Outlook
Daily Pivots: (S1) 0.8159; (P) 0.8239; (R1) 0.8280; More….
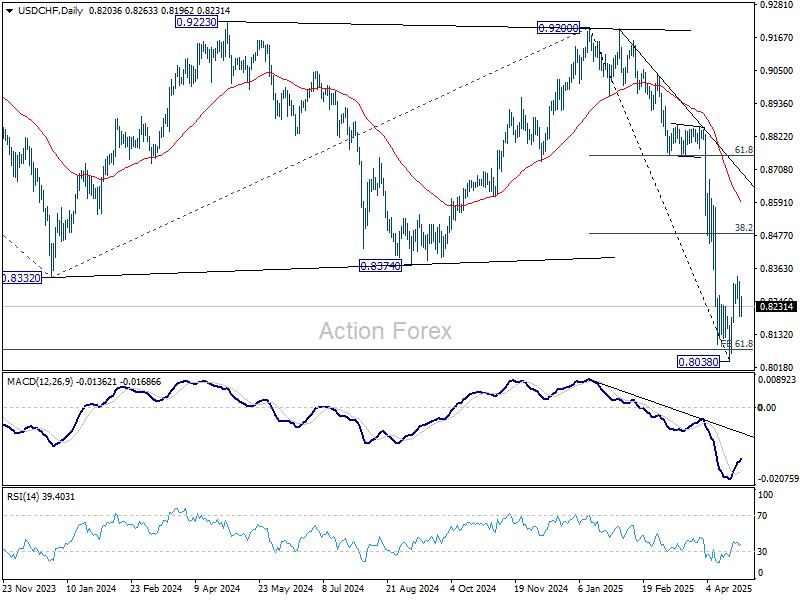
No change in USD/CHF's outlook and intraday bias remains neutral. On the upside, above 0.8333 will resume the rebound from 0.8038 short term bottom. But upside should be limited by 38.2% retracement of 0.9200 to 0.8038 at 0.8482. On the downside, below 0.8196 minor support will bring retest of 0.8038. Firm break there will resume larger down trend.
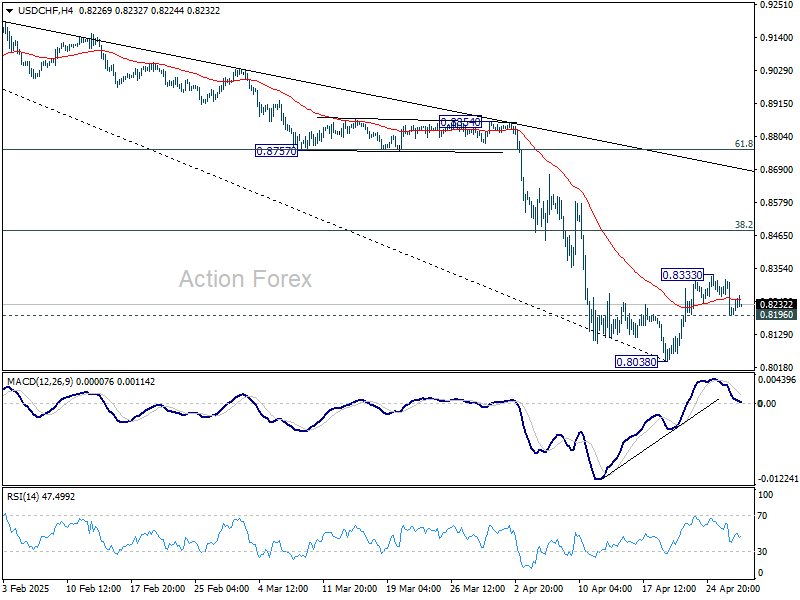
In the bigger picture, long term down trend from 1.0342 (2017 high) is still in progress and met 61.8% projection of 1.0146 (2022 high) to 0.8332 from 0.9200 at 0.8079 already. In any case, outlook will stay bearish as long as 55 W EMA (now at 0.8783) holds. Sustained break of 0.8079 will target 100% projection at 0.7382.
Aussie Inflation Set to Cement RBA May Cut; Month-End Calm Prevails
The forex markets are generally holding steady today, with all major pairs and crosses bounded within yesterday's range. While month-end lull is at play, caution is also dominating sentiment as traders prepare for a heavy barrage of economic data scheduled from Wednesday through Friday. Key reports include US GDP and non-farm payrolls, along with Eurozone GDP and CPI flash estimates.
Also, in the upcoming Asian session, Australia’s Q1 inflation report will be a major highlight. Focus will be on whether the closely watched trimmed mean CPI falls back within the RBA’s 2-3% target range for the first time since 2021. If realized, this would solidify expectations for a 25bps rate cut in May, a view that has become the base case for three of Australia’s big four banks.
Some speculation persists about the possibility of a larger 50bps cut by RBA, especially given mounting trade risks. But many analysts argue that such a move would risk sending an unnecessary panic signal to markets. Still, any deep downside surprise in tomorrow's inflation data could quickly shift those odds.
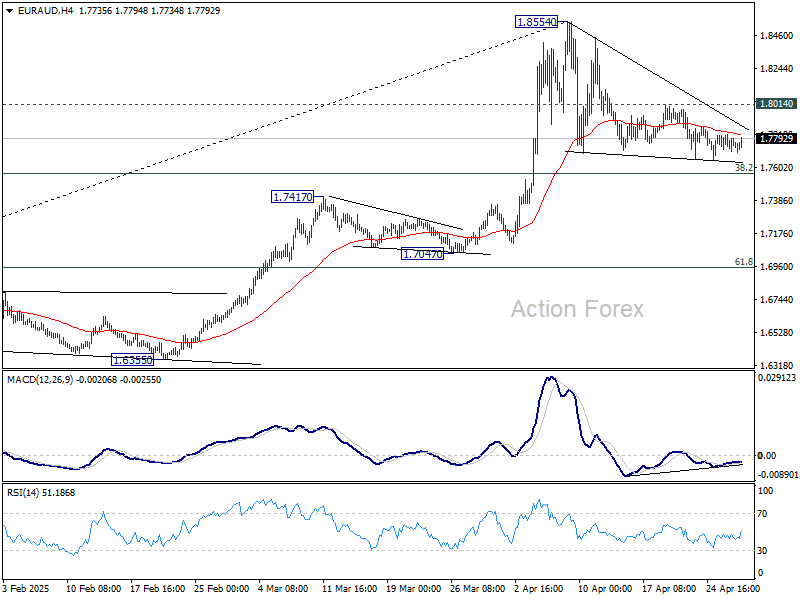
Technically, EUR/AUD's price actions from 1.8554 are seen as a triangle consolidation pattern. Break of 1.8014 resistance will argue that the pattern has completed, and larger rally from 1.5963 is ready to resume through 1.8554 high. However, firm break of 38.2% retracement of 1.5963 to 1.8854 at 1.7750 will dampen this view, and indicate that deeper correction is underway.
Overall for the week so far, Yen is staying as the strongest on, followed by Sterling, and then Swiss Franc. Kiwi is the worst, followed by Dollar, and then Loonie. Euro and Aussie are positioning in the middle.
In Europe, at the time of writing, FTSE is up 0.12%. DAX is up 0.56%. CAC is down -0.26%. UK 10-year yield is down -0.026 at 4.487. Germany 10-year yield is down -0.027 at 2.502. Earlier in Asia, Japan was on holiday. Hong Kong HSI rose 0.16%. China Shanghai SSE fell -0.05%. Singapore Strait Times fell -0.17%.
ECB consumer survey shows inflation expectations ticking higher
ECB’s Consumer Expectations Survey for March showed that consumers are raising their inflation views in a relatively measured manner rather than in a panic. Overall, the results present a slight inflationary concern on one side, but still subdued growth prospects on the other.
Median expectations for inflation over the next 12 months rose by 0.3% to 2.9%, the highest level since April 2024.
Looking further ahead, expectations for inflation three years out edged up by 0.1% to 2.5%, also hitting a one-year high.
Newly introduced five-year inflation expectations remained stable at 2.1%, suggesting longer-term expectations remain relatively anchored.
Uncertainty about the inflation outlook remained at its lowest level since January 2022.
On the broader economic front, the survey indicated that consumers’ income growth expectations stayed unchanged at a modest 1.0% over the next year, while expected nominal spending growth edged down to 3.4%.
Economic growth expectations remained weak, steady at -1.2% for the next 12 months.
ECB's Cipollone warns trade fragmentation could severely hit global and Eurozone growth
ECB Executive Board member Piero Cipollone warned today that the recent surge in trade policy uncertainty poses a material risk to Eurozone growth. In a speech, he highlighted internal ECB research suggesting that rising uncertainty could trim Eurozone business investment by -1.1% in the first year, while real GDP growth could fall by about -0.2% in 2025-26.
Financial market volatility, elevated due to the global trade tensions, could further drag on growth. ECB staff estimate that the observed increase in volatility alone could shave an additional -0.2% off Eurozone GDP in 2025.
Cipollone emphasized that over the medium term, tariffs will have an "unambiguously recessionary effect" across both economies imposing and receiving restrictions, and noted that the ability of exchange rates to "absorb tariff shocks" appears to have diminished.
ECB’s analysis of fragmentation scenarios paints an even bleaker picture. In a mild East-West decoupling, global output could drop by nearly -2%. In a severe decoupling where trade between blocs halts entirely, global output could plunge by up to -9%.
Trade-dependent economies would bear the heaviest losses, with the EU facing a GDP decline of between -2.4% and -9.5% depending on the severity. Notably, the US itself could suffer a near -11% contraction in the most extreme case if it "imposed additional trade restrictions against western and neutral economies".
While the growth impact of trade fragmentation is clear, the inflationary effects remain less certain. For the Eurozone, recessionary forces, stronger real interest rates, and Euro appreciation could generate a "disinflationary: trend in the near to medium term.
German Gfk consumer sentiment rises to -20.6, domestic political stability offsets trade concerns
Germany’s GfK Consumer Sentiment Index for May rose from -24.3 to -20.6 and outperforming expectations for a decline to -26.0.
In April, key underlying indicators also showed encouraging signs. Income expectations rose sharply for a second straight month, climbing 7.4 points to 4.3, their highest level since October 2024. Economic expectations increased modestly for a third consecutive month. Willingness to save fell, while willingness to buy improved slightly.
Rolf Bürkl, consumer expert at NIM, noted that US President Donald Trump’s aggressive tariff announcements in early April have "not yet had lasting impacts on consumer sentiment" in Germany.
Instead, German consumers appear more reassured by the domestic political backdrop, particularly the successful conclusion of coalition negotiations and the imminent formation of a new government. The easing of political uncertainty has helped mitigate potential negative effects from external trade tensions.
RBA’s Kent highlights surge in FX volatility, stresses importance of market standards
In a speech today, RBA Assistant Governor Christopher Kent noted that early April saw some of the most extreme movements outside of the global financial crisis. He highlighted that Australian Dollar fluctuated within a range of 4 US cents and at one point suffered a 4.5% daily decline against the greenback — an unusually large move.
Kent also pointed out that broader measures of FX volatility, such as those derived from options markets, spiked to levels last seen during the pandemic, with liquidity conditions deteriorating noticeably.
While market conditions have calmed somewhat in recent days, Kent emphasized that such episodes serve as a reminder of the crucial role played by the Foreign Exchange Global Code.
He stressed that in periods of heightened uncertainty, the Code’s standardized practices and commitment to transparency help maintain trust between participants and ensure smoother market functioning even amid significant economic shocks.
USD/CHF Mid-Day Outlook
Daily Pivots: (S1) 0.8159; (P) 0.8239; (R1) 0.8280; More….
No change in USD/CHF's outlook and intraday bias remains neutral. On the upside, above 0.8333 will resume the rebound from 0.8038 short term bottom. But upside should be limited by 38.2% retracement of 0.9200 to 0.8038 at 0.8482. On the downside, below 0.8196 minor support will bring retest of 0.8038. Firm break there will resume larger down trend.
In the bigger picture, long term down trend from 1.0342 (2017 high) is still in progress and met 61.8% projection of 1.0146 (2022 high) to 0.8332 from 0.9200 at 0.8079 already. In any case, outlook will stay bearish as long as 55 W EMA (now at 0.8783) holds. Sustained break of 0.8079 will target 100% projection at 0.7382.
Australian Dollar Hits New 2025 High, CPI Looms
The Australian dollar is lower on Tuesday. In the European session, AUD/USD is trading at 0.6398, down 0.49% on the day.
Australian CPI expected to fall
Australia's inflation rate has been dropping and we'll get a look at first-quarter CPI on Wednesday. Annualized, inflation is expected to ease to 2.3% from 2.4% in Q4.
The Q4 gain of 2.4% was the lowest reading since Q1 2021, driven by government subsidies for electricity and fuel, which dampened goods inflation.
The RBA's trimmed mean CPI, a key core inflation gauge, is expected to drop to 2.9%, down from 3.2% in Q4 which was the lowest rate in three years. Core CPI remains well above the central bank's target of 2% but another decline will make a stronger case for a rate cut. The Reserve Bank of Australia left the cash rate unchanged at 4.10% and meets again in May.
The RBA is satisfied that inflation is moving lower but remains concerned about the unclear economic outlook, as US President Trump has zig-zagged in his tariff policy. Australia is particularly concerned that the high tariffs rates on China will chill China's economy, leading to less demand for Australian exports.
US employment data eyed
In the US, the focus will be on employment data in the second half of the week. JOLTS Job Openings, which will be released later today, is expected to ease to 7.48 million from 7.56 million. This would mark a second consecutive deceleration and point to a weakening labor market.
All eyes are on Friday's nonfarm payrolls, which surprised on the upside last month with a gain of 228 thousand, blowing past the forecast of 140 thousand. The markets are braced for a weak nonfarm payrolls release of 135 thousand.
AUD/USD Technical
- AUD/USD is testing support at 0.6412. Below, there is support at 0.6389
- There is resistance at 0.6456 and 0.6479
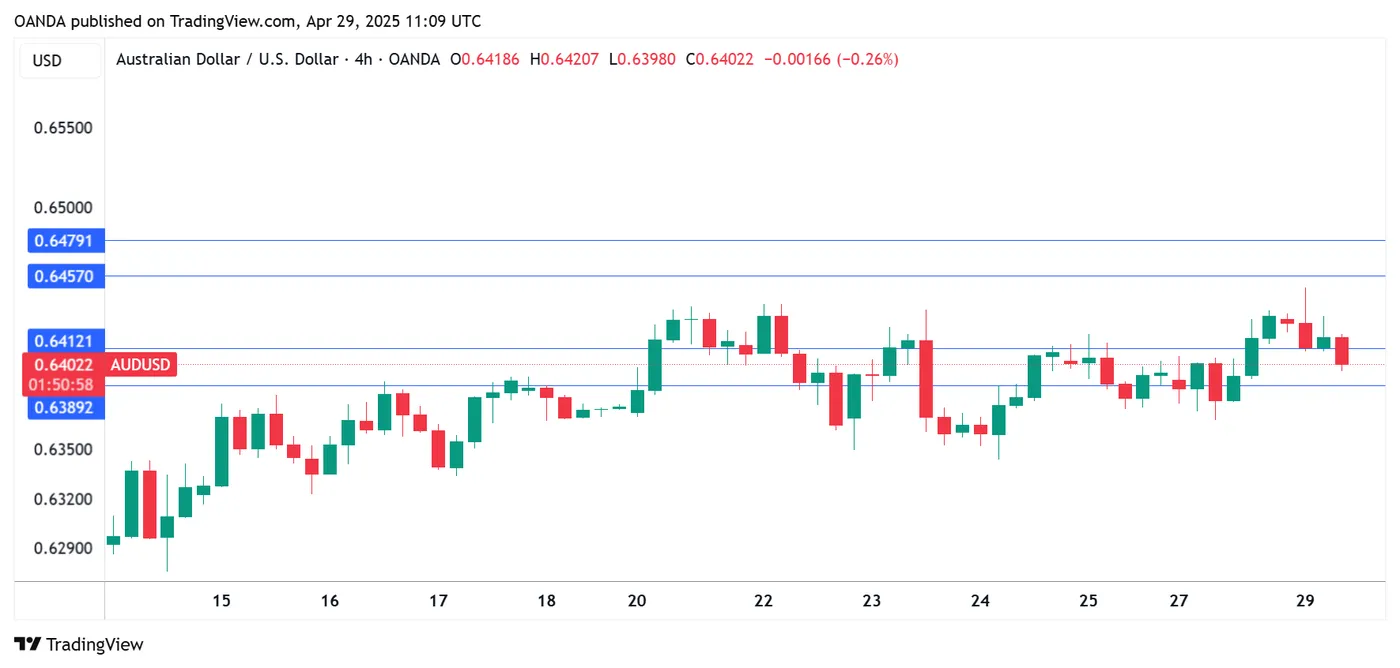
AUDUSD 1-Day Chart, April 29, 2025
Euro Lower, German Consumer Confidence Improves
The euro is slightly lower on Tuesday. In the European session, EUR/USD is trading at 1.1392, down 0.31% on the day.
German consumer climate hits 6-month high
German consumer confidence remains weak but showed some improvement in April, rising to -20.6. This was higher than the revised -24.3 in March and easily beat the market estimate of -26.0. This was the highest reading since Nov. 2024.
Consumers remain anxious about the negative impact of US tariffs but the domestic political situation has stabilized as a new government is taking shape.
Business confidence also improved in April, rising to 86.9 from 86.7 and beating expectations. This was the highest level since July 2024, as the business sector has reacted positively to the government's pledge to increase spending on infrastructure and defense. As with consumers, businesses expressed concern about the escalation in global trade tensions.
Markets eye German inflation, retail sales
Germany releases the April inflation on Wednesday. CPI is expected to remain at 0.4% m/m. Annualized, CPI is projected to ease to 2.1% from 2.3% in March and 2.6% in February. Germany's retail sales are expected to decline by 0.4% m/m in March, after a strong gain of 0.7% a month earlier. A drop in inflation and retail sales would support the case for the European Central Bank continuing lower interest rates.
In the US, the focus will be on employment data in the second half of the week. JOLTS Job Openings, which will be released later today, is expected to ease to 7.48 million from 7.56 million. This would mark a second consecutive deceleration and point to a weakening labor market.
All eyes are on Friday's nonfarm payrolls, which surprised on the upside last month with a gain of 228 thousand, blowing past the forecast of 140 thousand. The market estimate for April nonfarm payrolls stands at 135 thousand.
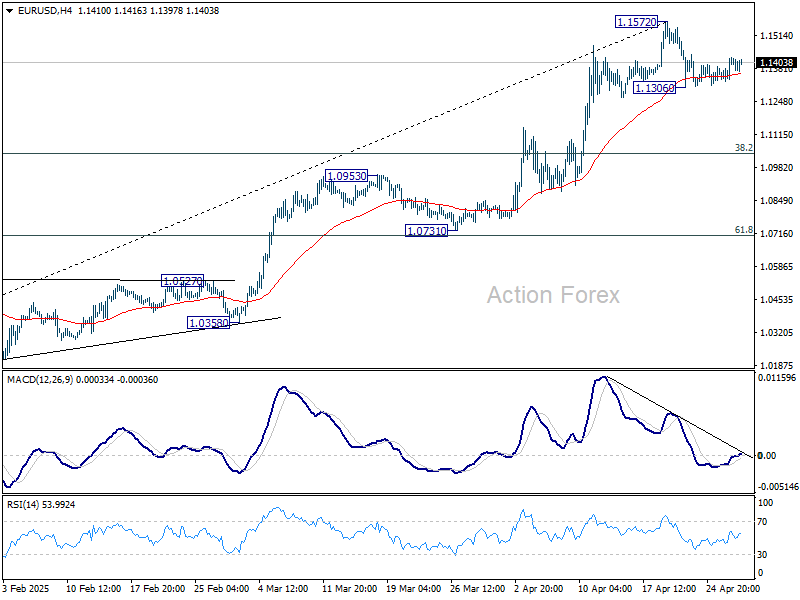
EUR/USD Technical
- EUR/USD is testing support at 1.1391. Below, there is support at 1.1358
- 1.1454 and 1.1487 are the next resistance lines
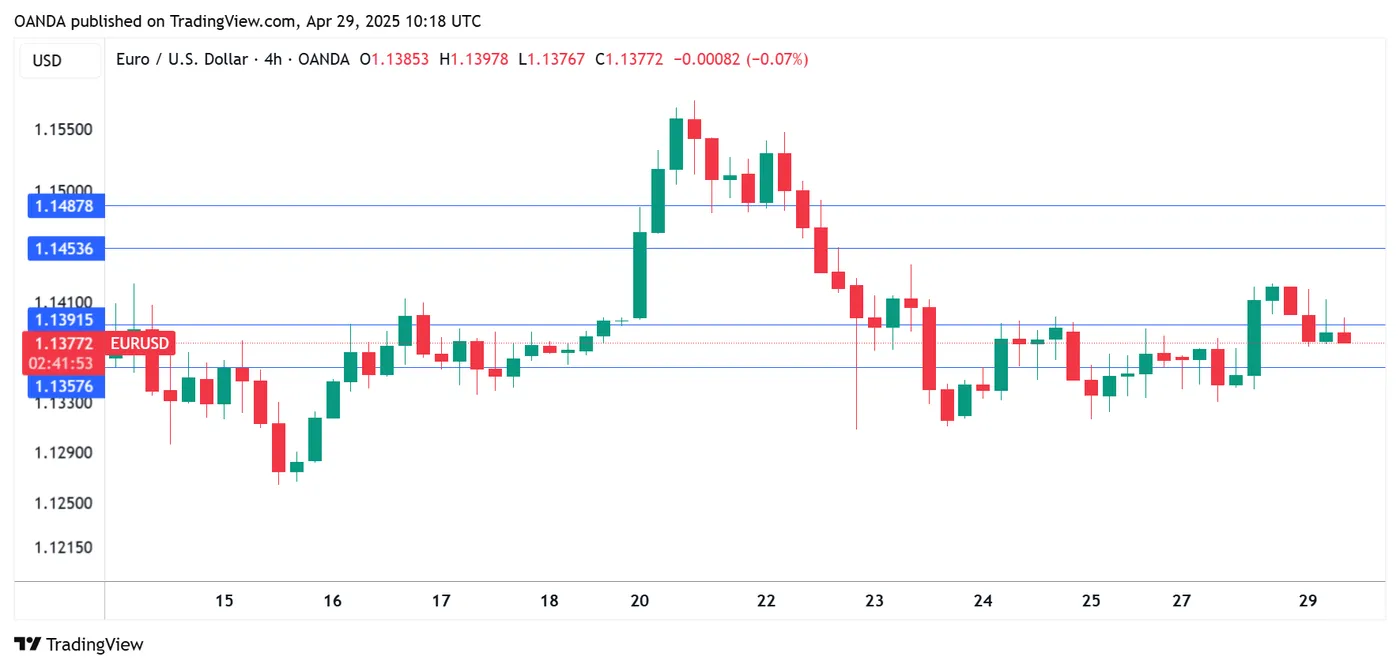
EURUSD 4-Hour Chart, April 29, 2025
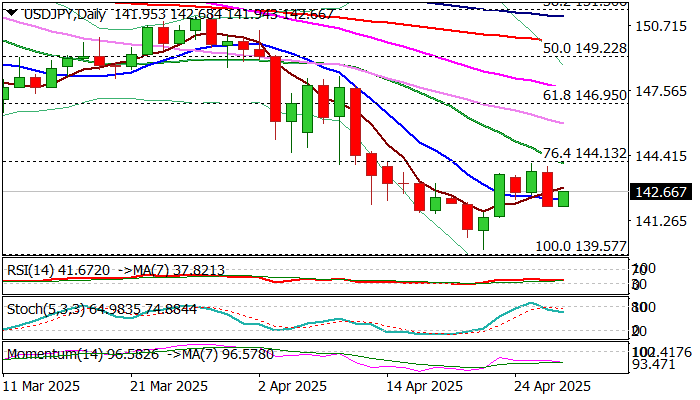
USD/JPY: Repeated Upside Rejections Keep Downside at Risk
USDJPY edged higher on Tuesday morning after 1.1% drop on Monday which added pressure on the pair, following repeated upside rejection under double Fibo barriers at 144.13/21 (broken 76.4% of 139.57/158.87 / 38.2% of 151.20/139.88).
Strong negative momentum on daily chart and most of MA’s in bearish setup suggest that the downside remains vulnerable and high possibility of recovery stall in play as long as Fibo barriers cap.
Persisting risk of US tariffs is likely to keep the yen supported which would also contribute to scenario of limited or healthy correction before larger downtrend resumes.
Bank of Japan will deliver its policy decision on Thursday, with wide expectations to keep interest rates unchanged, as policymakers want to assess all scenarios caused by impact of tariffs before deciding to modify its monetary policy.
Markets also focus on US April labor report that will be released this week (JOLTS, ADP, NFP) which is expected to provide fresh signals.
Res: 144.13; 144.21; 144.55; 145.00.
Sup: 141.94; 141.42; 140.47; 140.00.
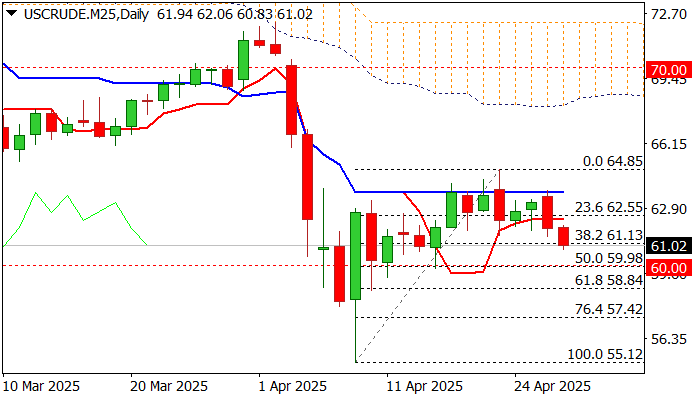
WTI Oil Price Falls Further as Sentiment Sours on Fading Trade Talks
WTI oil holds in red for the second consecutive and fell further on Tuesday as signals stalling US / China trade talks soured the sentiment.
Traders sold oil contracts on growing uncertainty after initial optimism was replaced by fears of escalation of trade war between two world’s biggest oil consumers that would further hurt global oil demand outlook.
The latest OPEC’s decision to further increase oil output from June adds to negative factors, keeping traders in defensive.
Fresh extension lower after recovery from four-year low at $55.12 (Apr 9 low) was repeatedly rejected at the zone of 50% retracement of $72.27/$55.12 bear-leg, broke below Fibo 38.2% retracement of $55.12/$64.85 recovery leg ($61.13).
This generated fresh bearish signal (validation of signal requires daily close below this level) and adds to bearish near-term outlook, as bears eye target at $60.00 (psychological / 50% retracement).
Firm break of $60 trigger to turn near-term picture negative and signal an end of corrective phase.
Conversely, failure to clearly break $61.13 pivot would ease immediate downside risk and keep in play hopes of a healthy correction, although such scenario would require more work at the upside to be validated (lift and close above daily Tenkan-sen at $62.35)
Daily studies are mixed as Tenkan/Kijun-sen are in bearish configuration, but momentum is positive and strengthening, and stochastic at the border of oversold territory.
Markets eye releases of weekly crude stocks reports (API today and EIA on Wednesday) for further signals.
Res: 61.13; 62.35; 62.55; 63.69.
Sup: 60.00; 59.42; 58.84; 57.42.
EUR/USD Turns Neutral as a Flood of Data Awaits
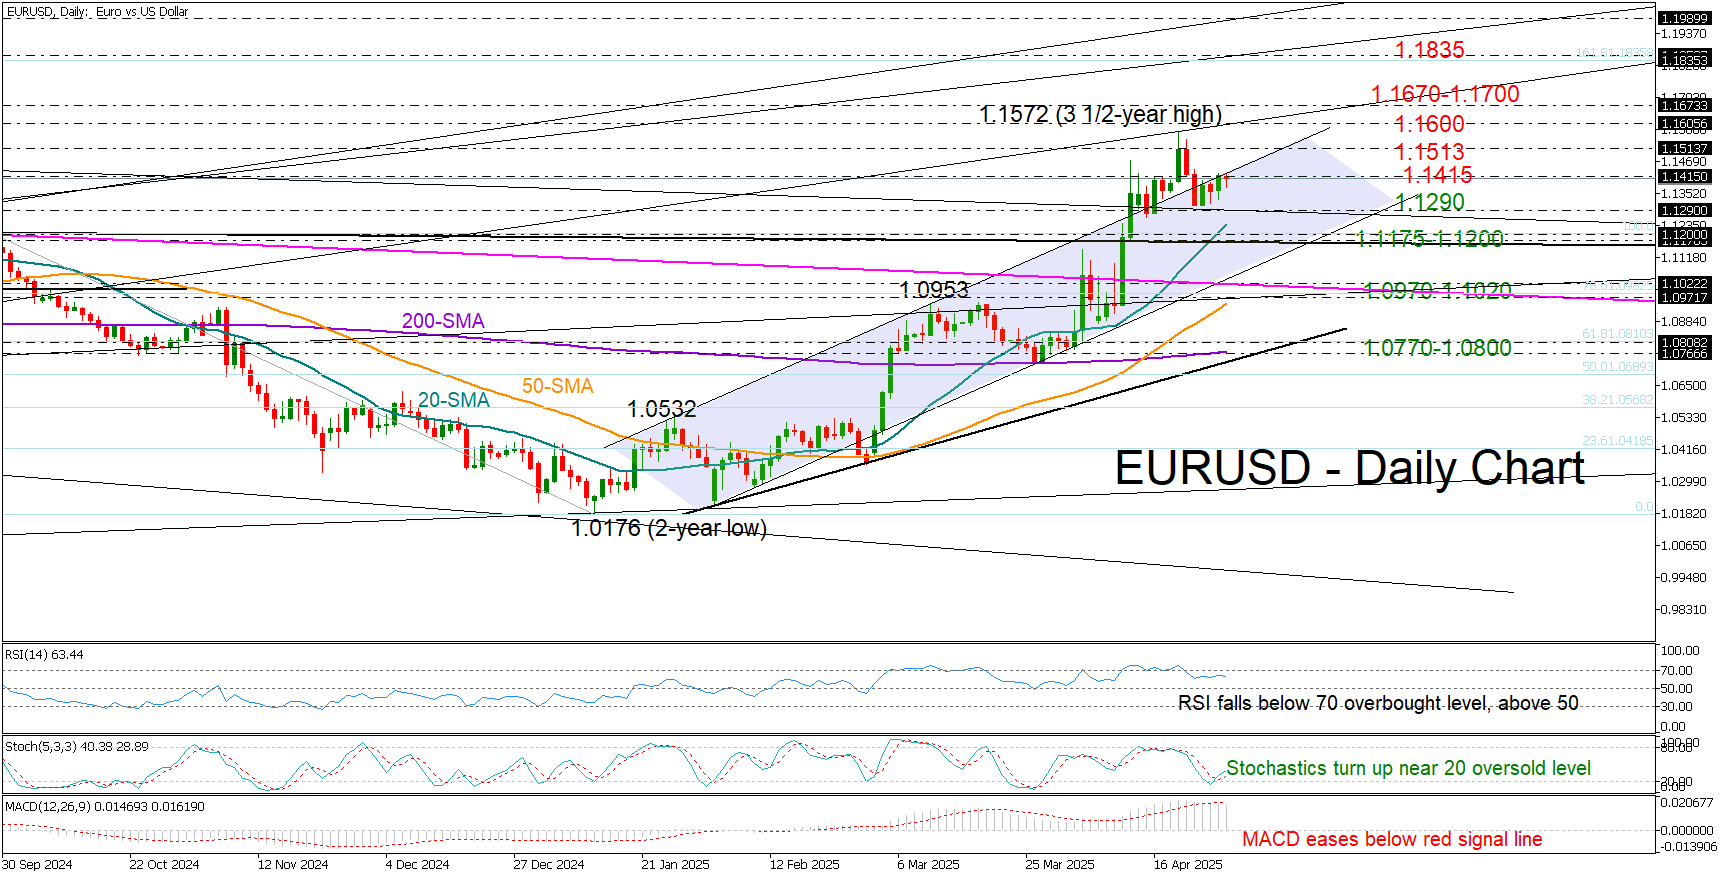
- EURUSD remains range-bound; struggles to close above 1.1415.
- Technical signals have weakened, but some optimism persists.
EURUSD opened the week with moderate gains, as bullish momentum lacked sufficient follow-through to push the price above the upper boundary of the bullish channel near 1.1415.
With the RSI turning lower after peaking in overbought territory and the MACD slipping below its red signal line, the outlook for a decisive rally in the coming sessions appears limited. Still, hopes for another bullish move have not entirely faded, as the stochastic oscillator has just posted a positive crossover near its 20-level oversold area.
A slew of US data, including nonfarm payrolls, along with Eurozone CPI inflation figures, are scheduled for release and could influence market direction.
Sellers may remain on the sidelines as long as the pair trades above the 1.1290–1.1300 support zone. The 20-day simple moving average (SMA) is also approaching this area, while slightly lower, the 1.1175–1.1200 territory may help absorb downside pressure, potentially delaying a drop into the 1.0970–1.1020 region. A continuation below the 50-day SMA could intensify selling, possibly leading to further declines toward the 200-day SMA and a tentative support trendline, both located around the 1.0765–1.0800 area.
On the upside, if the pair breaks above 1.1415, resistance may emerge near the 1.1513 barrier. A successful move beyond this level could lead to a critical test of the former support-turned-resistance line from June 2024, situated around 1.1600. An advance through the 1.1670–1.1700 resistance zone could unlock additional upside momentum toward the next hurdle at 1.1835.
In summary, EURUSD is maintaining a neutral stance in the very short term. A decisive move above 1.1415 or below 1.1290 is needed to clarify the next directional bias.