Sample Category Title
RBA’s Kent highlights surge in FX volatility, stresses importance of market standards
In a speech today, RBA Assistant Governor Christopher Kent noted that early April saw some of the most extreme movements outside of the global financial crisis. He highlighted that Australian Dollar fluctuated within a range of 4 US cents and at one point suffered a 4.5% daily decline against the greenback — an unusually large move.
Kent also pointed out that broader measures of FX volatility, such as those derived from options markets, spiked to levels last seen during the pandemic, with liquidity conditions deteriorating noticeably.
While market conditions have calmed somewhat in recent days, Kent emphasized that such episodes serve as a reminder of the crucial role played by the Foreign Exchange Global Code.
He stressed that in periods of heightened uncertainty, the Code’s standardized practices and commitment to transparency help maintain trust between participants and ensure smoother market functioning even amid significant economic shocks.
GBP/USD Gains Momentum, Bulls Aims For Fresh Highs
Key Highlights
- GBP/USD started a fresh increase above the 1.3350 resistance.
- A connecting bullish trend line is forming with support at 1.3320 on the 4-hour chart.
- EUR/USD is consolidating gains above the 1.1350 level.
- Bitcoin could soon aim for a fresh move above the $95,000 resistance.
GBP/USD Technical Analysis
The British Pound remained stable above 1.3250 against the US Dollar. GBP/USD started a fresh increase above 1.3320 and 1.3330 to move into a positive zone.
Looking at the 4-hour chart, the pair settled well above the 1.3320 level, the 100 simple moving average (red, 4-hour), and the 200 simple moving average (green, 4-hour). The bulls even pumped the pair above the 1.3400 resistance zone.
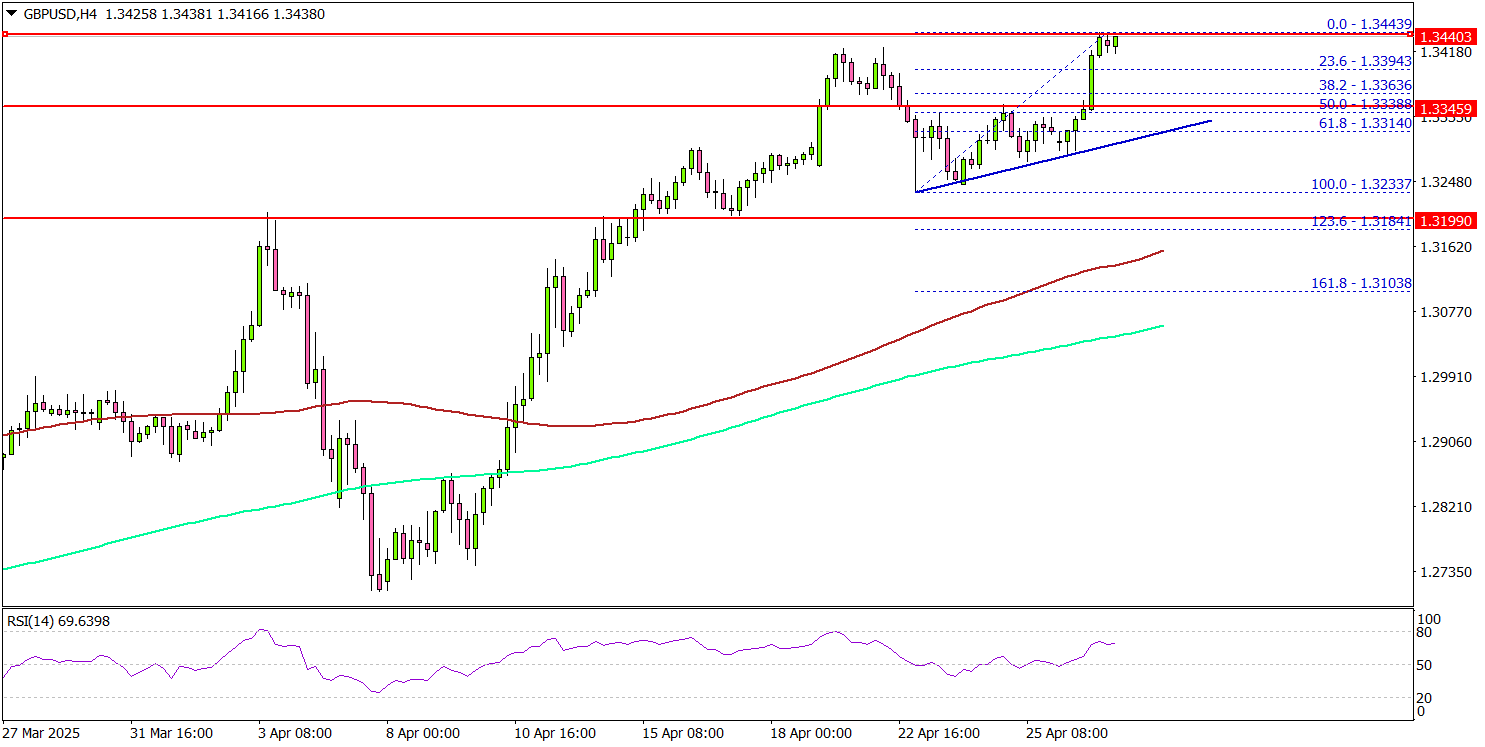
The pair is now consolidating near 1.3440. It seems like the bulls could soon aim for a move above the 1.3450 zone. If there is a fresh increase, the pair could face resistance near the 1.3500 level.
The next major resistance is near the 1.3550 zone. A close above the 1.3550 level could set the tone for another increase. In the stated case, the pair could even clear the 1.3620 resistance.
On the downside, immediate support sits near the 1.3400 level. The next key support sits near the 1.3350 level. Any more losses could send the pair toward the 1.3330 level. There is also a connecting bullish trend line forming with support at 1.3320 on the same chart.
Looking at Bitcoin, the price remains in a positive zone and might soon aim for a move above the $96,500 resistance zone.
Upcoming Economic Events:
US Housing Price Index for Feb 2025 (MoM) - Forecast +0.3%, versus +0.2% previous.
S&P/Case-Shiller Home Price Indices for Feb 2025 (YoY) - Forecast +4.8%, versus +4.7% previous.
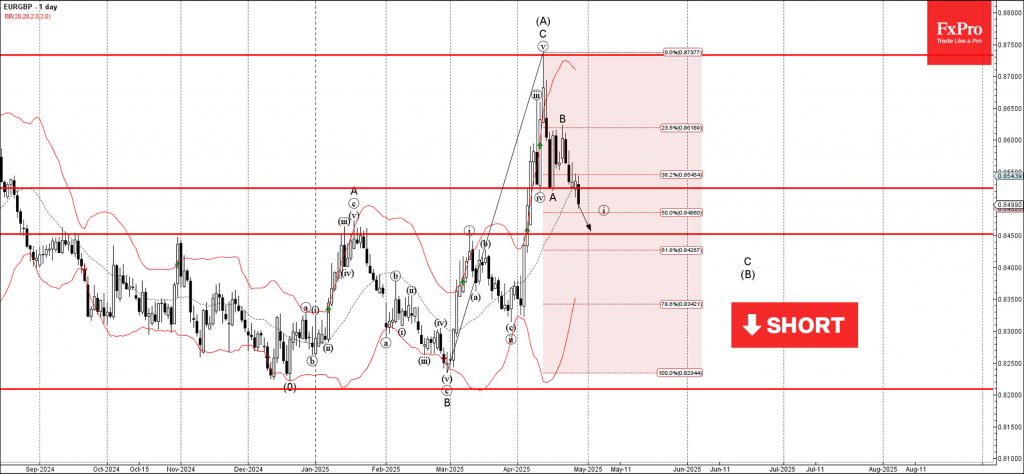
EURGBP Wave Analysis
EURGBP: ⬇️ Sell
- EURGBP broke support area
- Likely to fall to support level 0.8450
EURGBP currency pair recently broke the support area between the key support level 0.8525 (which stopped the previous waves iv and A) and the 38.2% Fibonacci correction of the upward impulse from February.
The breakout of the support level 0.8525 accelerated the active impulse wave i, which belongs to the C-wave of the ABC correction B from the start of April.
Given the bearish euro sentiment seen today, EURGBP currency can be expected to fall toward the next support level 0.8450.
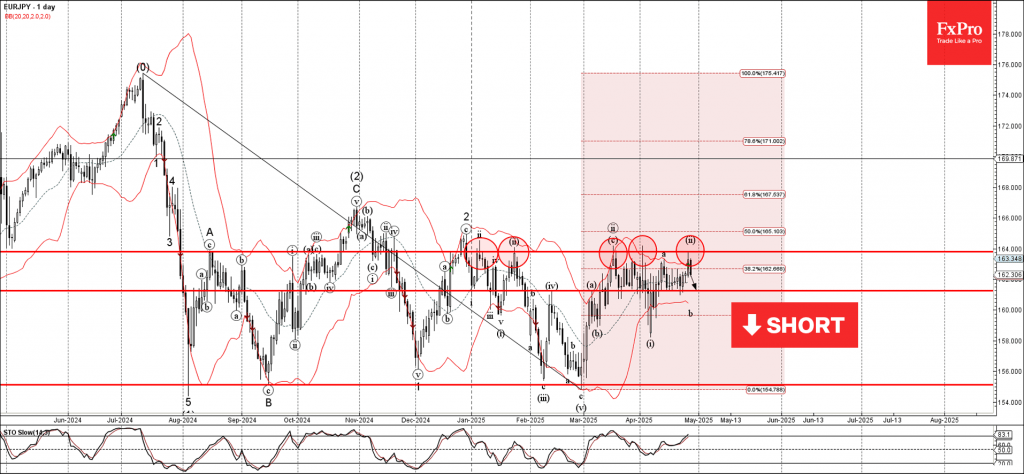
EURJPY Wave Analysis
EURJPY: ⬇️ Sell
- EURJPY reversed from resistance area
- Likely to fall to support level 161.25
EURJPY currency pair recently reversed down from the resistance area between the resistance level 164.00 (which has been reversing the price from January), upper daily Bollinger Band and the 50% Fibonacci correction of the downward impulse from July.
The downward reversal from this resistance area stopped the previous short-term correction ii.
Given the clear daily downtrend and the overbought daily Stochastic, EURJPY currency can be expected to fall toward the next support level 161.25.
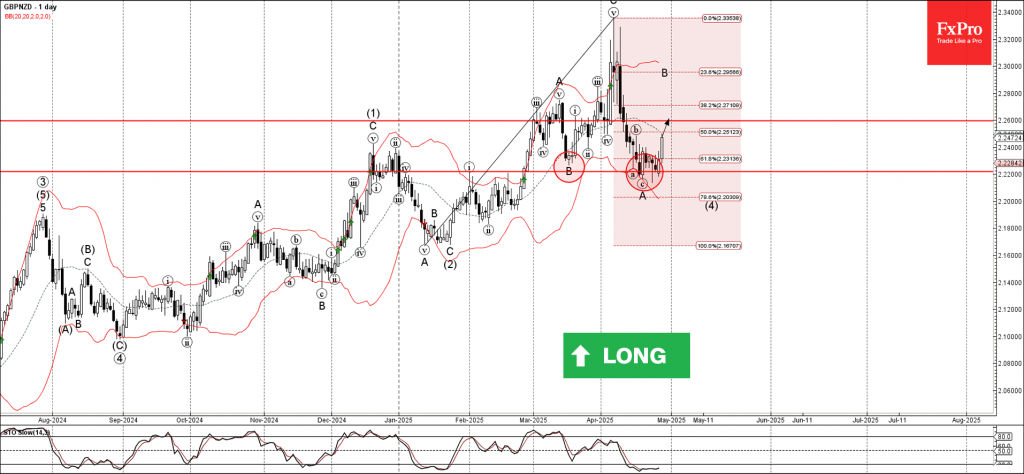
GBPNZD Wave Analysis
GBPNZD: ⬆️ Buy
- GBPNZD reversed from the support area
- Likely to rise to resistance level 2.2600
GBPNZD currency pair recently reversed from the support area between the support level 2.2220, lower daily Bollinger Band and the 61.8% Fibonacci correction of the upward impulse from January.
The upward reversal from this support area stopped the previous short-term correction A – which belongs to wave (4) from the start of April.
Given the clear daily uptrend and the oversold daily Stochastic, GBPNZD currency pair can be expected to rise toward the next resistance level 2.2600.
US Indices Turn Green as Markets Await Barrage of Data, Trade Deal Updates
US stock futures dipped on Monday as investors prepared for a busy week of important economic reports and earnings from major Wall Street companies, while keeping an eye on updates about the Trump administration's trade policies.
The US open has led to a bounce for US indices as markets digest comments from Treasury Secretary Scott Bessent.
U.S. Treasury Secretary Bessent shared that he met with his Chinese counterpart in Washington last week and believes China will find the current tariff levels unsustainable. He is optimistic about reaching a tariff agreement with China. Meanwhile, the U.S. Agriculture Secretary said daily talks with China about tariffs are ongoing.
Chinese officials however stand by the rhetoric that no discussions have taken place. This uncertainty is being reflected by Global markets at the start of the week.
However, China has reportedly removed tariffs on some U.S. products, focusing on areas where alternatives are limited. Meanwhile, Shein has raised prices on certain items in the U.S. by up to 377% ahead of tariff hikes.
A choppy session for the Dollar, the euro is slightly weaker due to hints from the ECB that a rate cut in June is likely. EUR/USD is trading within the 1.1330-1.1380 range.
This comes as ECB policymakers this morning struck a dovish tone. ECB policymakers Simkus and Kazaks both tout rate cuts as economic uncertainty grows.
GBP is slightly firmer in a quiet session thus far to start the week.
Gold is weaker and underperforming compared to other metals as the sell-off from its record highs continues.
For a full update on the price of Oil please read Brent Crude analysis: Trade talks, OPEC+, and technical levels
Economic data releases
For now the US calendar is quiet today with the main event being US Dallas Fed Manufacturing Business Index while President Trump is scheduled to meet with the house speaker later in the day.
On the earnings front we have Domino's Pizza, Roper, NXP Semiconductors.
The rest of the week is a busy one with US jobs data, BoJ rate decision and of course further developments on the tariff front.
For a full breakdown on the week ahead, please read Markets weekly outlook - Data dump ahead as tariff concerns linger
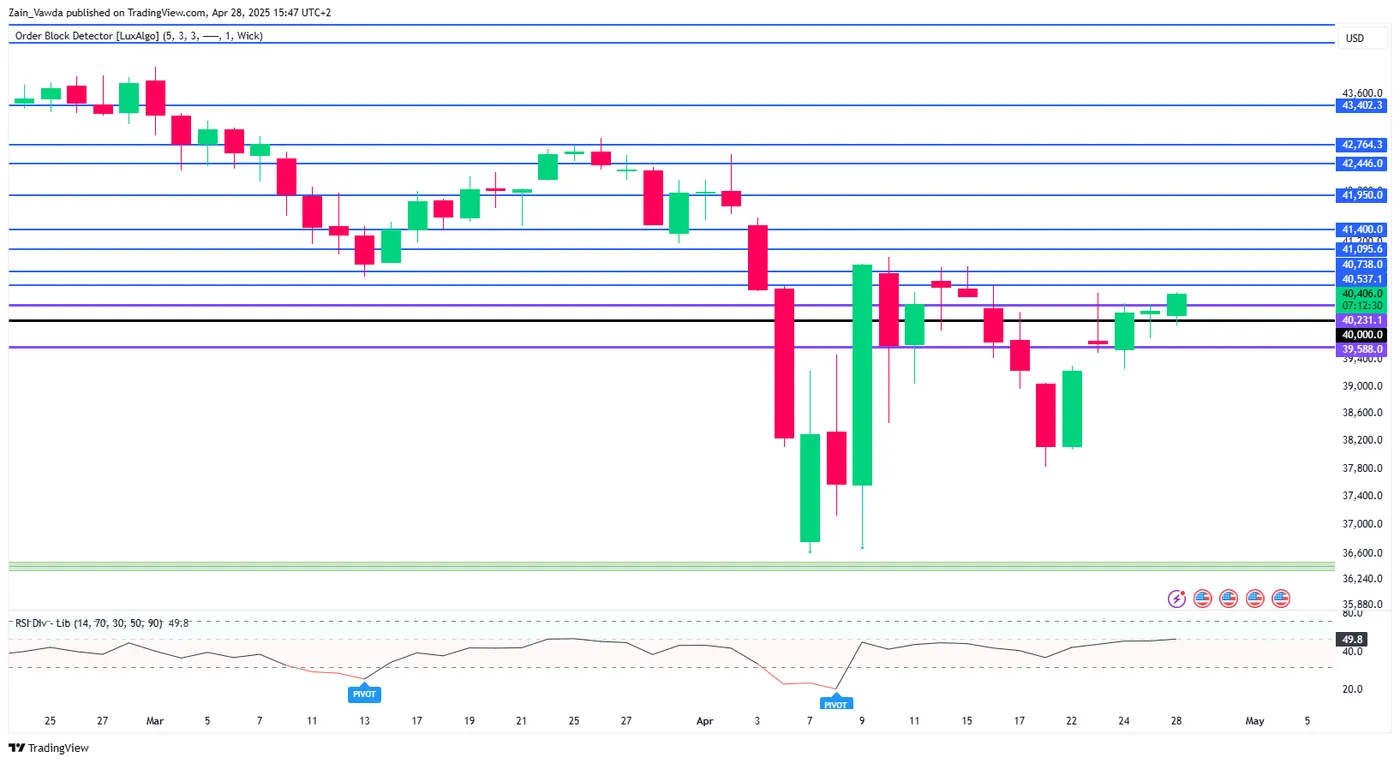
Chart of the day - Dow Jones Index (DJIA)
From a technical standpoint, the Dow Jones has shrugged off losses to turn green for the day, trading around 0.63% up at the time of writing.
The overall mood improvement in financial markets has played its role well thus far as more and more information continues to trickle through.
Immediate resistance rests at 40537 and 40738 with a break above these two levels opening up a retest of 41095.
Immediate support which was tested earlier in the day rests at the psychological 40000 handle before the 39588 handle and 39232 handles come into focus.
Dow Jones Daily Chart, April 23, 2025
Sunset Market Commentary
Markets
We saw the first signs of market calm returning to a certain extent in the wake of Liberation Day by end last week. The new one kicks off in a similarly good spirit. Markets are slowly coming to terms with a world where uncertainty will remain huge and are figuring their way through by trial and error. It’s a delicate balance that could be overthrown quickly by new shocking announcements. But barring these, we could see markets moving into some sideways consolidation ahead of important eco data later this week, high-profile earnings from the likes of Caterpillar, Meta Platforms, Microsoft, Apple and Amazon and potentially the first US trade deal (India?). For today though, the empty eco calendar and relative silence on the trade front offered core bond yields a chance to recoup some of the losses. Reports of a 30-day ceasefire on Ukraine’s initiative briefly added to the recovery. The German bottoming out process already began on Friday and gains traction today with yields adding between 1.7 and 5.4 bps in a bear steepener move. Swap yields rise 1.2-5.2 bps, easing the immediate downside threat for the likes of the 10-yr tenor to lose support around 2.43% (50% pullback on the Dec-March rise). ECB speech was limited to France’s Villeroy who saw no extra inflation coming from tariffs in either 2025 or 2026. He doesn’t expect a recession in France or Europe but believes there’s still margin for gradual rate cuts. US rates rise up to 4.5 bps at the long end of the curve in a similar shift of the curve. European stock markets eke out another 1% gain (give or take). Wall Street opens a tad higher. The S&P 500 is eager to confirm last week’s topside break above 5500.
Moves in foreign exchange markets stay limited. The US dollar trades mixed, keeping the trade-weighted index at unchanged levels south of 100. EUR/USD eases slightly towards the 1.135 area. Sterling is among the better performers today, gaining against virtually every G10 peer. EUR/GBP is testing the 0.85 zone, down from an open around 0.855. The UK’s open economy makes it particularly vulnerable for a global trade shock, explaining some of the relief rally now the trade tariff dust has settled a bit.
News & Views
The Belgian debt agency conducted its regular monthly OLO auction today. It wasn’t influenced by Friday’s decision by rating agency S&P to change the outlook on the AA rating from stable to negative because of implementation risks regarding reducing the budget deficit to below 3% of GDP by 2030 and downside growth risks, both direct and second-round of the global trade war. The BDA raised €3.22bn, the upper end of the targeted €2.8-3.2bn range by tapping OLO 100 (€0.97bn 2.85% Oct2034), OLO 103 (€1.14bn 3.1% Jun2035) and OLO 96 (€1.11bn 2.75% Apr2039). The auction bid cover was solid at 1.91. After today’s debt sale, the Belgian debt agency raised slightly over €20bn or 48% of this year’s €42bn OLO funding need.
The Confederation of British Industry’s Distributive Trades Survey showed retail sales falling for the seventh month in a row (on an annual basis) with a faster decline expected in May. Sales for the time of year were already judged to be "poor". Especially wholesale annual sales volumes declined in April at one of the quickest rates since September 2020. Online retail sales volumes were broadly flat. Firms remain pessimistic about the outlook due to the impact of Autumn Budget measures, persistently weak consumer sentiment, and global economic uncertainty.
ECB officials highlight intensifying risks, signal openness to more rate cuts
ECB Vice President Luis de Guindos told the European Parliament today that while the Eurozone economy likely managed modest growth in Q1, risks to the outlook have intensified.
He pointed to exceptional uncertainty stemming from new trade barriers, financial market tensions, and geopolitical instability, all of which could weigh on business investment and consumer spending in the months ahead.
"In this environment, consumers may become cautious about the future and hold back spending," de Guindos added.
Separately, Finnish ECB Governing Council member Olli Rehn also flagged the growing headwinds, suggesting the central bank may need to cut interest rates below neutral levels and maintain maximum flexibility.
Rehn emphasized that underlying inflation pressures are easing and that the escalation of US trade tariffs is largely contributing to increased downside risks for Eurozone inflation.
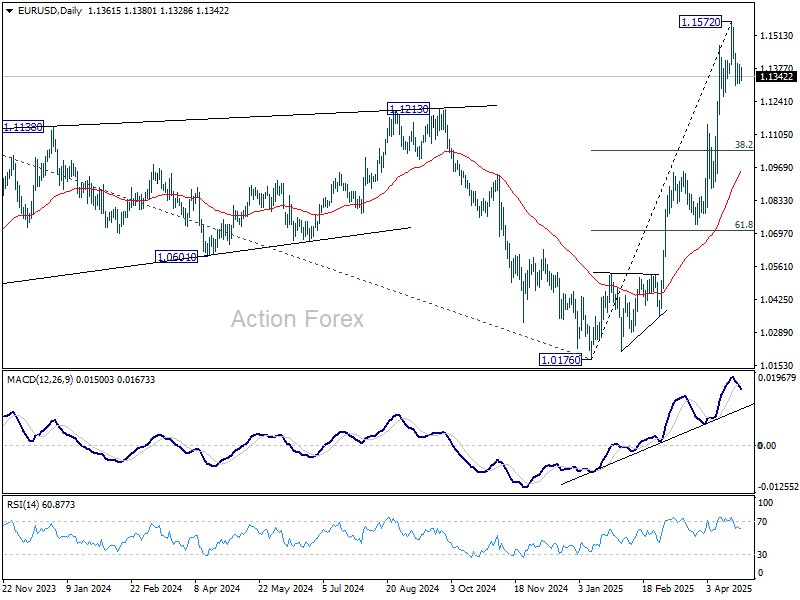
EUR/USD Mid-Day Outlook
Daily Pivots: (S1) 1.1322; (P) 1.1358; (R1) 1.1401; More...
Intraday bias in EUR/USD stays mildly on the downside at this point. Correction from 1.1572 short term top could still extend lower. Nevertheless, strong support should be seen from 38.2% retracement of 1.0176 to 1.1572 at 1.1039 to contain downside. On the upside, break of 1.1572 will resume larger up trend.
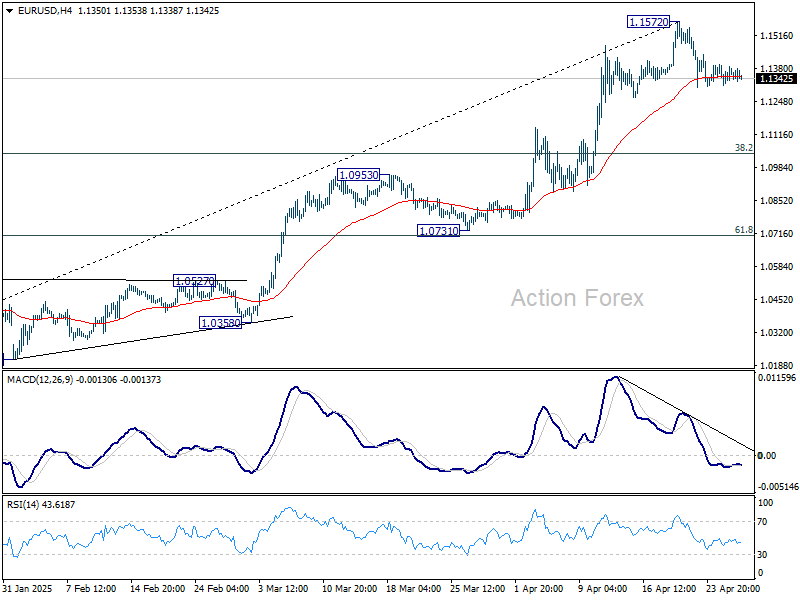
In the bigger picture, rise from 0.9534 long term bottom could be correcting the multi-decade downtrend or the start of a long term up trend. In either case, further rise should be seen to 100% projection of 0.9534 to 1.1274 from 1.0176 at 1.1916. This will now remain the favored case as long as 55 W EMA (now at 1.0792) holds.