Sample Category Title
EUR/USD Targets Key Breakout — Fresh Upside Potential Growing
Key Highlights
- EUR/USD corrected gains and tested the 1.1265 support zone.
- A connecting bearish trend line is forming with resistance at 1.1340 on the 4-hour chart.
- GBP/USD is consolidating gains near the 1.3300 level.
- Crude oil prices declined and traded below the $57.20 support.
EUR/USD Technical Analysis
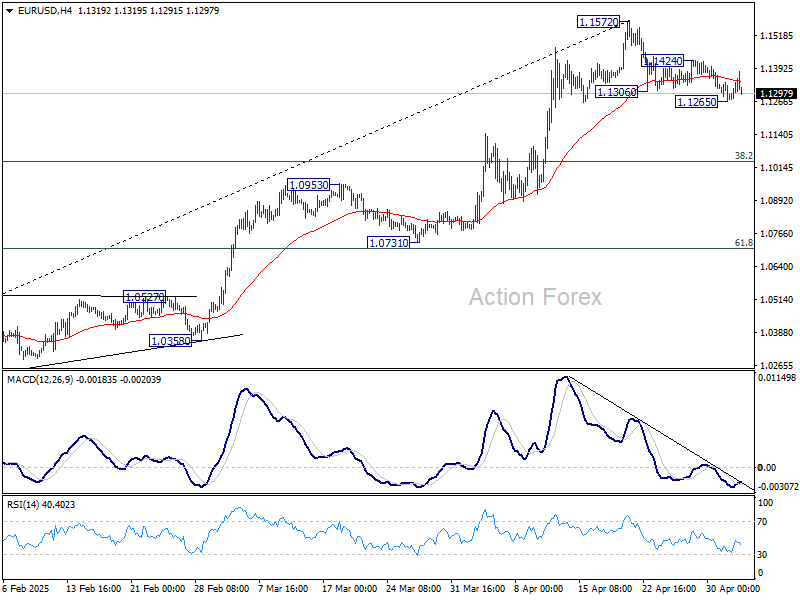
The Euro started a downside correction from 1.1570 against the US Dollar. EUR/USD dipped below 1.1450 and tested the 1.1265 support zone.
Looking at the 4-hour chart, the pair settled below the 100 simple moving average (red, 4-hour) but stayed above the 200 simple moving average (green, 4-hour). A low was formed at 1.1265 and the pair is now attempting a fresh increase. There was a move above the 1.1300 level.
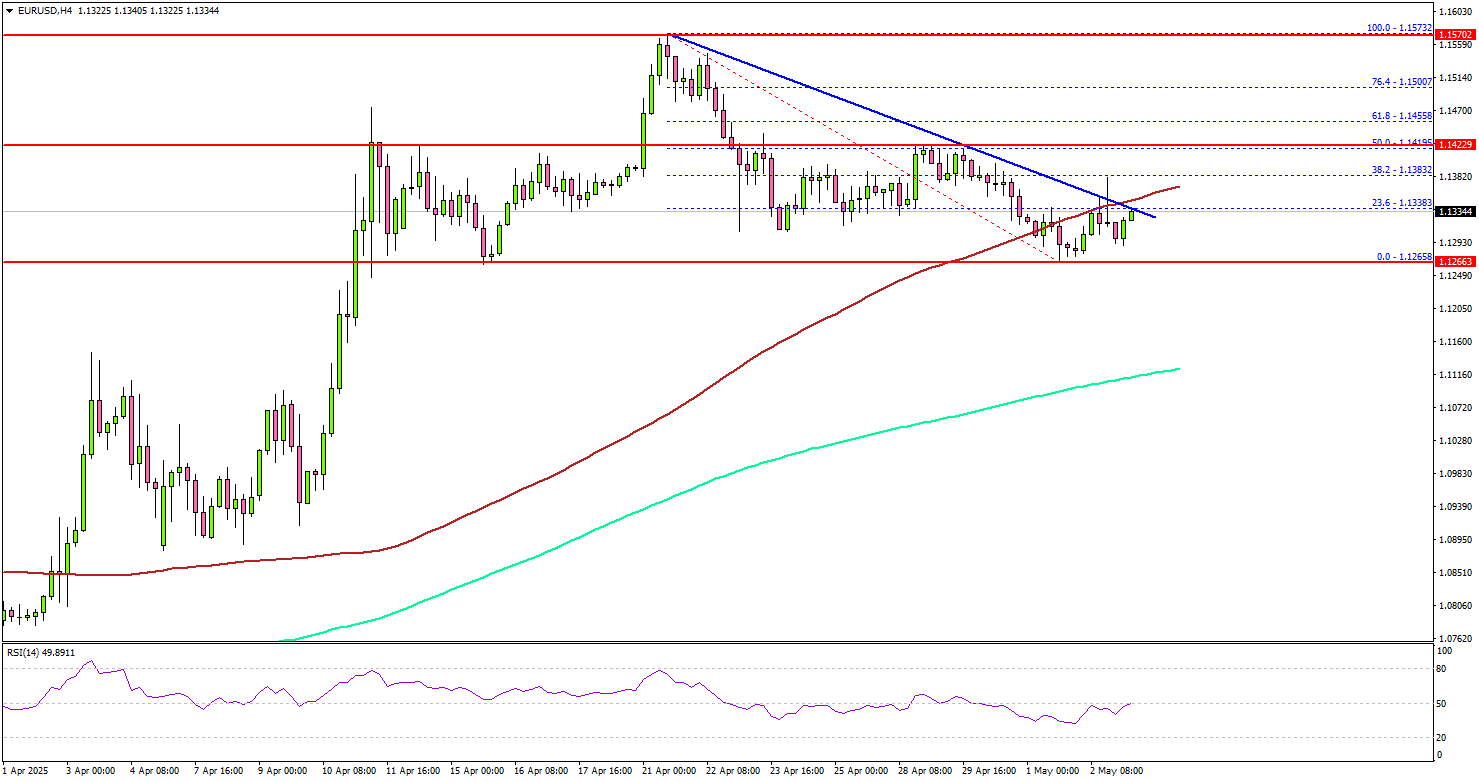
The pair is now facing resistance near the 1.1340 level and the 100 simple moving average (red, 4-hour). There is also a connecting bearish trend line forming with resistance at 1.1340 on the same chart.
An upside break above the trend line resistance could start a steady increase. The next major resistance is near the 1.1420 zone and the 50% Fib retracement level of the downward move from the 1.1572 swing high to the 1.1265 low.
A close above the 1.1420 level could set the tone for another increase. In the stated case, the pair could even clear the 1.1500 resistance.
On the downside, immediate support sits near the 1.1280 level. The next key support sits near the 1.1265 level. Any more losses could send the pair toward the 1.1150 level.
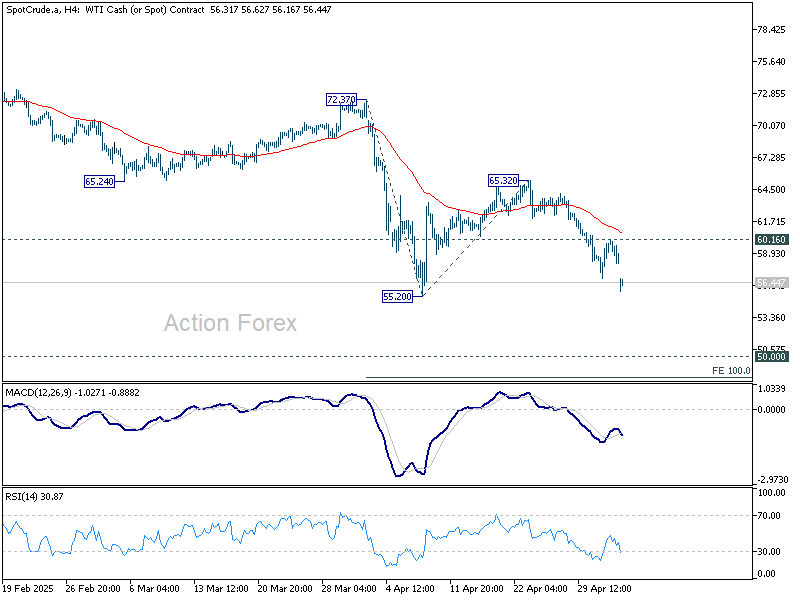
Looking at Crude oil, the price declined further and the bears were able to push the price toward the $55.00 support zone.
Upcoming Economic Events:
- US S&P Global Services PMI for April 2025 – Forecast 51.4, versus 51.4 previous.
- US ISM Services Index for April 2025 – Forecast 50.6, versus 50.8 previous.
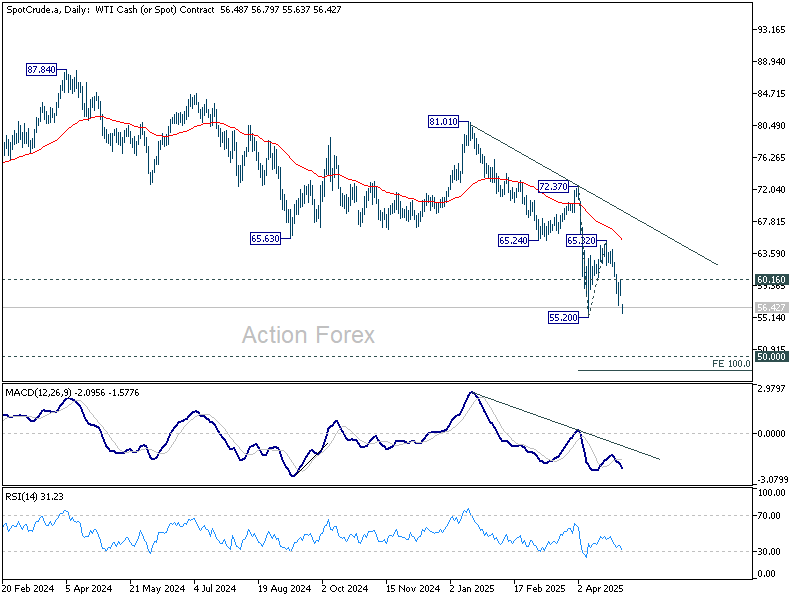
Oil sinks as OPEC+ ramps up output again, WTI heading back to 4-yr low
Oil prices opened the week with a sharp gap lower, as traders responded to OPEC+'s weekend agreement to accelerate output increases for a second straight month. WTI crude is now heading back toward the four-year low of $55.20 set in April.
OPEC+ will raise June production by 411k barrels per day. That brings the total additional supply from April to June to nearly one million barrels per day, representing 44% rollback of the group’s 2022-era production cuts.
This shift has stoked concerns that global oil markets may soon swing into surplus. The broader concern is that OPEC+ may fully unwind voluntary production cuts by October unless compliance among members improves. Such a move would flood the market with more supply just as global demand outlooks remain clouded by trade tensions.
Technically, prior rejection by 65.24 support turned resistance keeps WTI's long term down trend intact. Further decline is now expected as long as 60.16 resistance holds. Firm break of 55.20 low will confirm down trend resumption. WTI could then decline through 50 psychological level to 100% projection of 72.37 to 55.20 from 65.32 at 48.20.
GOLD ($XAUUSD) Elliott Wave : Incomplete Sequences Calling the Decline
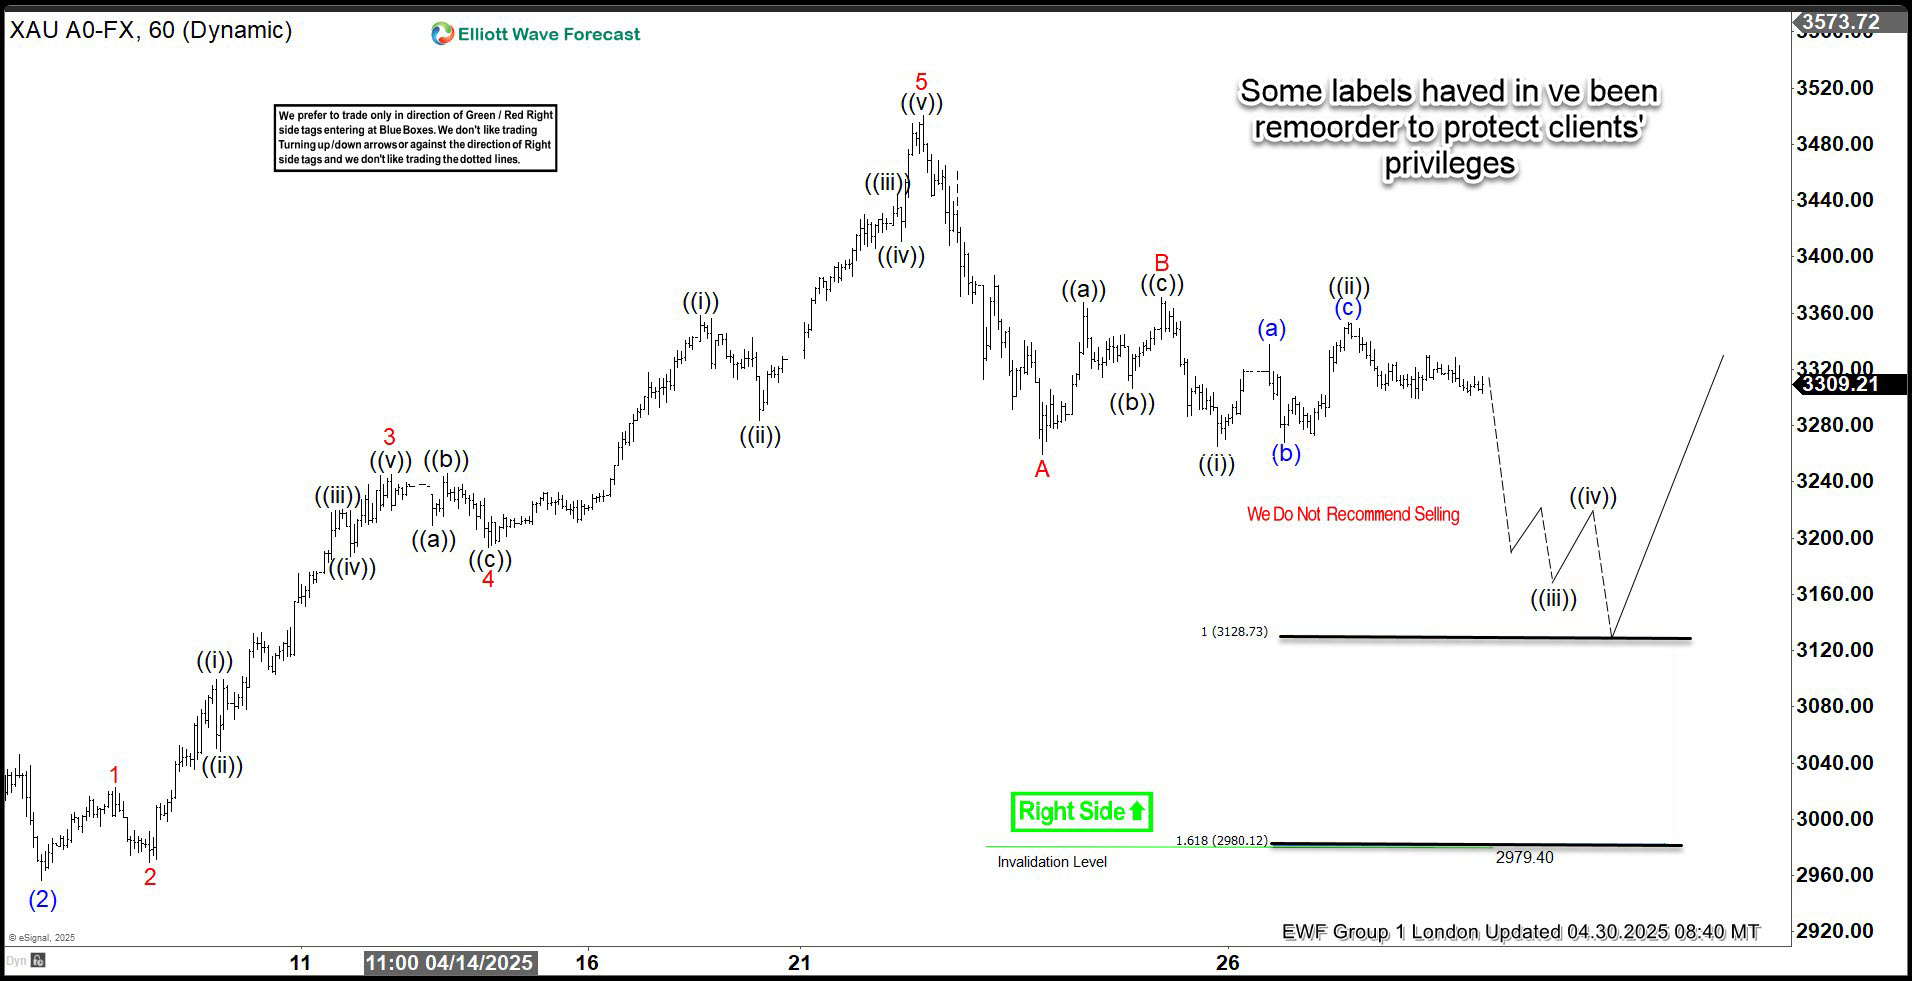
Hello fellow traders. In this technical article we’re going to look at the Elliott Wave charts of GOLD ($XAUUSD ) published in members area of the website. As our members know, XAUUSD is forming a correction against the 2954.2 low. In the following text, we’ll explain the Elliott Wave analysis and outline the target areas.
XAUUSD Elliott Wave 1 Hour Chart 04.30.2025
The price structure shows incomplete sequences from the April 22nd peak. The price broke below the 3260 level, confirming a potential extension to the downside.
As long as the price remains below the 3352.9 peak, we consider the intraday wave ((ii)) bounce completed and anticipate further decline in the near term.
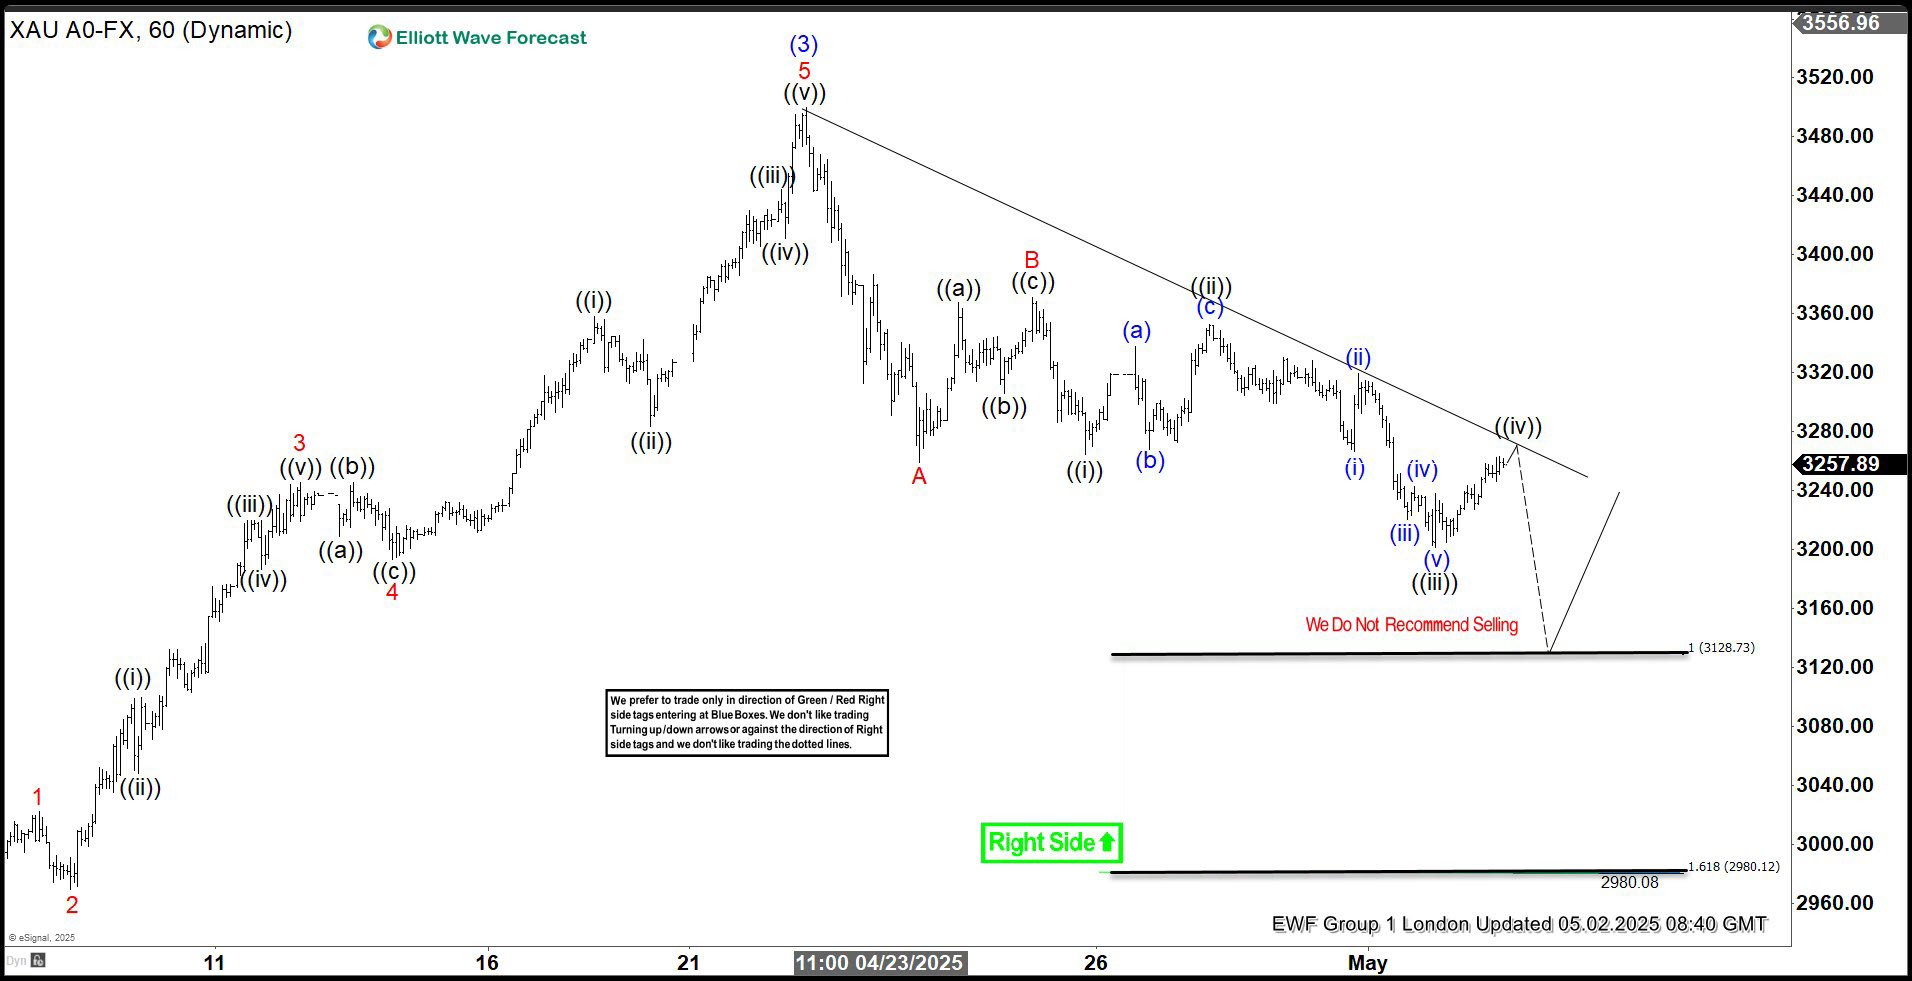
XAUUSD Elliott Wave 1 Hour Chart 05.02.2025
GOLD continued to drop as expected. The price broke to new lows, confirming the extension toward the 3128.7–2980.2 area.
We do not recommend selling at this point. If the marked extreme zone is reached, we will consider entering long positions again.
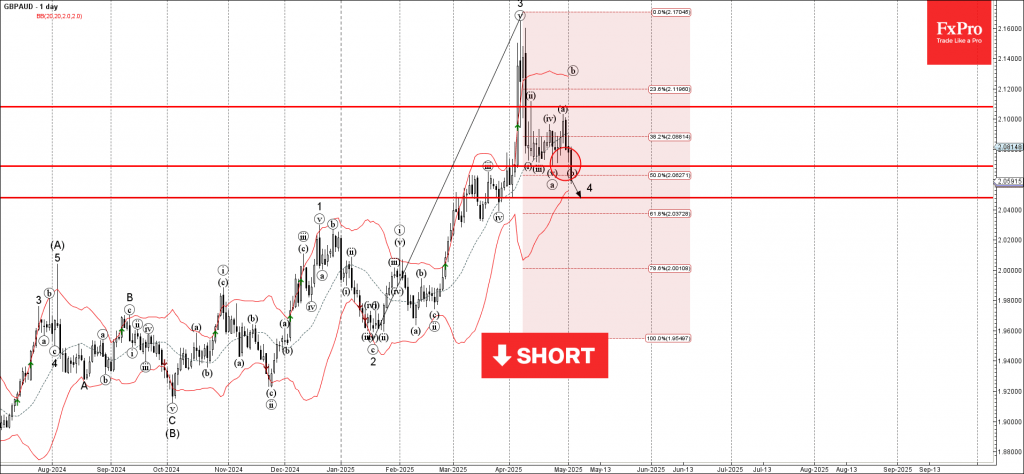
GBPAUD Wave Analysis
GBPAUD: ⬇️ Sell
- GBPAUD broke support zone
- Likely to fall to support level 2.0475
GBPAUD currency pair recently broke the support zone between the pivotal support level 2.0685 (which stopped the previous waves i, iii, v) and the 50% Fibonacci correction of the upward impulse from January.
The breakout of this support zone continues the c-wave of the active ABC correction 4 from the start of April.
GBPAUD can be expected to fall to the next support level 2.0475 (target price for the completion of the active correction 4).
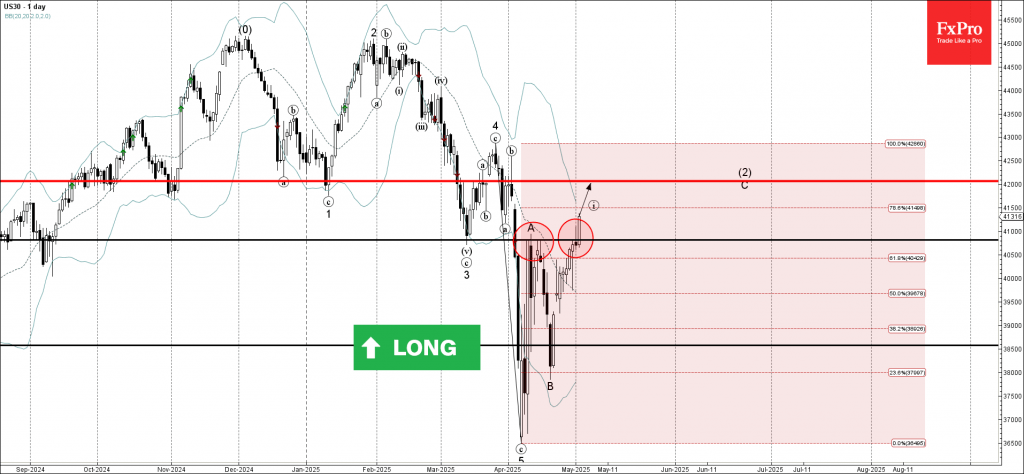
Dow Jones Wave Analysis
Dow Jones: ⬆️ Buy
- Dow Jones broke resistance zone
- Likely to rise to resistance level 42000.00
Dow Jones index recently broke the resistance zone between the pivotal resistance level 40815 (former support from March and the top of wave A from the start of April) and the 61.8% Fibonacci correction of the downward impulse 5 from March.
The breakout of this resistance zone continues the C-wave of the active ABC correction (2) from the start of April.
Dow Jones index can be expected to rise to the next resistance level 42000.00 (target price for the completion of the active impulse wave C).
Risk-On Sentiment Regains Control as Data Downplays Severity of Tariff Shock
Global risk sentiment continued to improve last week, with major equity indices staging robust rallies as investor anxiety over the fallout from tariffs eased. The solid US non-farm payroll data was a key turning point, reassuring markets that the early economic impact of the trade shock was not as damaging as initially feared. Added to that, there were signs of progress on multiple trade negotiation fronts, including a potential thaw in US-China relations.
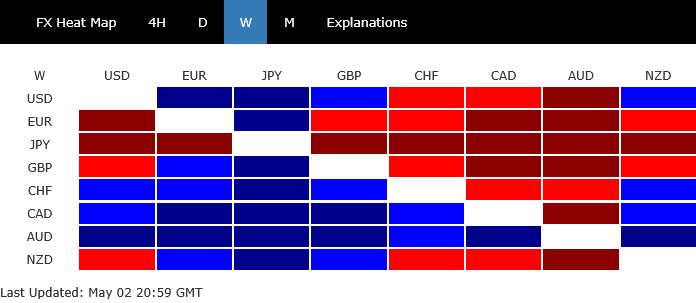
In the currency markets, Aussie was the top performer, buoyed not only by improving risk appetite but also by stronger-than-expected inflation data, which suggests the RBA’s easing path may remain gradual. Loonie followed as second benefiting from political stability after the Canadian elections. Swiss Franc ranked third.
On the other hand, Yen fell the most, under pressure from a dovish BoJ that downgraded its growth outlook. Euro was the second weakest performer, reversing some of its earlier strength despite a sharper-than-expected acceleration in core inflation. Sterling also lagged as third worst. Dollar and New Zealand Dollar ended the week in the middle of the pack.
US Stocks Erase April Losses as Payrolls Soothe Growth Fears, Fed Cut Odds Fall
The US markets have decisively moved past the turmoil sparked by the reciprocal tariff announcements in April. Investor confidence has fully recovered, especially in equities with both S&P 500 and NASDAQ reversed all losses from April. S&P 500 even notched a remarkable nine consecutive days of gains, its longest winning streak since 2004. DOW is also on track to complete a full reversal.
Sentiment had wavered briefly after Q1 GDP showed an unexpected contraction. However, those concerns were largely alleviated by April’s non-farm payroll report, which showed solid job creation and stable unemployment. The data suggests that while trade disruptions remain a concern, the labor market is resilient and the broader economy is still on strong footing. This has helped markets conclude that the immediate economic damage from the tariff standoff is more modest than feared.
Looking ahead, the 90-day tariff truce, set to expire in early July, becomes the next major milestone for investors. There are tentative signs of progress on trade negotiations, including fresh signals from China that it may be open to returning to the table. While expectations for a zero-tariff outcome remain low, the fear of escalation to a worst-case scenario has clearly eased. Markets appear to be pricing in a more constructive path, even if slow-moving and politically complex.
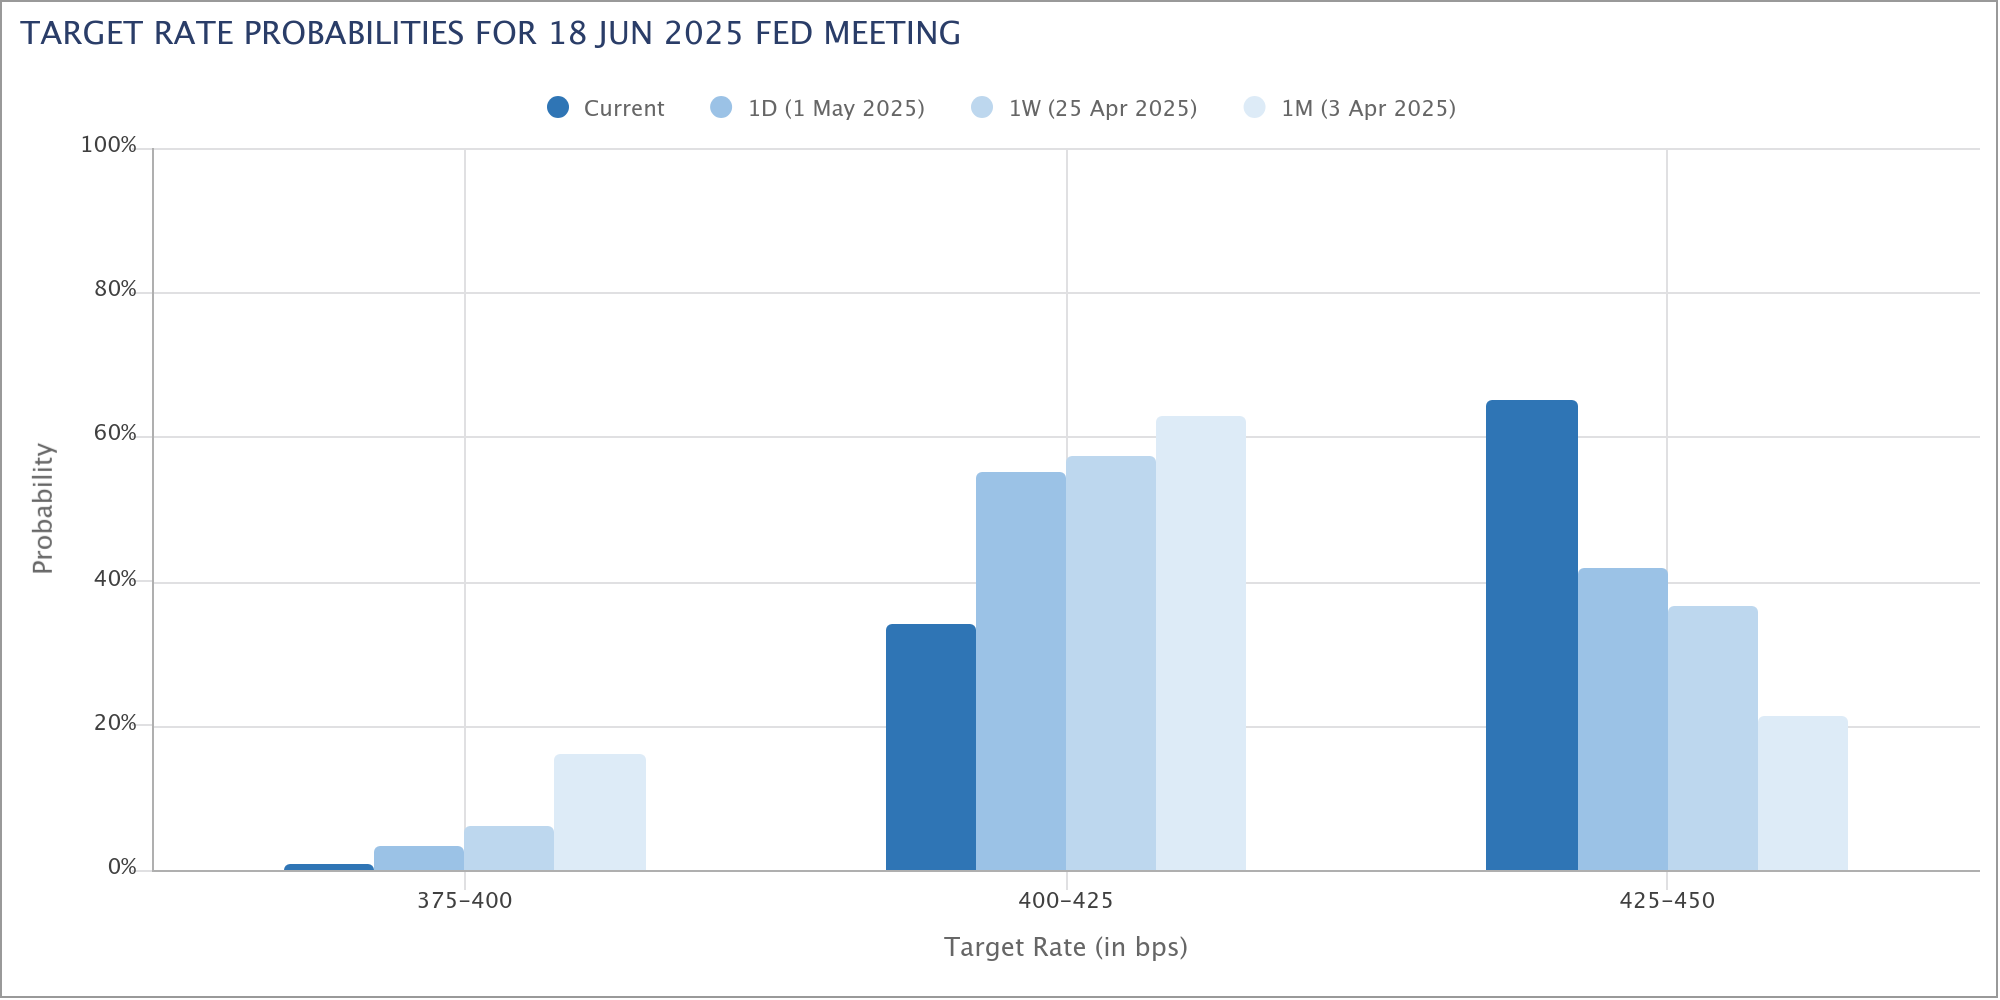
At the same time, expectations for Fed policy are undergoing a recalibration. With the labor market holding firm and inflation still persistent, the urgency for another rate cut has diminished. Fed fund futures are now pricing just a 35% chance of a cut in June — down sharply from 63% a week ago and nearly 80% at the start of April. Importantly, this moderation in rate cut bets is being absorbed without negative market reaction, signaling that investors are comfortable with Fed remaining on hold for longer.
Technically, S&P 500's rally from the 4835.04 low is seen as the second leg in the medium-term pattern from 6147.43 record high. Further upside is favored in the near term as long as 5433.24 support holds. But significant resistance around 6147.43 to bring the third leg of the pattern.
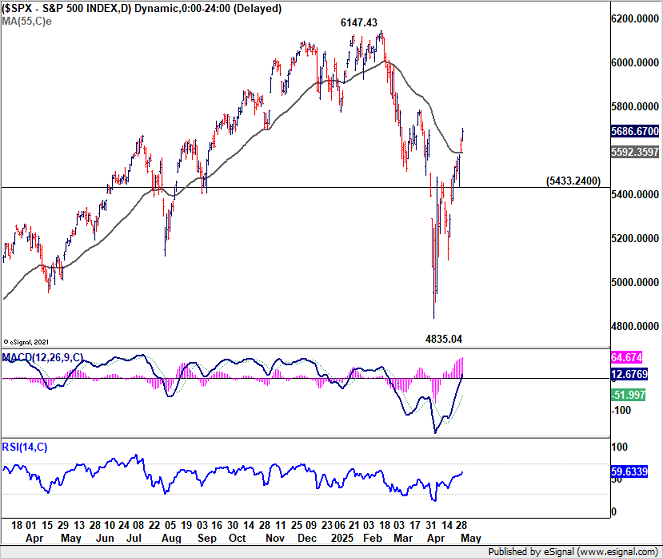
In the bigger picture, the long term up trend remains intact. S&P 500 is well supported by long term rising channel, and managed to defend 4818.62 resistance turned support (2022 high).
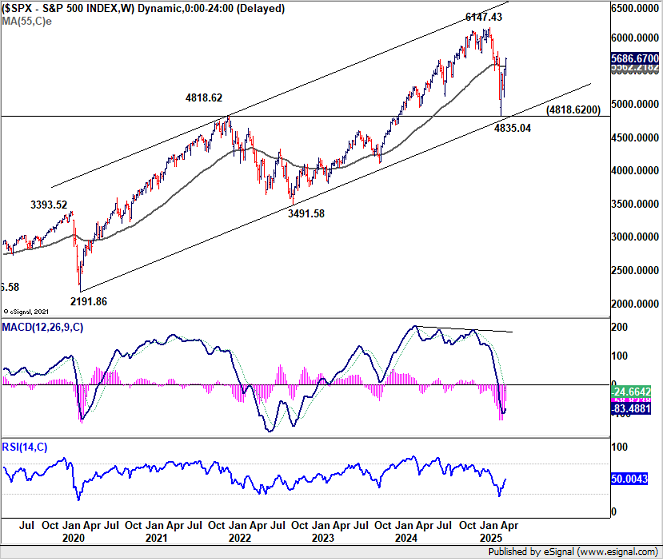
An upside breakout is possible during the second half of the year. But that would depend on two key elements: the resolution of trade uncertainty and continued economic resilience.
If July’s truce deadline passes without escalation — or better yet, with concrete de-escalation — and economic data remains firm, then a new record would be on the horizon.
Yields Rise on Risk-On Flow, But Dollar Fails to Ride the Wave
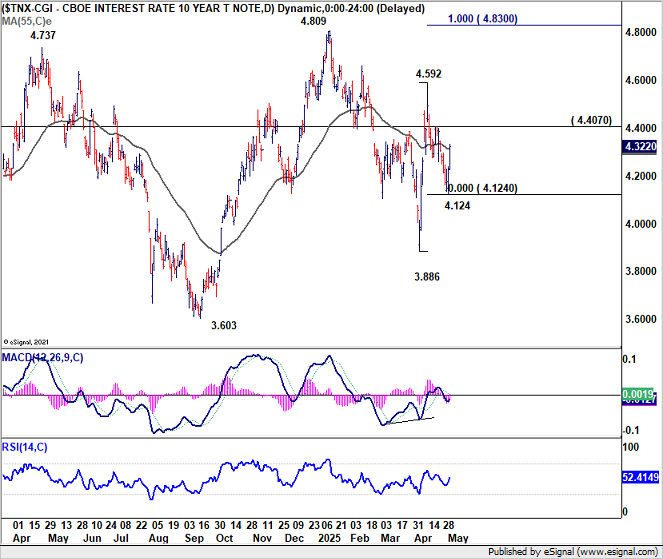
US 10-year Treasury yield staged a rally rebound on Friday, in tandem with equities. Unlike previous yield spikes driven by capital flight, this surge appears rooted in a rotation out of safe-haven assets and into equities, as risk appetite returned.
Technically, 10-year yield's pull back from 4.592 has likely completed with three waves down to 4.124. Break of 4.407 resistance will solidify this bullish case. Rise from 3.886 could then be resuming through 4.592 resistance to 100% projection of 3.886 to 4.592 from 4.124 at 4.830.
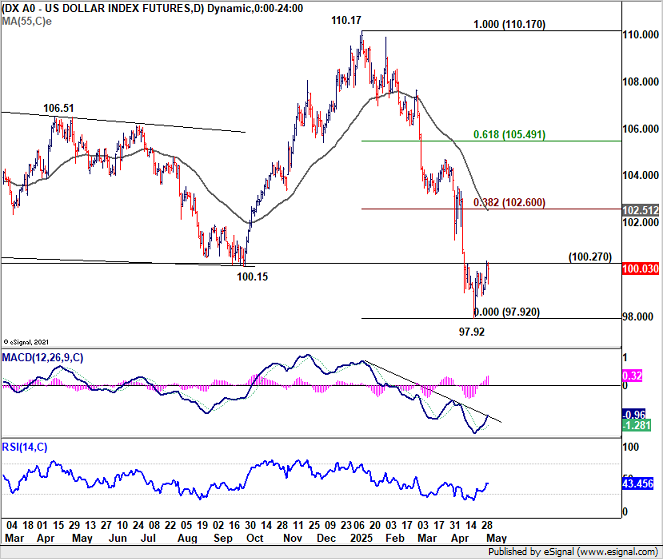
In contrast, Dollar has failed to capitalize on either yield strength or reduced recession anxiety. Expectations for Fed to keep interest rates elevated longer may provide some underlying support. But if risk sentiment continues to improve, demand for USD as a defensive play may continue to weaken, even as yield support holds.
Technically, firm break of 100.27 resistance in Dollar Index will bring stronger rebound back to 55 D EMA (now at 102.51). But strong resistance should be seen from 38.2% retracement of 110.17 to 97.92 at 102.60 to limit upside.
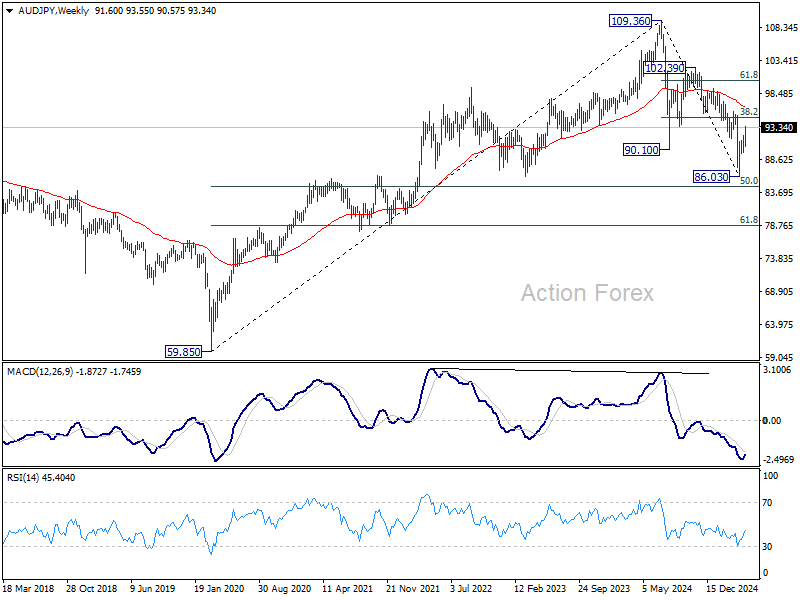
Bullish Case Continue to Build for AUD/JPY, with 94.94 Fibonacci Target in Insight
AUD/JPY ended last week as the top winner and gained 1.56%, on a potent mix of risk-on sentiment and changes in monetary policy outlooks.
Aussie's strength was reinforced by Q1 inflation data from Australia. On the one hand, the trimmed mean CPI returned to RBA’s 2–3% target range for the first time since 2021, cementing expectations of a May rate cut. However, stronger than expected headline CPI reading, and renewed goods inflation pressures points to a cautious and gradual easing path, rather than an aggressive cycle.
In contrast, Yen suffered after BoJ left rates unchanged and sharply downgraded its growth forecast for fiscal 2025, slashing it by more than half. Additionally, core inflation projections were revised lower, raising the risk of falling short of the 2% target again. The downgrade has pushed back expectations of any near-term rate hikes. A June move now looks off the table.
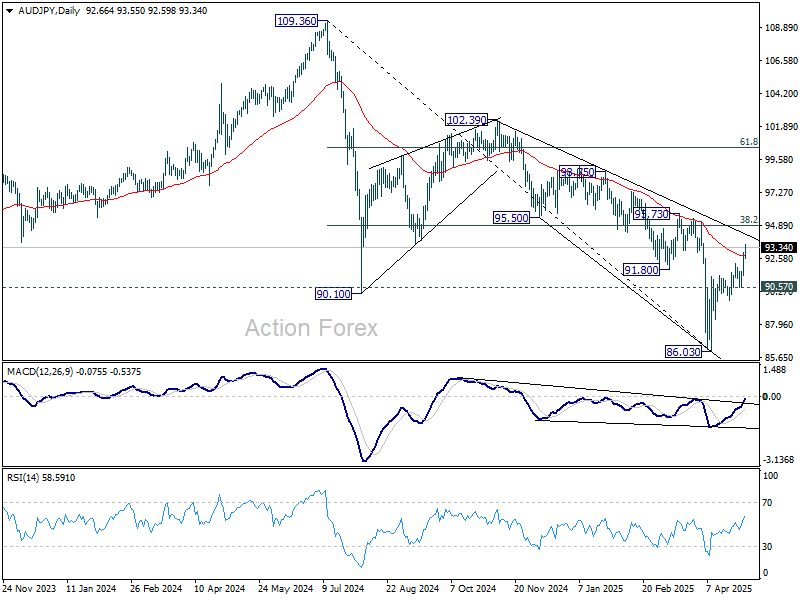
Technically, the developments continue to affirm the case that corrective fall from 109.36 (2024 high) has completed with three waves down to 86.03.
Further rally should be seen in the near term as long as 90.57 support holds, to 38.2% retracement of 109.36 to 86.03 at 94.94. Sustained break there will pave the way to 61.8% retracement at 100.44.
However, rejection by 94.94 fibonacci resistance, followed by break of 90.57 support, will dampen this bullish view and bring retest of 86.03.
EUR/USD Weekly Outlook
EUR/USD gyrated lower last week but recovered after hitting 1.1265. Initial bias remains neutral this week first. On the downside, below 1.1265 will resume the corrective fall from 1.1572 short term top. But downside should be contained by 38.2% retracement of 1.0176 to 1.1572 at 1.1039. On the upside, break of 1.1424 will suggest that the correction has completed and bring retest of 1.1572 high.
In the bigger picture, rise from 0.9534 long term bottom could be correcting the multi-decade downtrend or the start of a long term up trend. In either case, further rise should be seen to 100% projection of 0.9534 to 1.1274 from 1.0176 at 1.1916. This will now remain the favored case as long as 55 W EMA (now at 1.0776) holds.
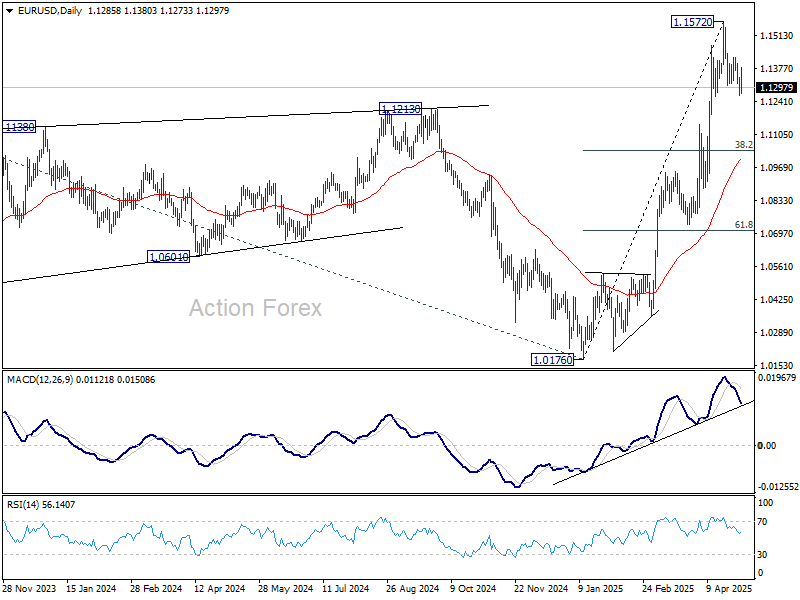
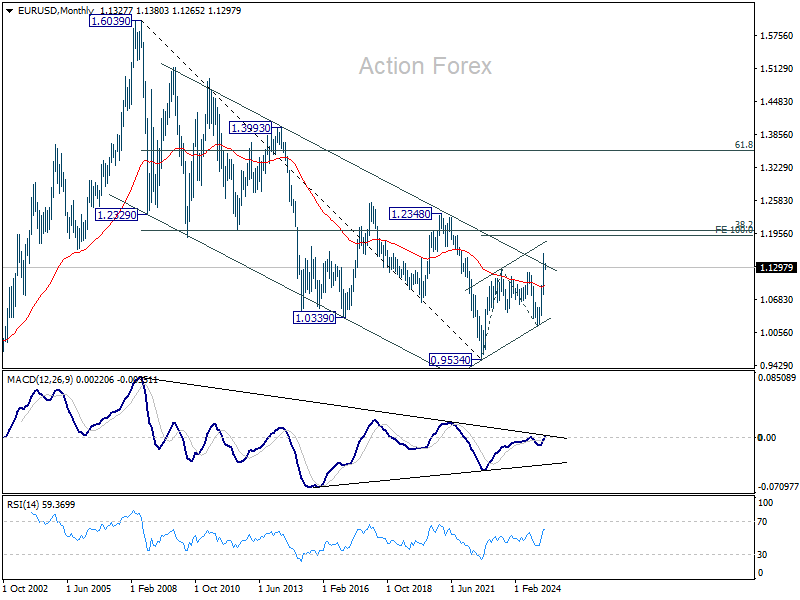
In the long term picture, the case of long term bullish reversal is building up. Sustained break of falling channel resistance (now at around 1.1300) will argue that the down trend from 1.6039 (2008 high) has completed at 0.9534. A medium term up trend should then follow even as a corrective move. Next target is 38.2% retracement of 1.6039 to 0.9534 at 1.2019.

EUR/USD Weekly Outlook
EUR/USD gyrated lower last week but recovered after hitting 1.1265. Initial bias remains neutral this week first. On the downside, below 1.1265 will resume the corrective fall from 1.1572 short term top. But downside should be contained by 38.2% retracement of 1.0176 to 1.1572 at 1.1039. On the upside, break of 1.1424 will suggest that the correction has completed and bring retest of 1.1572 high.
In the bigger picture, rise from 0.9534 long term bottom could be correcting the multi-decade downtrend or the start of a long term up trend. In either case, further rise should be seen to 100% projection of 0.9534 to 1.1274 from 1.0176 at 1.1916. This will now remain the favored case as long as 55 W EMA (now at 1.0776) holds.
In the long term picture, the case of long term bullish reversal is building up. Sustained break of falling channel resistance (now at around 1.1300) will argue that the down trend from 1.6039 (2008 high) has completed at 0.9534. A medium term up trend should then follow even as a corrective move. Next target is 38.2% retracement of 1.6039 to 0.9534 at 1.2019.
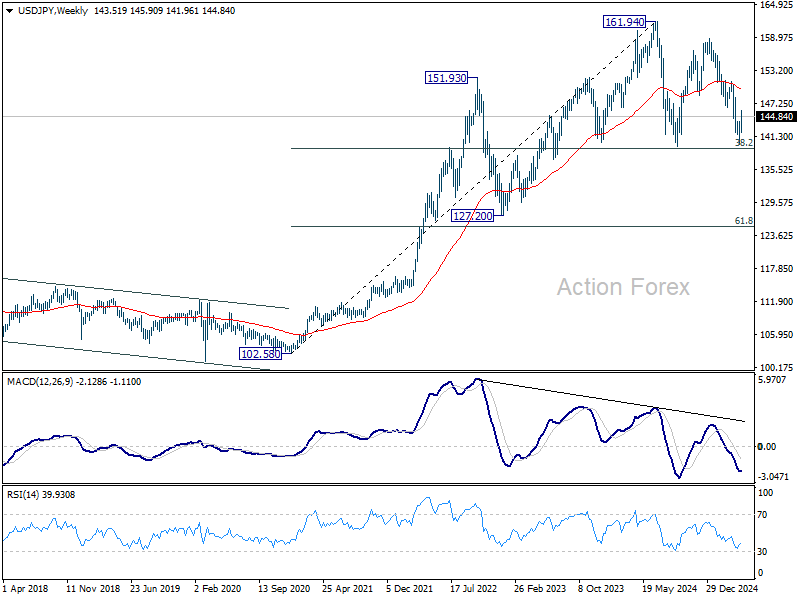
USD/JPY Weekly Outlook
USD/JPY's rebound from 139.87 short term bottom continued last week but retreated after hitting 145.90. Initial bias remains neutral this week first. Overall near term outlook will stay bearish as long as 38.2% retracement of 158.86 to 139.87 at 147.12 holds. Break of 141.96 will argue that the rebound has completed as a corrective move. Retest of 139.87 should then be seen next in this case.

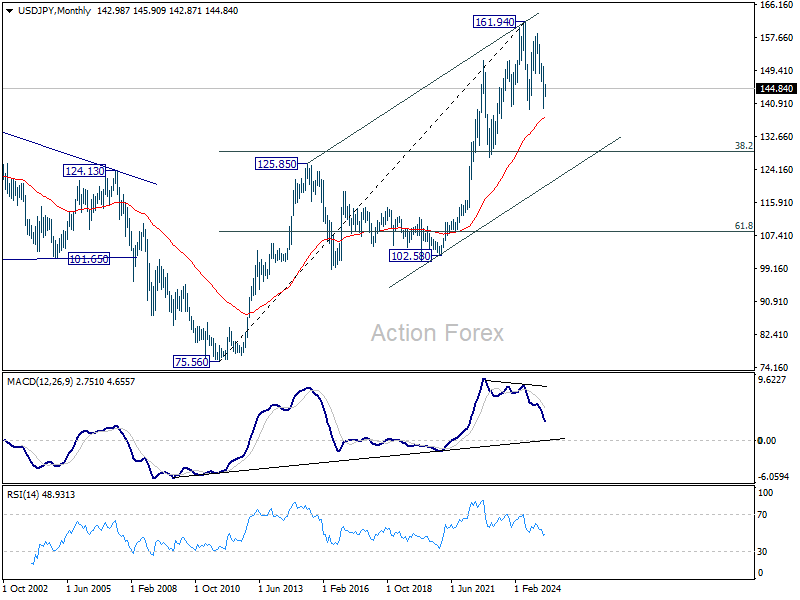
In the bigger picture, price actions from 161.94 are seen as a corrective pattern to rise from 102.58 (2021 low), with fall from 158.86 as the third leg. Strong support should be seen from 38.2% retracement of 102.58 to 161.94 at 139.26 to bring rebound. However, sustained break of 139.26 would open up deeper medium term decline to 61.8% retracement at 125.25.
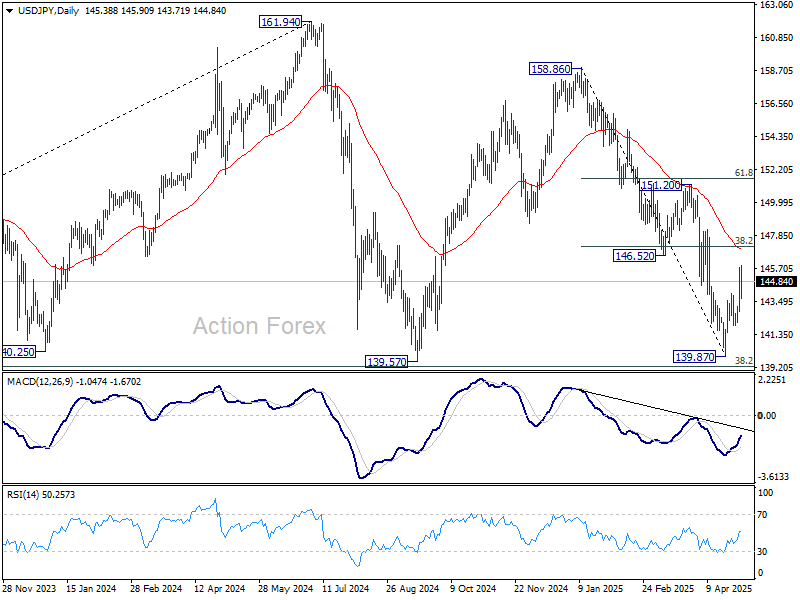
In the long term picture, it's still early to conclude that up trend from 75.56 (2011 low) has completed. A medium term corrective phase should have commenced, with risk of deep correction towards 55 M EMA (now at 137.44) and even below.
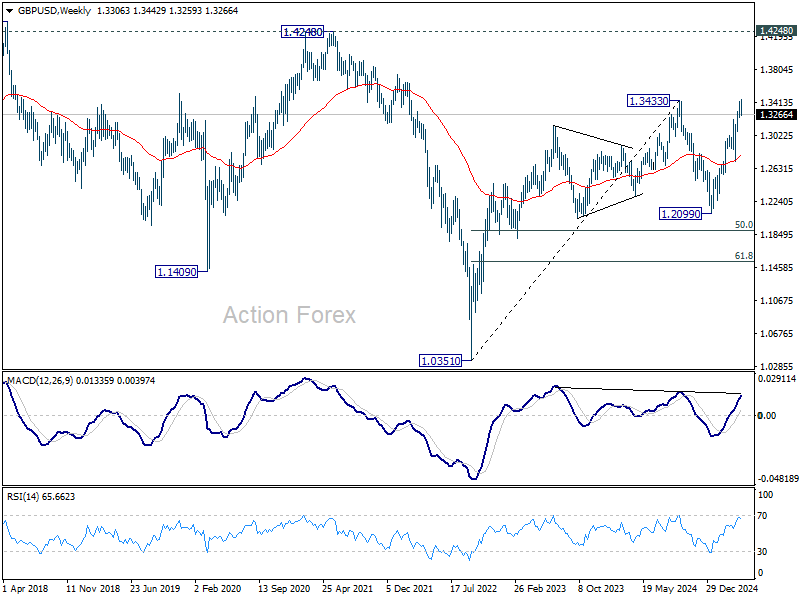
GBP/USD Weekly Outlook
GBP/USD edged higher to 1.3442 last week but failed to sustain above 1.3433 resistance. Initial bias remains neutral this week first. On the downside, firm break of 1.3232 support will indicate short term topping and rejection by 1.3433 key resistance. Intraday bias will be back on the downside for deeper pullback to 55 D EMA (now at 1.3010) and possibly below. On the upside, firm break of 1.3433 key resistance confirm larger up trend resumption.
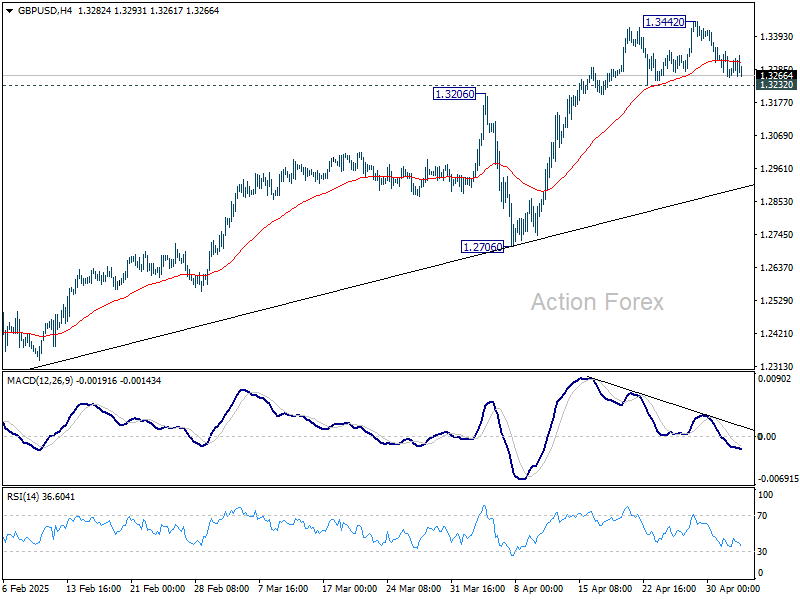
In the bigger picture, price actions from 1.3433 are seen as a corrective pattern to the up trend from 1.3051 (2022 low). Rise from 1.2099 could either be resuming the up trend, or the second leg of a consolidation pattern. Overall, GBP/USD should target 1.4248 key resistance (2021 high) on decisive break of 1.3433 at a later stage.
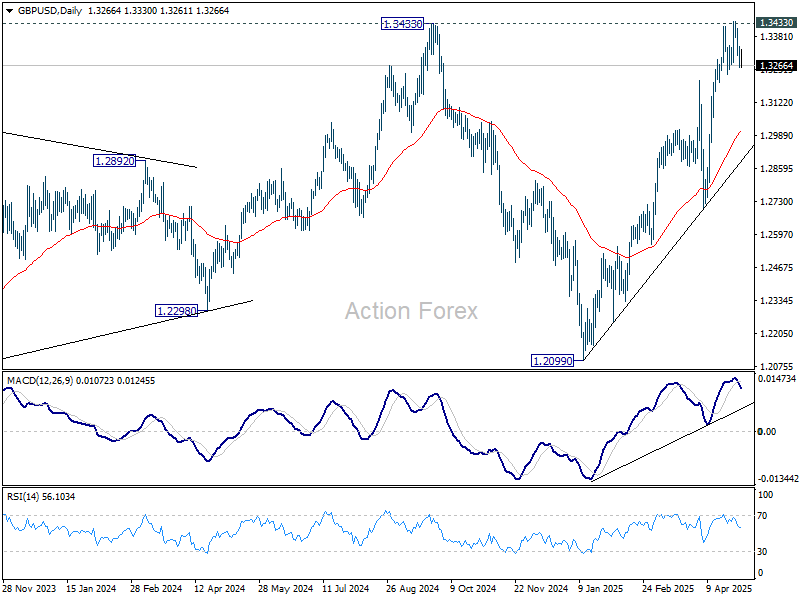
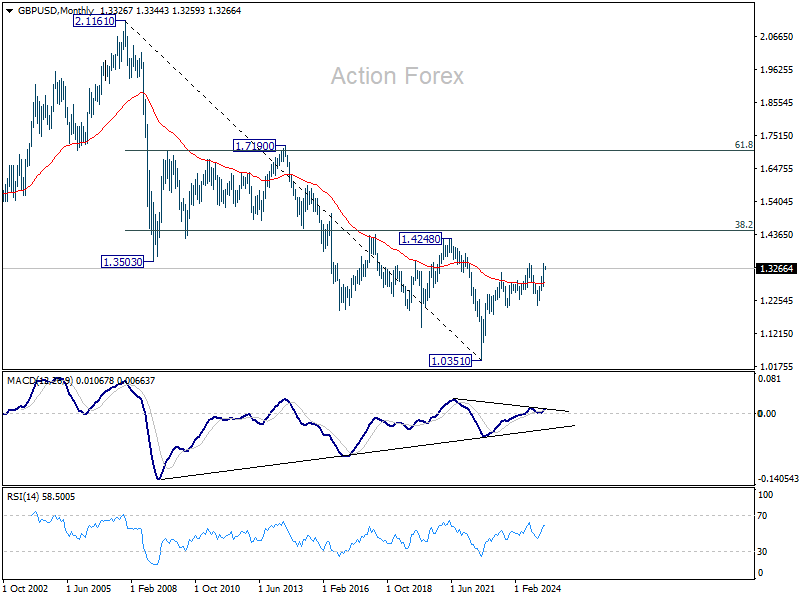
In the long term picture, price actions from 1.0351 (2022 low) are seen as a corrective pattern to the long term down trend from 2.1161 (2007 high) only. Outlook will be neutral at best as long as 1.4248 structural resistance holds, even in case of strong rebound.