Sample Category Title
GBP/USD Hits New High: The Pound Defies Market Pressures
The British pound has reached another three-year peak against the US dollar, stabilising around 1.3400.
Key factors driving GBP/USD strength
Sterling is closing April with its strongest monthly performance since November 2023, gaining over 3% against the US dollar.
Two key factors support the pound’s resilience:
- Monetary policy divergence – Markets expect the Bank of England (BoE) to slow the pace of interest rate cuts compared to other central banks. Current projections suggest the BoE will reduce rates by 85 basis points in 2025, roughly in line with expectations for the US Federal Reserve.
- Dollar alternatives in demand – Investors seek alternatives to the US dollar, and the UK appears less vulnerable to US tariff risks. A 90-day moratorium on increased US tariffs expires in late July, renewing global economic uncertainties.
Against this backdrop, the UK and its currency appear more stable than many peers.
Technical analysis: GBP/USD
H4 chart
- GBP/USD continues to consolidate around 1.3344, with the range now extending to 1.3440.
- A downside retest of 1.3344 is expected, followed by potential upward momentum towards 1.3455, defining the range boundaries.
- A break below consolidation could trigger a downward wave targeting 1.3080 as the initial objective.
- The MACD indicator supports this outlook, with its signal line above zero but poised for a decline.

H1 chart
- The pair has broken above 1.3344, achieving a local target at 1.3440
- A corrective decline towards 1.3344 is anticipated before potential renewed growth towards 1.3455
- The Stochastic oscillator aligns with this scenario, with its signal line below 20 and primed for an upward move towards 80

Conclusion
The pound remains defensive yet strong, buoyed by relative monetary policy stability and its appeal as a dollar alternative. Technically, the pair is testing key levels, with further direction contingent on consolidation breaks.
ECB consumer survey shows inflation expectations ticking higher
ECB’s Consumer Expectations Survey for March showed that consumers are raising their inflation views in a relatively measured manner rather than in a panic. Overall, the results present a slight inflationary concern on one side, but still subdued growth prospects on the other.
Median expectations for inflation over the next 12 months rose by 0.3% to 2.9%, the highest level since April 2024.
Looking further ahead, expectations for inflation three years out edged up by 0.1% to 2.5%, also hitting a one-year high.
Newly introduced five-year inflation expectations remained stable at 2.1%, suggesting longer-term expectations remain relatively anchored.
Uncertainty about the inflation outlook remained at its lowest level since January 2022.
On the broader economic front, the survey indicated that consumers’ income growth expectations stayed unchanged at a modest 1.0% over the next year, while expected nominal spending growth edged down to 3.4%.
Economic growth expectations remained weak, steady at -1.2% for the next 12 months.
AUD/USD Consolidates Gains While NZD/USD Dips
AUD/USD is consolidating gains near the 0.6420 zone. NZD/USD is trimming gains and struggling to stay above the 0.5945 pivot zone.
Important Takeaways for AUD/USD and NZD/USD Analysis Today
- The Aussie Dollar started a downside correction from 0.6450 against the US Dollar.
- There was a break above a key bearish trend line with resistance near 0.6400 on the hourly chart of AUD/USD at FXOpen.
- NZD/USD is declining from the 0.6030 resistance zone.
- There is a major bearish trend line forming with resistance near 0.5970 on the hourly chart of NZD/USD at FXOpen.
AUD/USD Technical Analysis
On the hourly chart of AUD/USD at FXOpen, the pair started a fresh increase from the 0.6345 support. The Aussie Dollar was able to clear the 0.6375 resistance to move into a positive zone against the US Dollar.
There was also a move above the 0.6400 resistance and the 50-hour simple moving average. There was also a break above a key bearish trend line with resistance near 0.6400. Finally, the pair tested the 0.6450 zone. A high was formed near 0.6450 and the pair is now correcting gains.
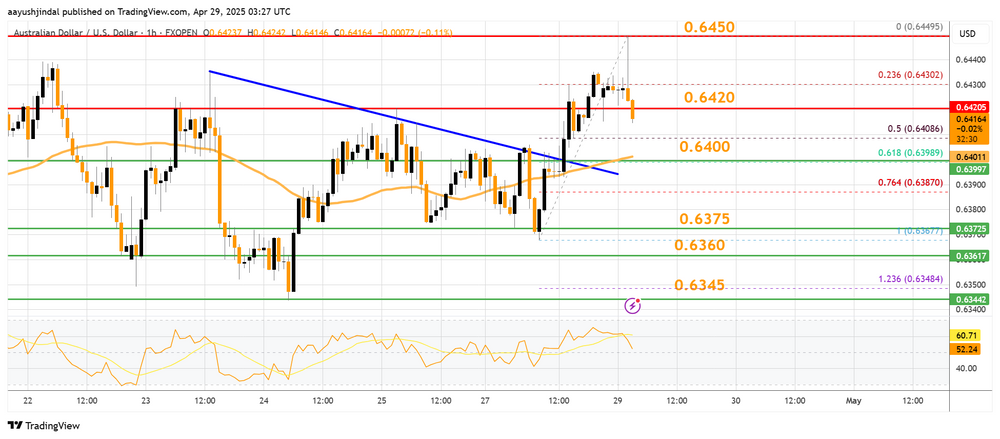
There was a move below the 0.6420 level. The pair declined below the 23.6% Fib retracement level of the upward move from the 0.6367 swing low to the 0.6449 high.
On the downside, initial support is near the 0.6400 level. It is close to the 61.8% Fib retracement level of the upward move from the 0.6367 swing low to the 0.6449 high. The next major support is near the 0.6360 level.
If there is a downside break below the 0.6360 support, the pair could extend its decline toward the 0.6345 level. Any more losses might signal a move toward 0.6300.
On the upside, the AUD/USD chart indicates that the pair is now facing resistance near 0.6420. The first major resistance might be 0.6450. An upside break above the 0.6450 resistance might send the pair further higher.
The next major resistance is near the 0.6485 level. Any more gains could clear the path for a move toward the 0.6550 resistance zone.
NZD/USD Technical Analysis
On the hourly chart of NZD/USD on FXOpen, the pair attempted another wave above the 0.6000 zone but failed. The New Zealand Dollar started another downward move from 0.6000 and dipped below 0.5980 against the US Dollar.
The pair settled below the 0.5970 level and the 50-hour simple moving average. It tested the 0.5930 zone and is currently consolidating losses near the 50% Fib retracement level of the downward move from the 0.6000 swing high to the 0.5928 low.
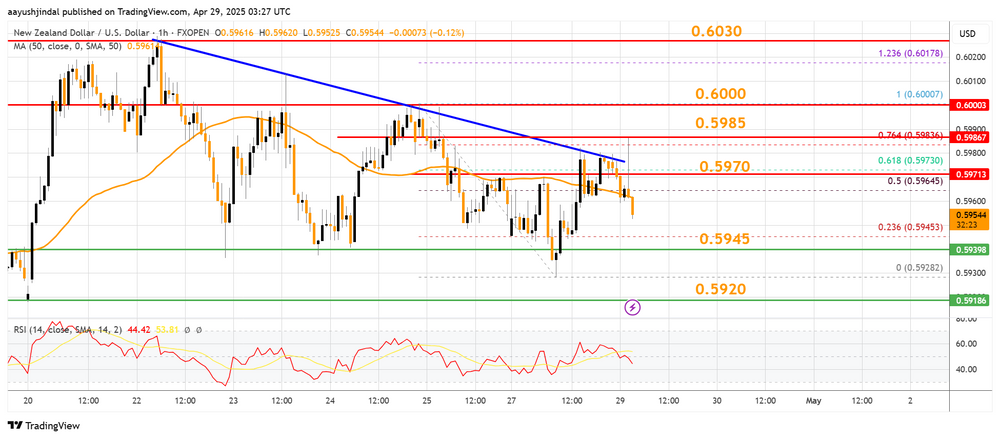
The NZD/USD chart suggests that the RSI is now well below 50 and signaling more downsides. On the downside, there is major support forming near 0.5945.
The next major support is near the 0.5920 level. If there is a downside break below the 0.5920 support, the pair might slide toward the 0.5880 support. Any more losses could lead NZD/USD in a bearish zone to 0.5840.
On the upside, the pair might struggle near 0.5970 and the 61.8% Fib retracement level of the downward move from the 0.6000 swing high to the 0.5928 low.
There is also a major bearish trend line forming with resistance near 0.5970. The next major resistance is near the 0.5985 level. A clear move above the 0.5985 level might even push the pair toward the 0.6000 level. Any more gains might clear the path for a move toward the 0.6030 resistance zone in the coming days.
Trade over 50 forex markets 24 hours a day with FXOpen. Take advantage of low commissions, deep liquidity, and spreads from 0.0 pips. Open your FXOpen account now or learn more about trading forex with FXOpen.
This article represents the opinion of the Companies operating under the FXOpen brand only. It is not to be construed as an offer, solicitation, or recommendation with respect to products and services provided by the Companies operating under the FXOpen brand, nor is it to be considered financial advice.
ECB’s Cipollone warns trade fragmentation could severely hit global and Eurozone growth
ECB Executive Board member Piero Cipollone warned today that the recent surge in trade policy uncertainty poses a material risk to Eurozone growth. In a speech, he highlighted internal ECB research suggesting that rising uncertainty could trim Eurozone business investment by -1.1% in the first year, while real GDP growth could fall by about -0.2% in 2025-26.
Financial market volatility, elevated due to the global trade tensions, could further drag on growth. ECB staff estimate that the observed increase in volatility alone could shave an additional -0.2% off Eurozone GDP in 2025.
Cipollone emphasized that over the medium term, tariffs will have an "unambiguously recessionary effect" across both economies imposing and receiving restrictions, and noted that the ability of exchange rates to "absorb tariff shocks" appears to have diminished.
ECB’s analysis of fragmentation scenarios paints an even bleaker picture. In a mild East-West decoupling, global output could drop by nearly -2%. In a severe decoupling where trade between blocs halts entirely, global output could plunge by up to -9%.
Trade-dependent economies would bear the heaviest losses, with the EU facing a GDP decline of between -2.4% and -9.5% depending on the severity. Notably, the US itself could suffer a near -11% contraction in the most extreme case if it "imposed additional trade restrictions against western and neutral economies".
While the growth impact of trade fragmentation is clear, the inflationary effects remain less certain. For the Eurozone, recessionary forces, stronger real interest rates, and Euro appreciation could generate a "disinflationary: trend in the near to medium term.
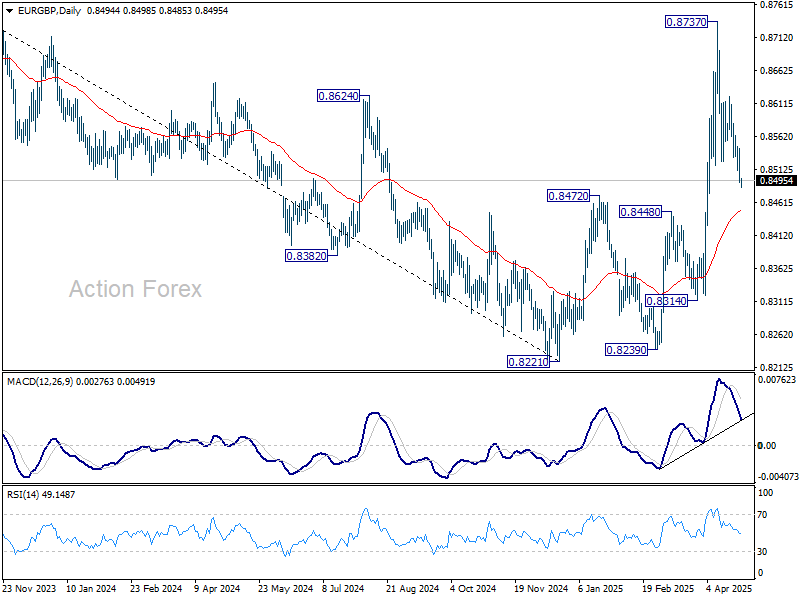
EUR/GBP Daily Outlook
Daily Pivots: (S1) 0.8478; (P) 0.8512; (R1) 0.8529; More...
EUR/GBP's break of 0.8737 suggests that deeper pullback is underway. Intraday bias is back on the downside for 55 D EMA (now at 0.8448). Sustained break there will argue that whole rebound from 0.8221 has completed and turn near term outlook bearish. On the upside, though, break of 0.8622 resistance will bring retest of 0.8737.
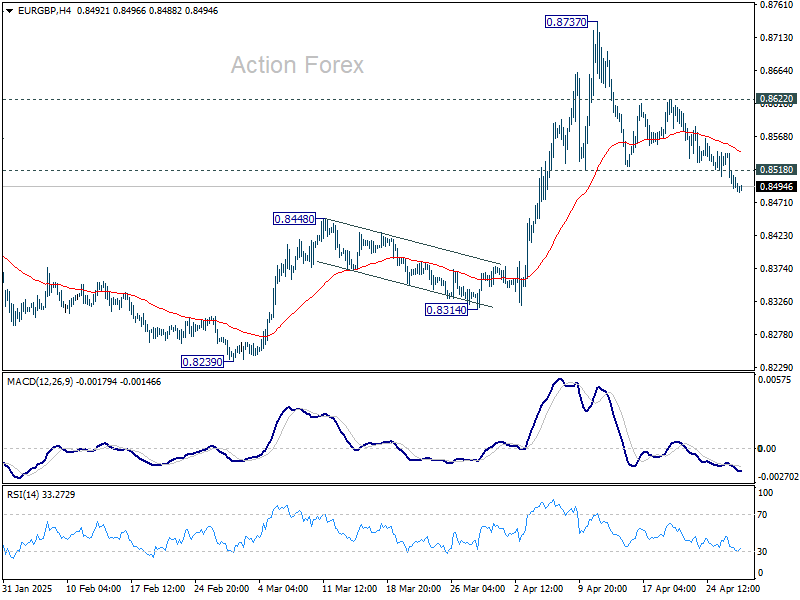
In the bigger picture, down trend from 0.9267 (2022 high) should have completed at 0.8221, just ahead of 0.9201 key support (2024 low). Rise from 0.8221 is likely reversing the whole fall. Further rise should be seen to 61.8% retracement of 0.9267 to 0.8221 at 0.8867 next. This will remain the favored case as long as 0.8472 resistance turned support holds.
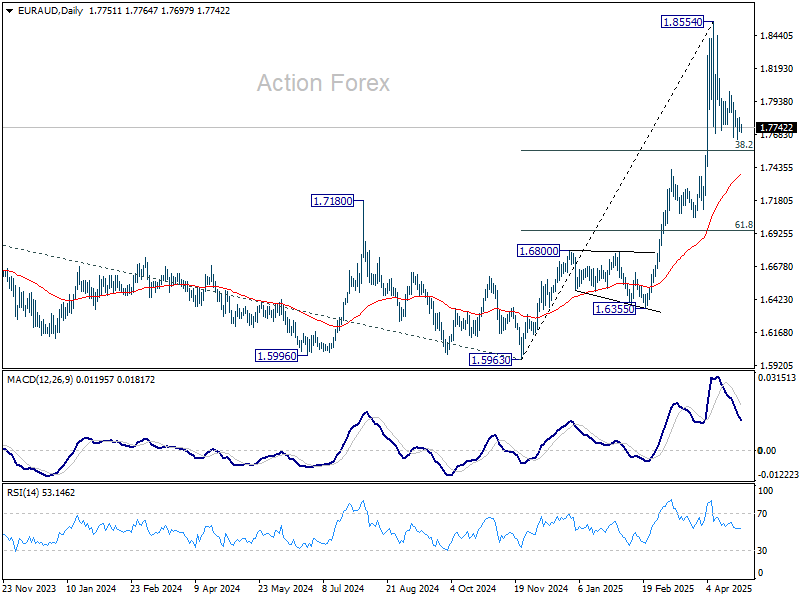
EUR/AUD Daily Outlook
Daily Pivots: (S1) 1.7705; (P) 1.7762; (R1) 1.7811; More...
Intraday bias in EUR/AUD remains neutral at this point. Corrective pattern from 1.8554 could extend, but downside should be contained by 38.2% retracement of 1.5963 to 1.8854 at 1.7750. On the upside, above 1.8014 minor resistance will bring retest of 1.8554 first. Firm break there will resume larger up trend. However, firm break of 1.7750 will bring deeper fall to 55 D EMA (now at 1.7382).
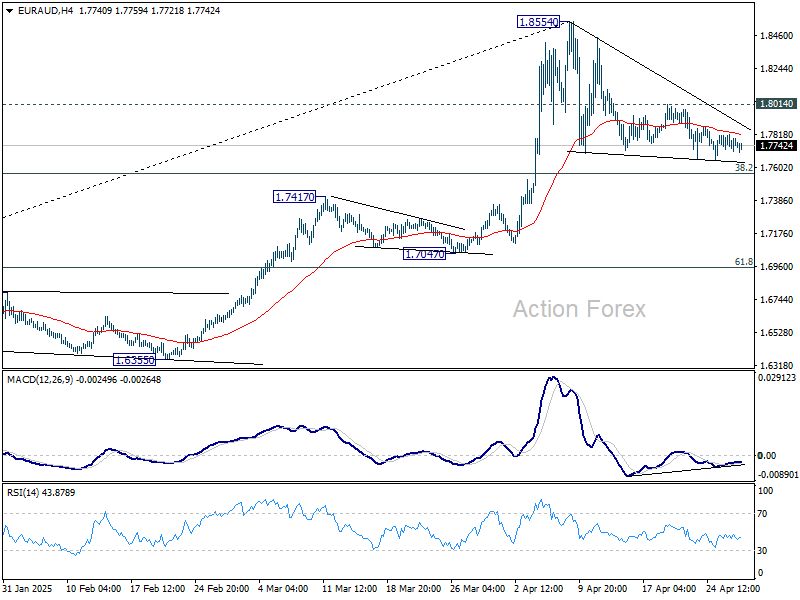
In the bigger picture, up trend from 1.4281 (2022 low) is in progress for 100% projection of 1.4281 to 1.7062 from 1.5963 at 1.8744. Firm break there will pave the way to 138.2% projection at 1.9806, which is close to 1.9799 (2020 high). Outlook will remain bullish as long as 1.7062 resistance turned support (2023 high) holds even in case of deep pullback.
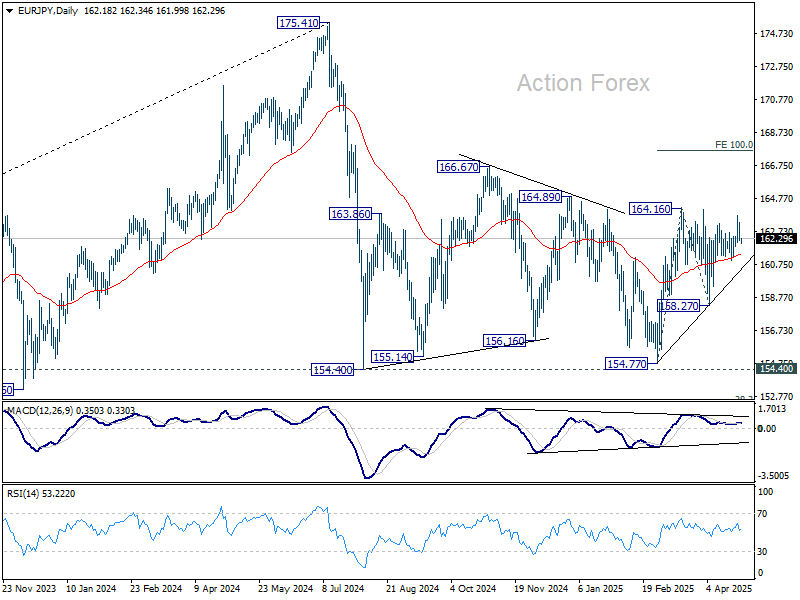
EUR/JPY Daily Outlook
Daily Pivots: (S1) 162.27; (P) 163.01; (R1) 164.02; More...
Intraday bias in EUR/JPY remains neutral and outlook is unchanged. On the upside, firm break of 164.16 will resume whole rise from 154.77. Next target will be 100% projection of 154.77 to 164.16 from 158.27 at 167.66. However, break of 158.27 will bring deeper fall back to 154.40/77 support zone.
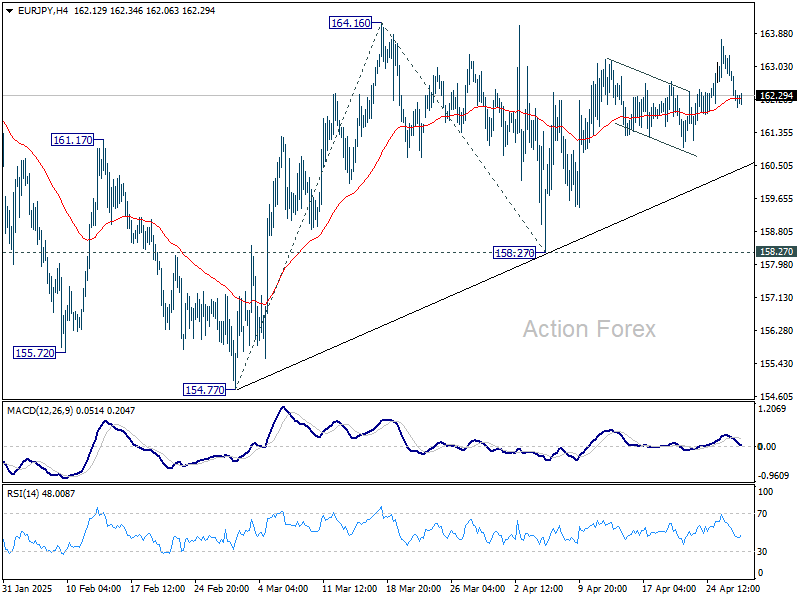
In the bigger picture, price actions from 175.41 are seen as correction to rally from 114.42 (2020 low). Strong support should be seen from 38.2% retracement of 114.42 to 175.41 at 152.11 to contain downside. However, sustained break of 152.11 will bring deeper fall even still as a correction.
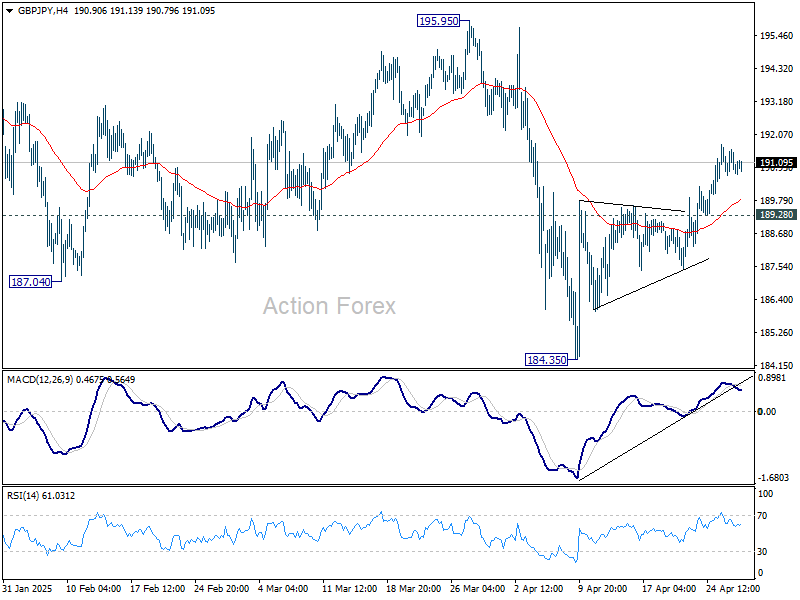
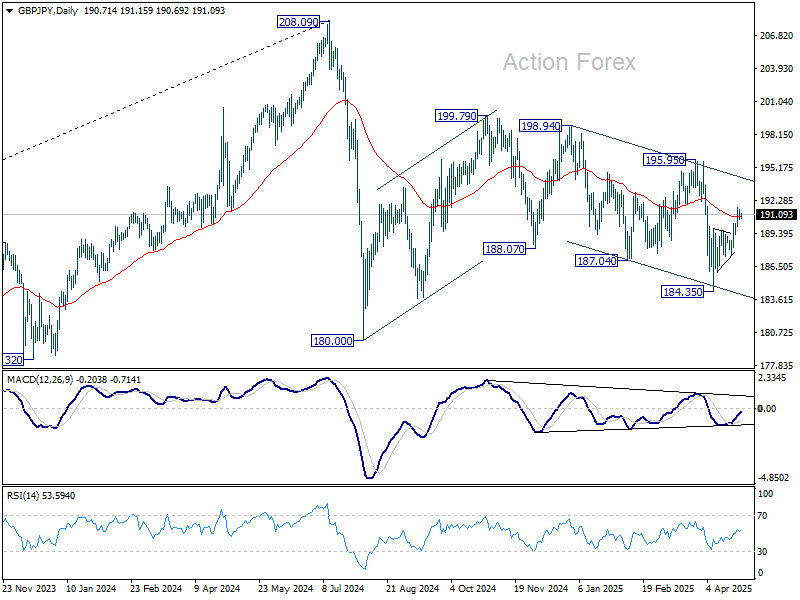
GBP/JPY Daily Outlook
Daily Pivots: (S1) 190.53; (P) 191.04; (R1) 191.43; More...
Further rise remains mildly in favor in GBP/JPY as long as 189.28 minor support holds. Rebound from 184.35 would target 195.95 resistance next. However, break of 189.28 will suggest that the rebound has completed and turn bias back to the downside.
In the bigger picture, price actions from 208.09 are seen as a correction to rally from 123.94 (2020 low). Strong support should be seen from 38.2% retracement of 123.94 to 208.09 at 175.94 to contain downside. However, sustained break of 175.94 will bring deeper fall even still as a correction.
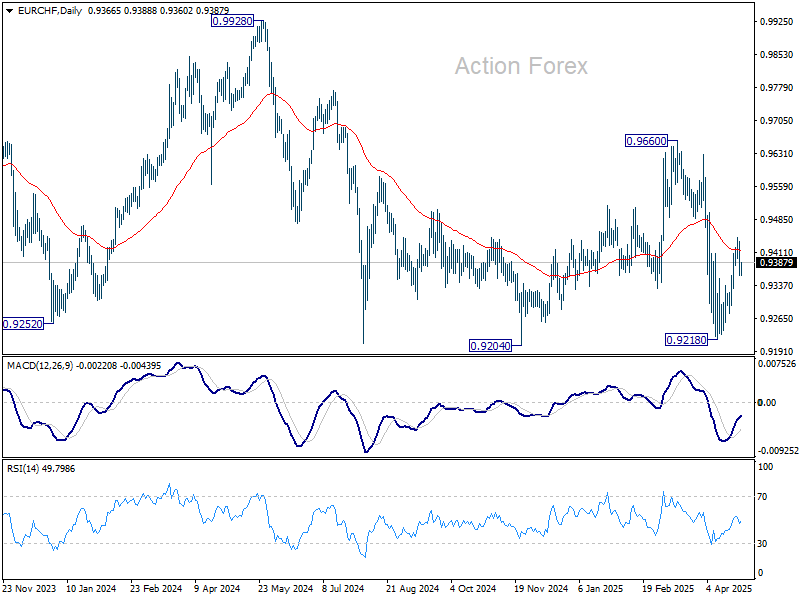
EUR/CHF Daily Outlook
Daily Pivots: (S1) 0.9340; (P) 0.9389; (R1) 0.9415; More....
Intraday bias in EUR/CHF remains neutral for the moment. Rebound from 0.9218 is either a corrective move, or the third leg of the pattern from 0.9204. Break of 0.9445 will resume the rebound towards 0.9660 resistance. However, on the downside, break of 0.9336 will bring retest of 0.9204/18 support zone.
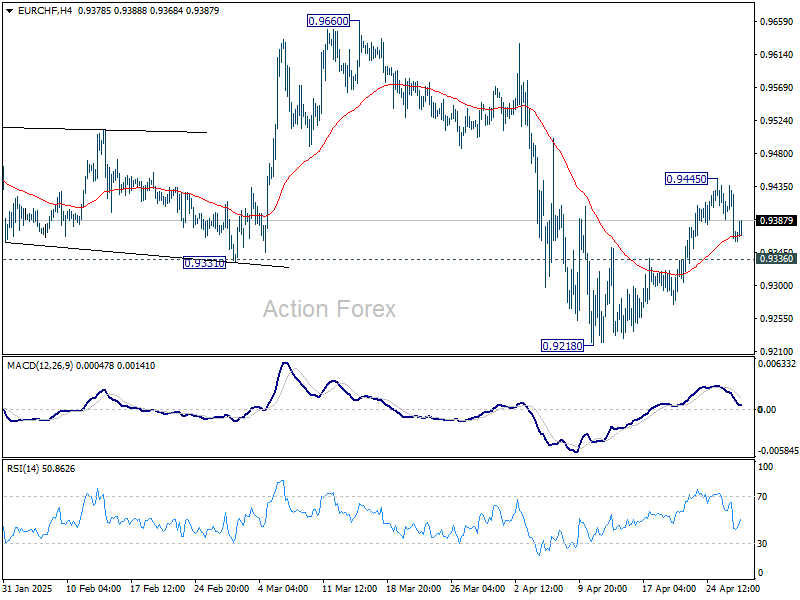
In the bigger picture, prior rejection by long-term falling channel resistance (now at 0.9555) retains medium term bearishness. That is, down trend from 1.2004 (2018 high) is still in progress. Firm break of 0.9204 (2024 low) will confirm resumption. This will remain the favored case as long as 0.9660 resistance holds.
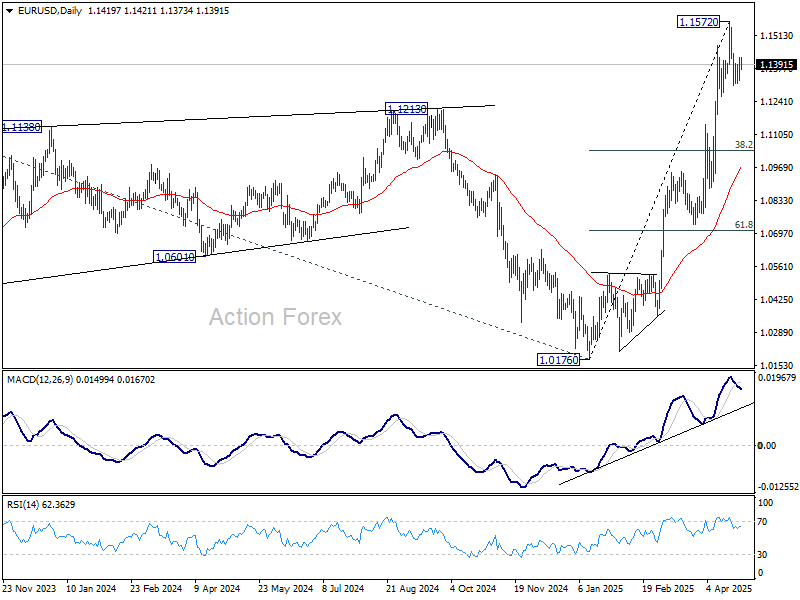
EUR/USD Daily Outlook
Daily Pivots: (S1) 1.1358; (P) 1.1391; (R1) 1.1454; More...
Intraday bias in EUR/USD is turned neutral first. On the downside,, break of 1.1306 will extend the correction from 1.1572. But strong support should be seen from 38.2% retracement of 1.0176 to 1.1572 at 1.1039 to contain downside. On the upside, break of 1.1572 will resume larger up trend.
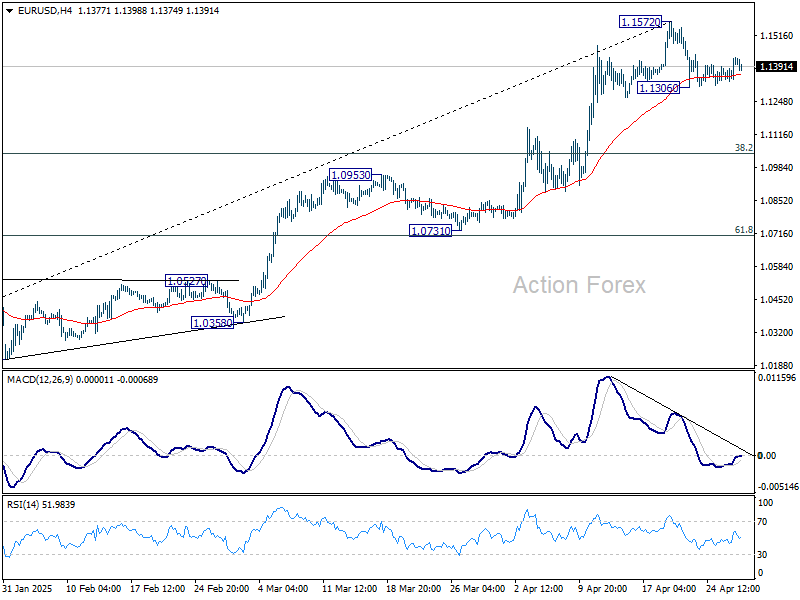
In the bigger picture, rise from 0.9534 long term bottom could be correcting the multi-decade downtrend or the start of a long term up trend. In either case, further rise should be seen to 100% projection of 0.9534 to 1.1274 from 1.0176 at 1.1916. This will now remain the favored case as long as 55 W EMA (now at 1.0792) holds.