Sample Category Title
Risk Sentiment Sours on US GDP Contraction, Recession Fears Mount
Risk sentiment soured as US session commenced after data showed the economy unexpectedly contracted in the first quarter. Although the decline was heavily influenced by a surge in imports, which mechanically subtract from GDP calculations, the result still serves as a stark reminder that economic momentum was already faltering even before the full impact of President Donald Trump's reciprocal tariffs in April
The weak GDP print has reignited recession fears, and a downturn may have already begun. This narrative is also supported by poor ADP employment report. Attention now turns squarely to Friday’s non-farm payroll data. A meaningful uptick in the unemployment rate or significant weakness in job creation would ring alarm bells for the administration, investors, and Fed alike. W
In currency markets, the initial reaction has seen a mild shift toward Dollar, which is currently the strongest performer of the day, followed by the Loonie and Swiss Franc. On the other side, Yen, Sterling, and Kiwi are underperforming. However, these rankings remain fluid and may change quickly depending on how risk sentiment evolves in the coming sessions.
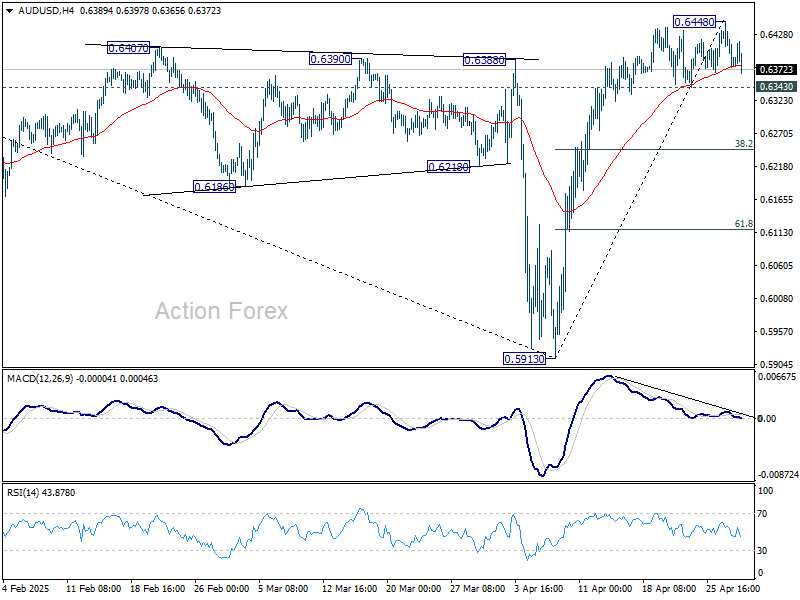
Technically, a focus is now on AUD/USD. Break of 0.6343 support, following broader risk aversion, will confirm short term topping at 0.6448. Deeper decline should then be seen to 38.2% retracement of 0.5913 to 0.6448 at 0.6244. Further break there will target 61.8% retracement at 0.6117.
In Europe, at the time of writing, FTSE is down -0.28%. DAX is down -0.37%. CAC is down -0.19%. UK 10-year yield is down -0.035 at 4.446. Germany 10-year yield is down -0.04 at 2.459. Earlier in Asia, Nikkei rose 0.57%. Hong Kong HSI rose 0.51%. China Shanghai SSE fell -0.23%. Singapore Strait Times rose 0.72%. Japan 10-year JGB yield closed flat at 1.315.
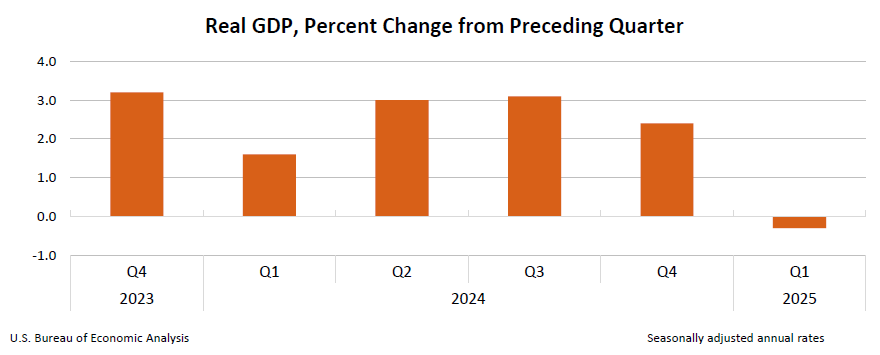
US GDP shrinks -0.3% annualized in Q1, price pressures building up
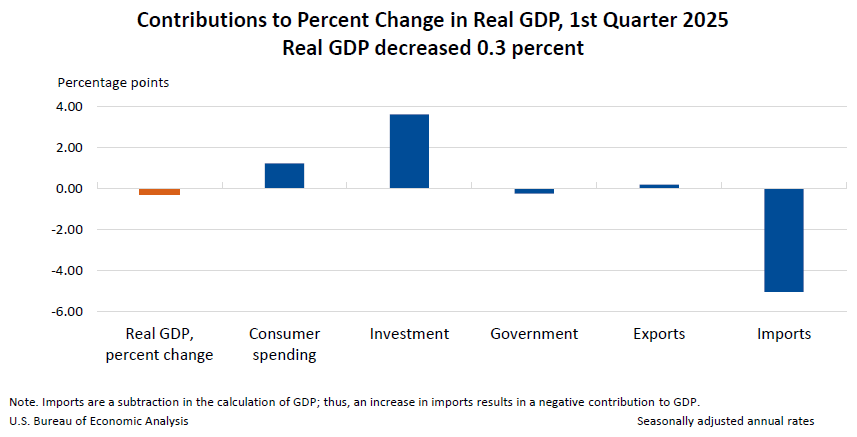
The US economy unexpectedly contracted in the Q1, with GDP shrinking at an annualized rate of -0.3%, marking the first decline since Q2 2022 and falling well short of expectations for modest 0.4% growth.
The surprise contraction was driven by a surge in imports and a pullback in government spending, which more than offset gains in investment, consumer spending, and exports.
Compounding the disappointing headline figure, inflation pressures showed renewed strength. The GDP price index jumped to 3.7% yoy, significantly above the 3.1% yoy forecast and accelerating from 2.3% yoy in Q4.
US ADP jobs rise just 62k in Apr, well below expectations
US ADP private sector employment rose by just 62k in April, sharply missing expectations of a 130k increase and marking a notable slowdown in hiring.
Gains were split between goods-producing industries, which added 26k jobs, and service-providing sectors, which contributed 34k. By establishment size, medium-sized firms led with 40k new jobs, while small and large businesses added 11k and 12k, respectively.
Pay trends were mixed. Job-stayers saw wage growth slow slightly to 4.5% yoy. Job-changers experienced an uptick in pay increases from 6.7% yoy to 6.9% yoy.
ADP Chief Economist Nela Richardson described the tone as one of "unease," as employers balance strong economic signals against growing uncertainty tied to fiscal policy and consumer sentiment.
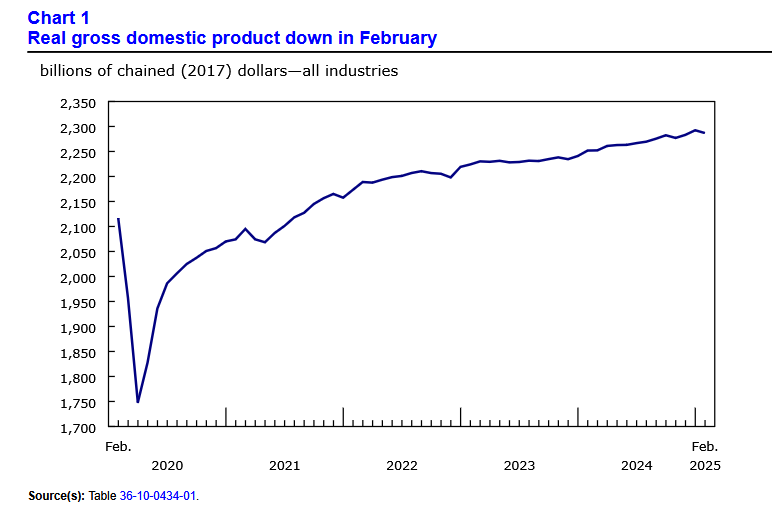
Canada's GDP contracts -0.2% mom in Feb, weakness broad-based across sectors
Canada's economy unexpectedly shrank by -0.2% mom in February, missing expectations of flat growth, as a broad-based downturn weighed on output.
Goods-producing sectors led the decline with a -0.6% mom drop, particularly from mining, quarrying, and oil and gas extraction, as well as construction.
Sservices sector also edged lower by -0.1% mom, dragged down by transportation, warehousing, and real estate
12 out of 20 industrial sectors posting declines.
Looking ahead, preliminary data suggests a modest rebound of 0.1% mom in March, led by gains in mining, retail trade, and transportation.
Eurozone GDP beats expectation of 0.4% qoq growth, EU up 0.3% qoq
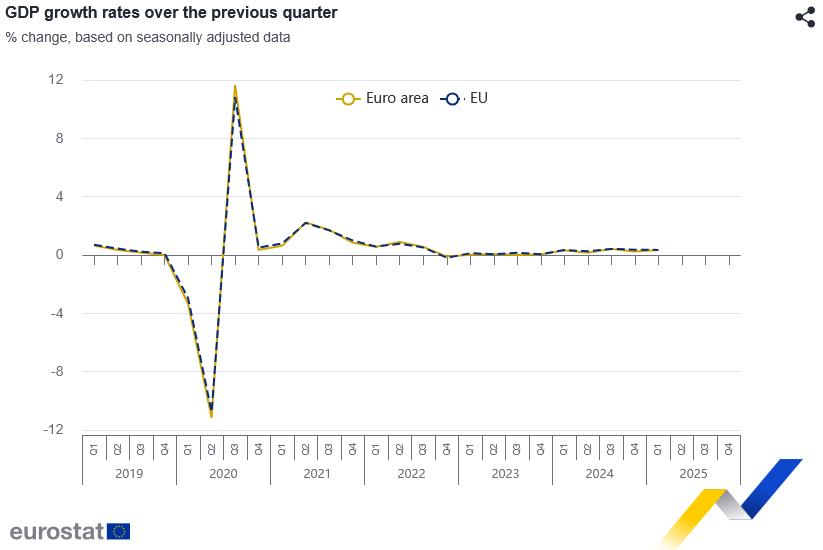
Eurozone GDP expanded by 0.4% qoq in Q1, doubling market expectations of 0.2% and signaling a stronger-than-anticipated start to the year. Across the broader EU, GDP rose by 0.3% qoq.
On a year-on-year basis, seasonally adjusted GDP grew 1.2% in the Eurozone and 1.4% in the EU, matching growth rates from the previous quarter.
Ireland led the regional performance with a sharp 3.2% quarterly increase, followed by Spain and Lithuania with 0.6% growth. Hungary was the only member state to post a quarterly contraction, down -0.2%.
Swiss KOF falls to 97.1, outlook considerably subdued
The Swiss KOF Economic Barometer slumped to 97.1 in April, down sharply from 103.9 and well below the expected 102.0, marking its first drop below the medium-term average this year.
The KOF Swiss Economic Institute noted that the outlook for the Swiss economy is now “considerably subdued,” as broad-based weakness weighed on the indicator.
According to KOF, the sharp deterioration was primarily driven by a significant setback in manufacturing sentiment, with additional pressure seen across the hospitality and broader services sectors. Financial and insurance services were the only areas showing relative stability.
Australia's trimmed mean CPI returns to RBA's target band, services inflation eases further
Australia's headline CPI was unchanged at 2.4% yoy in Q1, above expectations of a slight decline to 2.2% yoy. On a quarterly basis, CPI rose 0.9% qoq, also exceeding forecast of 0.8% qoq.
The closely watched trimmed mean CPI, a core inflation gauge, slowed from 3.3% yoy to 2.9% yoy , falling back within RBA’s 2–3% target range for the first time since 2021, in line with market expectations. However, the quarterly increase of 0.7% qoq was a touch higher than the anticipated 0.6% qoq.
Annual goods inflation accelerated from 0.8% yoy to 1.3% yoy, driven by a notable rebound in electricity prices. Services inflation eased from 4.3% yoy to 3.7% yoy, its lowest since mid-2022, amid broad-based moderation in rent and insurance costs.
NZ ANZ business confidence falls to 49.3, inflation expectations steady
New Zealand's ANZ Business Confidence fell sharply in April, dropping from 57.5 to 49.3. The own activity outlook also edged lower from 48.6 to 47.7.
ANZ noted the decline may reflect growing apprehension over the global economic outlook, particularly uncertainty stemming from the escalating US-China trade war and broader policy unpredictability from the US administration.
Cost expectations three months ahead surged from 74.1 to 77.9, the highest level since September 2023. This contrasts with a slight dip in pricing intentions, which eased from 51.3 to 49.4. Inflation expectations one year out remained largely steady at 2.65%.
Japan’s industrial output slides -1.1% mom on auto weakness
Japan’s industrial production fell by -1.1% mom in March, significantly worse than the anticipated -0.7% mom decline.
According to the Ministry of Economy, Trade and Industry, the sharp drop was led by a -5.9% mom fall in motor vehicle output. Notably, regular passenger car production slipped -4.1% mom due to weaker export demand, while small vehicle output plunged -23.2% mom, reflecting disruptions in auto parts supply chains.
The slump in production comes against the backdrop of rising trade tensions, with US President Donald Trump imposing a 25% tariff on car and truck imports and a sweeping 24% tariff on all Japanese goods, later temporarily reduced to 10%.
Japanese manufacturers surveyed by METI project a recovery ahead, with output expected to rise 1.3% mom in April and 3.9% mom in May. But ministry officials remain cautious. “The environment surrounding production remains highly uncertain,” a METI representative warned, adding that manufacturers are clearly worried about the impact of US tariffs, though no changes to production plans have been formally announced yet.
Also released, retail sales rose 3.1% yoy in March, below expectations of 3.6%. Still, the result marks the 37th consecutive month of gains, indicating that domestic consumption has yet to show significant signs of stress.
China's factory activity slumps on trade conflicts, optimism near record lows
China’s factory activity slumped sharply in April as official NBS Manufacturing PMI dropped from 50.5 to 49.0, its lowest level since December 2023 and below expectations of 49.9. Non-manufacturing PMI also weakened from 50.8 to 50.4.
The decline points to early signs of strain from escalating trade tensions, with NBS citing “sharp changes in the external environment” as a key driver.
Private-sector data painted a similarly cautious picture. Caixin Manufacturing PMI dropped to 50.4, its lowest in three months and just narrowly remaining in expansion.
Caixin's Senior Economist Wang Zhe noted that while production and demand grew modestly, the pace has slowed and forward-looking optimism weakened significantly—plunging to the third-lowest level ever recorded. Trade-related uncertainty was a key concern for firms, weighing heavily on sentiment despite hopes for more policy support.
The April PMIs point to early-stage fallout from the China-US tariff standoff. Businesses are already reporting shrinking employment, delayed logistics, and inventory drawdowns. With both consumer and business confidence faltering, the government faces growing pressure to deploy stimulus measures. Unless domestic demand recovers and external risks subside, China’s economy could face more headwinds in Q2 and beyond.
EUR/USD Mid-Day Outlook
Daily Pivots: (S1) 1.1362; (P) 1.1394; (R1) 1.1418; More...
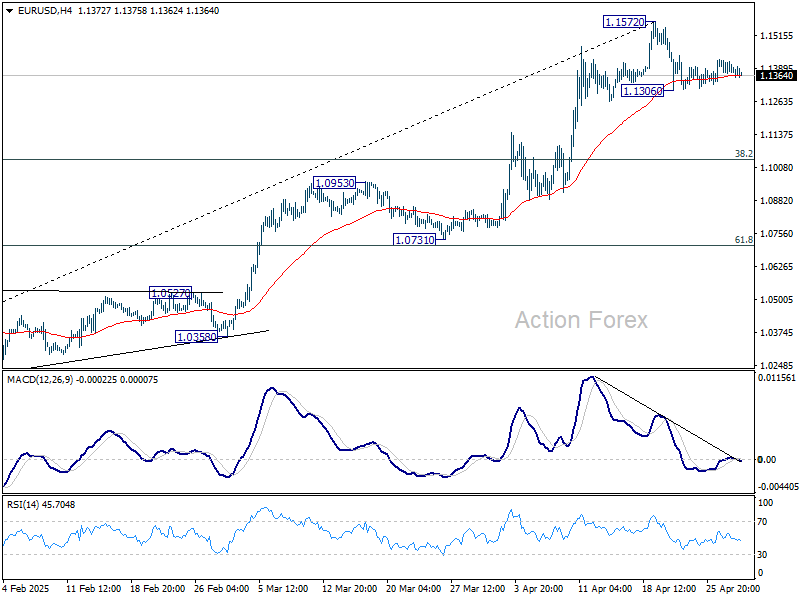
EUR/USD is still bounded in tight range and intraday bias stays neutral. On the downside, break of 1.1306 will extend the correction from 1.1572. But strong support should be seen from 38.2% retracement of 1.0176 to 1.1572 at 1.1039 to contain downside. On the upside, break of 1.1572 will resume larger up trend.
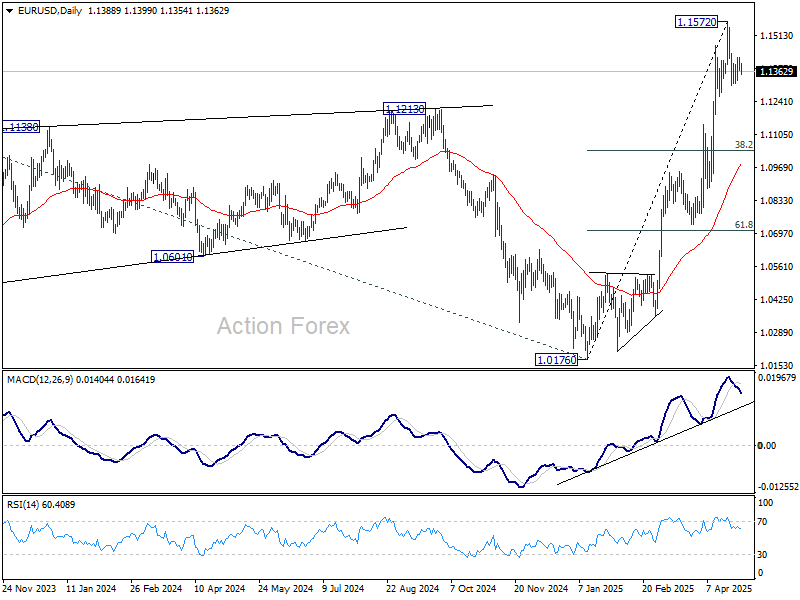
In the bigger picture, rise from 0.9534 long term bottom could be correcting the multi-decade downtrend or the start of a long term up trend. In either case, further rise should be seen to 100% projection of 0.9534 to 1.1274 from 1.0176 at 1.1916. This will now remain the favored case as long as 55 W EMA (now at 1.0792) holds.
Canada’s GDP contracts -0.2% mom in Feb, weakness broad-based across sectors
Canada's economy unexpectedly shrank by -0.2% mom in February, missing expectations of flat growth, as a broad-based downturn weighed on output.
Goods-producing sectors led the decline with a -0.6% mom drop, particularly from mining, quarrying, and oil and gas extraction, as well as construction.
Sservices sector also edged lower by -0.1% mom, dragged down by transportation, warehousing, and real estate
12 out of 20 industrial sectors posting declines.
Looking ahead, preliminary data suggests a modest rebound of 0.1% mom in March, led by gains in mining, retail trade, and transportation.
US GDP shrinks -0.3% annualized in Q1, price pressures building up
The US economy unexpectedly contracted in the Q1, with GDP shrinking at an annualized rate of -0.3%, marking the first decline since Q2 2022 and falling well short of expectations for modest 0.4% growth.
The surprise contraction was driven by a surge in imports and a pullback in government spending, which more than offset gains in investment, consumer spending, and exports.
Compounding the disappointing headline figure, inflation pressures showed renewed strength. The GDP price index jumped to 3.7% yoy, significantly above the 3.1% yoy forecast and accelerating from 2.3% yoy in Q4.
US ADP jobs rise just 62k in Apr, well below expectations
US ADP private sector employment rose by just 62k in April, sharply missing expectations of a 130k increase and marking a notable slowdown in hiring.
Gains were split between goods-producing industries, which added 26k jobs, and service-providing sectors, which contributed 34k. By establishment size, medium-sized firms led with 40k new jobs, while small and large businesses added 11k and 12k, respectively.
Pay trends were mixed. Job-stayers saw wage growth slow slightly to 4.5% yoy. Job-changers experienced an uptick in pay increases from 6.7% yoy to 6.9% yoy.
ADP Chief Economist Nela Richardson described the tone as one of "unease," as employers balance strong economic signals against growing uncertainty tied to fiscal policy and consumer sentiment.
Australian Core CPI Falls Within RBA Target, Aussie Shrugs
The Australian dollar has been showing strong movement this week but is calm on Wednesday. In the European session, AUD/USD is trading at 0.6391, up 0.14% on the day.
Australian core CPI falls to 2.9%
Australia released the CPI report for the first quarter. The Australian dollar didn't show much reaction, but the data could point to another rate cut from the Reserve Bank of Australia.
Headline CPI remained unchanged at 2.4% y/y, just above the market estimate of 2.3%. The significant news was that RBA Trimmed Mean CPI, the key core inflation indicator, dropped to 2.9% y/y from a revised 3.3% gain in Q4 2024. This is the first time in three years that core CPI is back within the RBA's target band of between 1-3%.
The drop in core inflation is good news for the government, with the national election on Saturday. Australian Treasurer Jim Chalmers jumped on the news, stating that the market expects four or five rate additional rate cuts this year, which would save households with mortgages "hundreds of dollars".
The Reserve Bank is expected to lower rates at its next meeting on May 20, which would mark only the second rate cut this year. After cutting rates in February, the central bank has stayed on the sidelines as US President Trump's tariffs have escalated trade tensions and sent the financial markets on a roller-coaster ride.
US employment, GDP expected to decelerate
In the US, the markets are bracing for some weak data later today. ADP employment is expected to slip to 108 thousand, compared to 155 thousand in the previous release. ADP is not considered a reliable gauge for Friday's nonfarm payrolls, but a weak reading will only increase the anxiety of the nervous markets.
US first-estimate GDP for Q1 is expected to slide to just 0.4% q/q, after a 2.4% gain in Q3. If there is a surprise reading from GDP, we could see a strong reaction from the US dollar after the release.
AUD/USD Technical
- AUD/USD is testing resistance at 0.6403. Above, there is resistance at 0.6431
- 0.6357 and 0.6329 are the next support levels

AUDUSD 1-Day Chart, April 30, 2025
Gold Probes Again Through Key Supports as Trade Tensions Ease
Gold price holds in red for the second consecutive day and probes again through key $3300/$3292 zone (psychological / Fibo 38.2% of $2956/$3500 rally), where several recent attacks failed.
The risk sentiment has weakened again on growing signs of de-escalation of US – China trade conflict (although still looking for confirmation that two sides are on the firm way to reach a final deal and ease tensions).
However, larger picture is unclear as many fear of strong negative impact on global economy from tariff war that continues to fuel safe haven demand, against hopes that two largest economies are on the right track to avoid disastrous scenario that would continue do deflate metal’s safe haven appeal.
Based on these theories, we can conclude that near-term action faces two strong and opposite forces, which could keep the price in extended consolidation, before establishing in fresh direction.
Triggers remain unchanged, with loss of $3300/$3292 to generate initial but strong negative signal, which will look for confirmation on extension below $3228 (50% retracement / 20DMA).
Alternatively, lift above 10DMA ($3337) to initially ease immediate downside risk, with extension above upper pivots at $3371 and $3400 (recent range tops / broken Fibo 23.6% / psychological) to indicate an end of corrective phase and formation of higher base.
Markets will look for more signals from US economic data (GDP, PCE, NFP) due this week.
Res: 3292; 3300; 3328; 3336.
Sup: 3260; 3245; 3228; 3200.

Crypto in Consolidation Mode
Market Picture
The crypto market remains in prolonged consolidation as it approaches the $3 trillion level, losing about 0.5% over the past day. For the past five days, the market has fluctuated in a very narrow range, with some tendency towards shallower declines. Still, it has been unable to exceed its 200-day moving average, which is now passing through $3.01 trillion. A global positive is needed for a breakout, but it would open the way to the $3.50 trillion area.
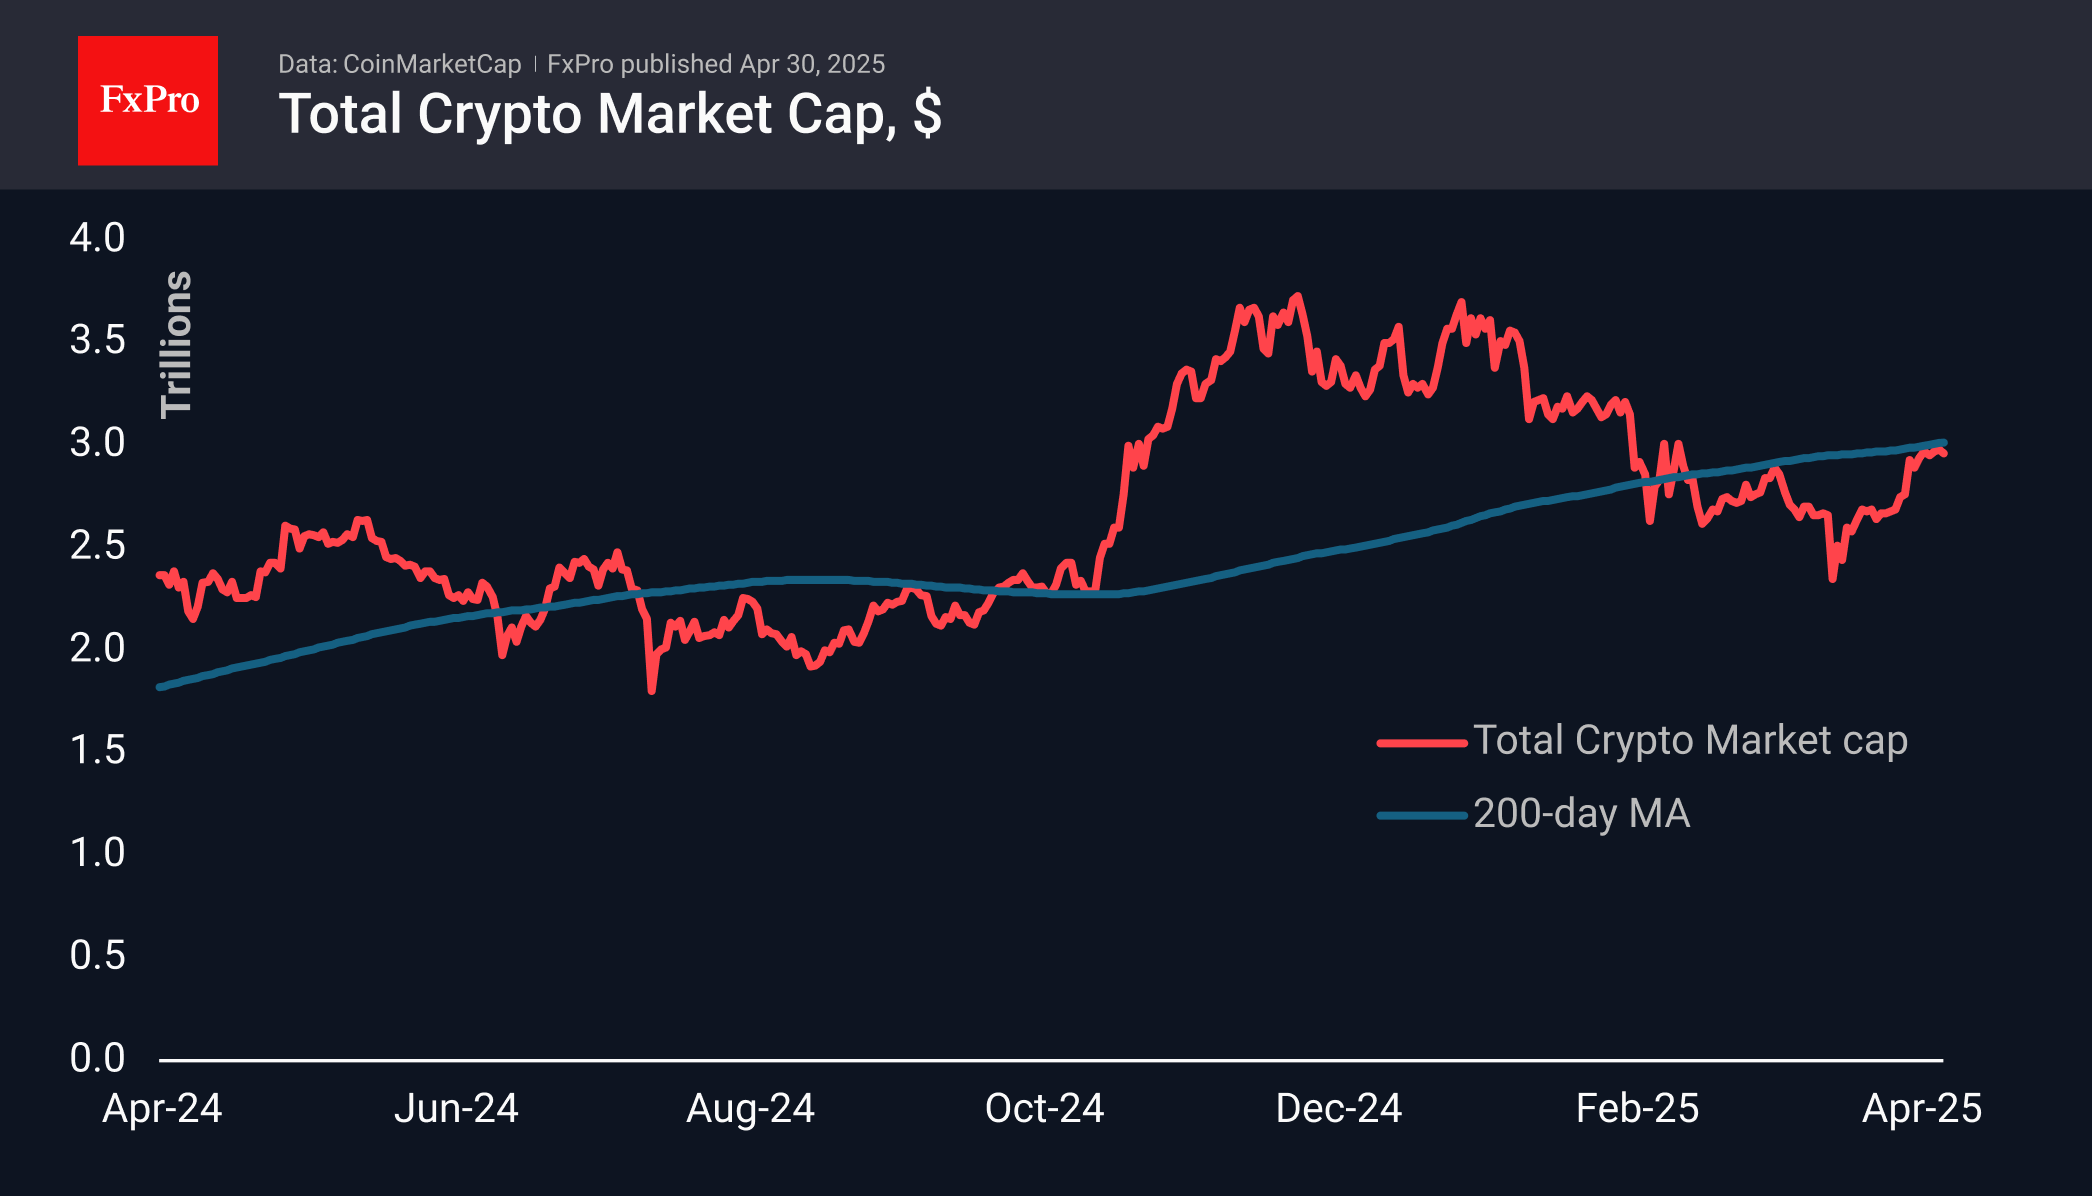
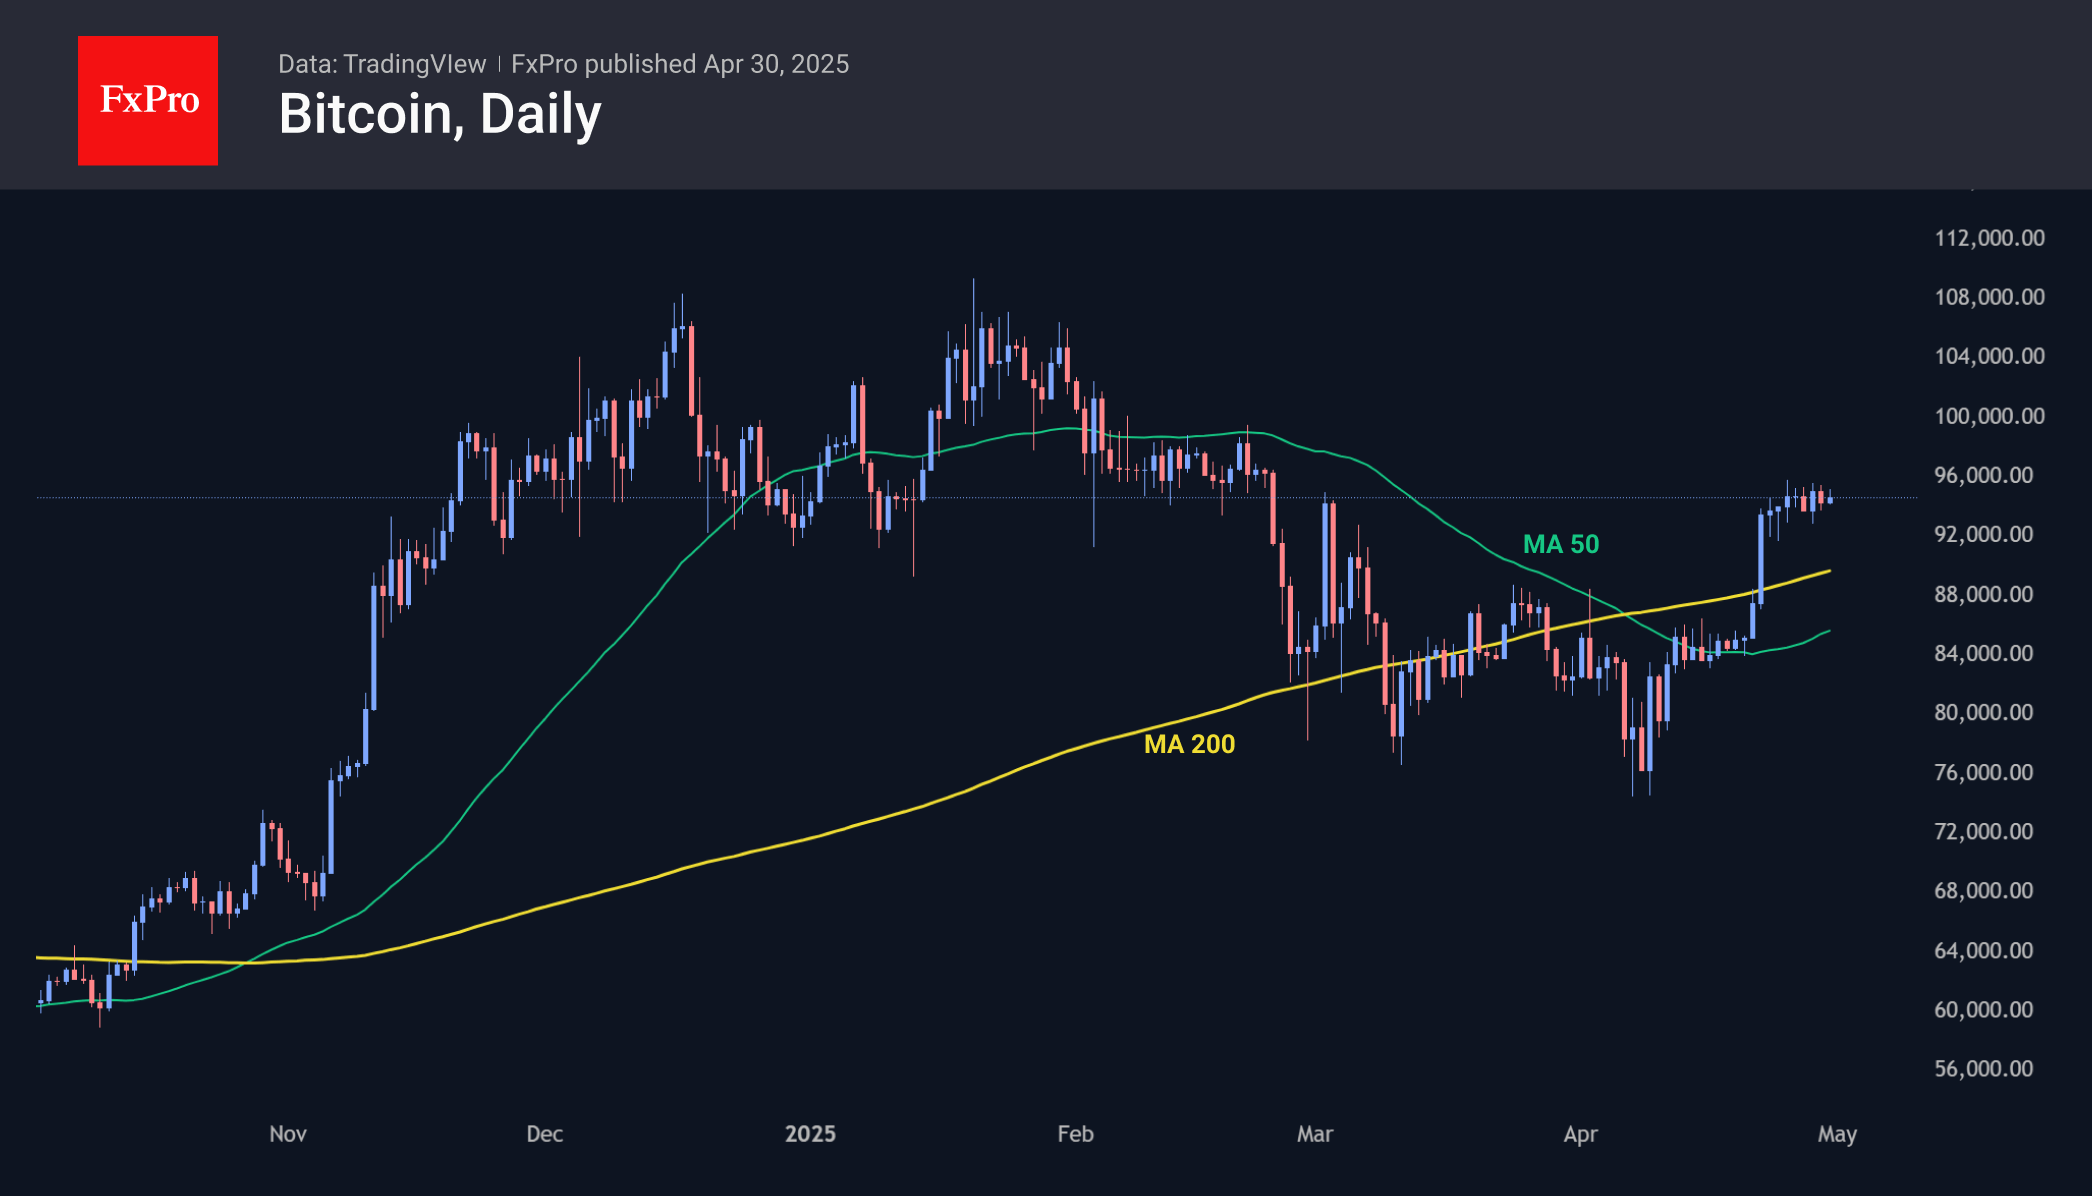
Bitcoin is hovering near $94,500, forcing the entire cryptocurrency market to watch for the next move. Such long consolidations usually accumulate strength for further movement. The next major trigger is likely to be Friday’s labour market data.
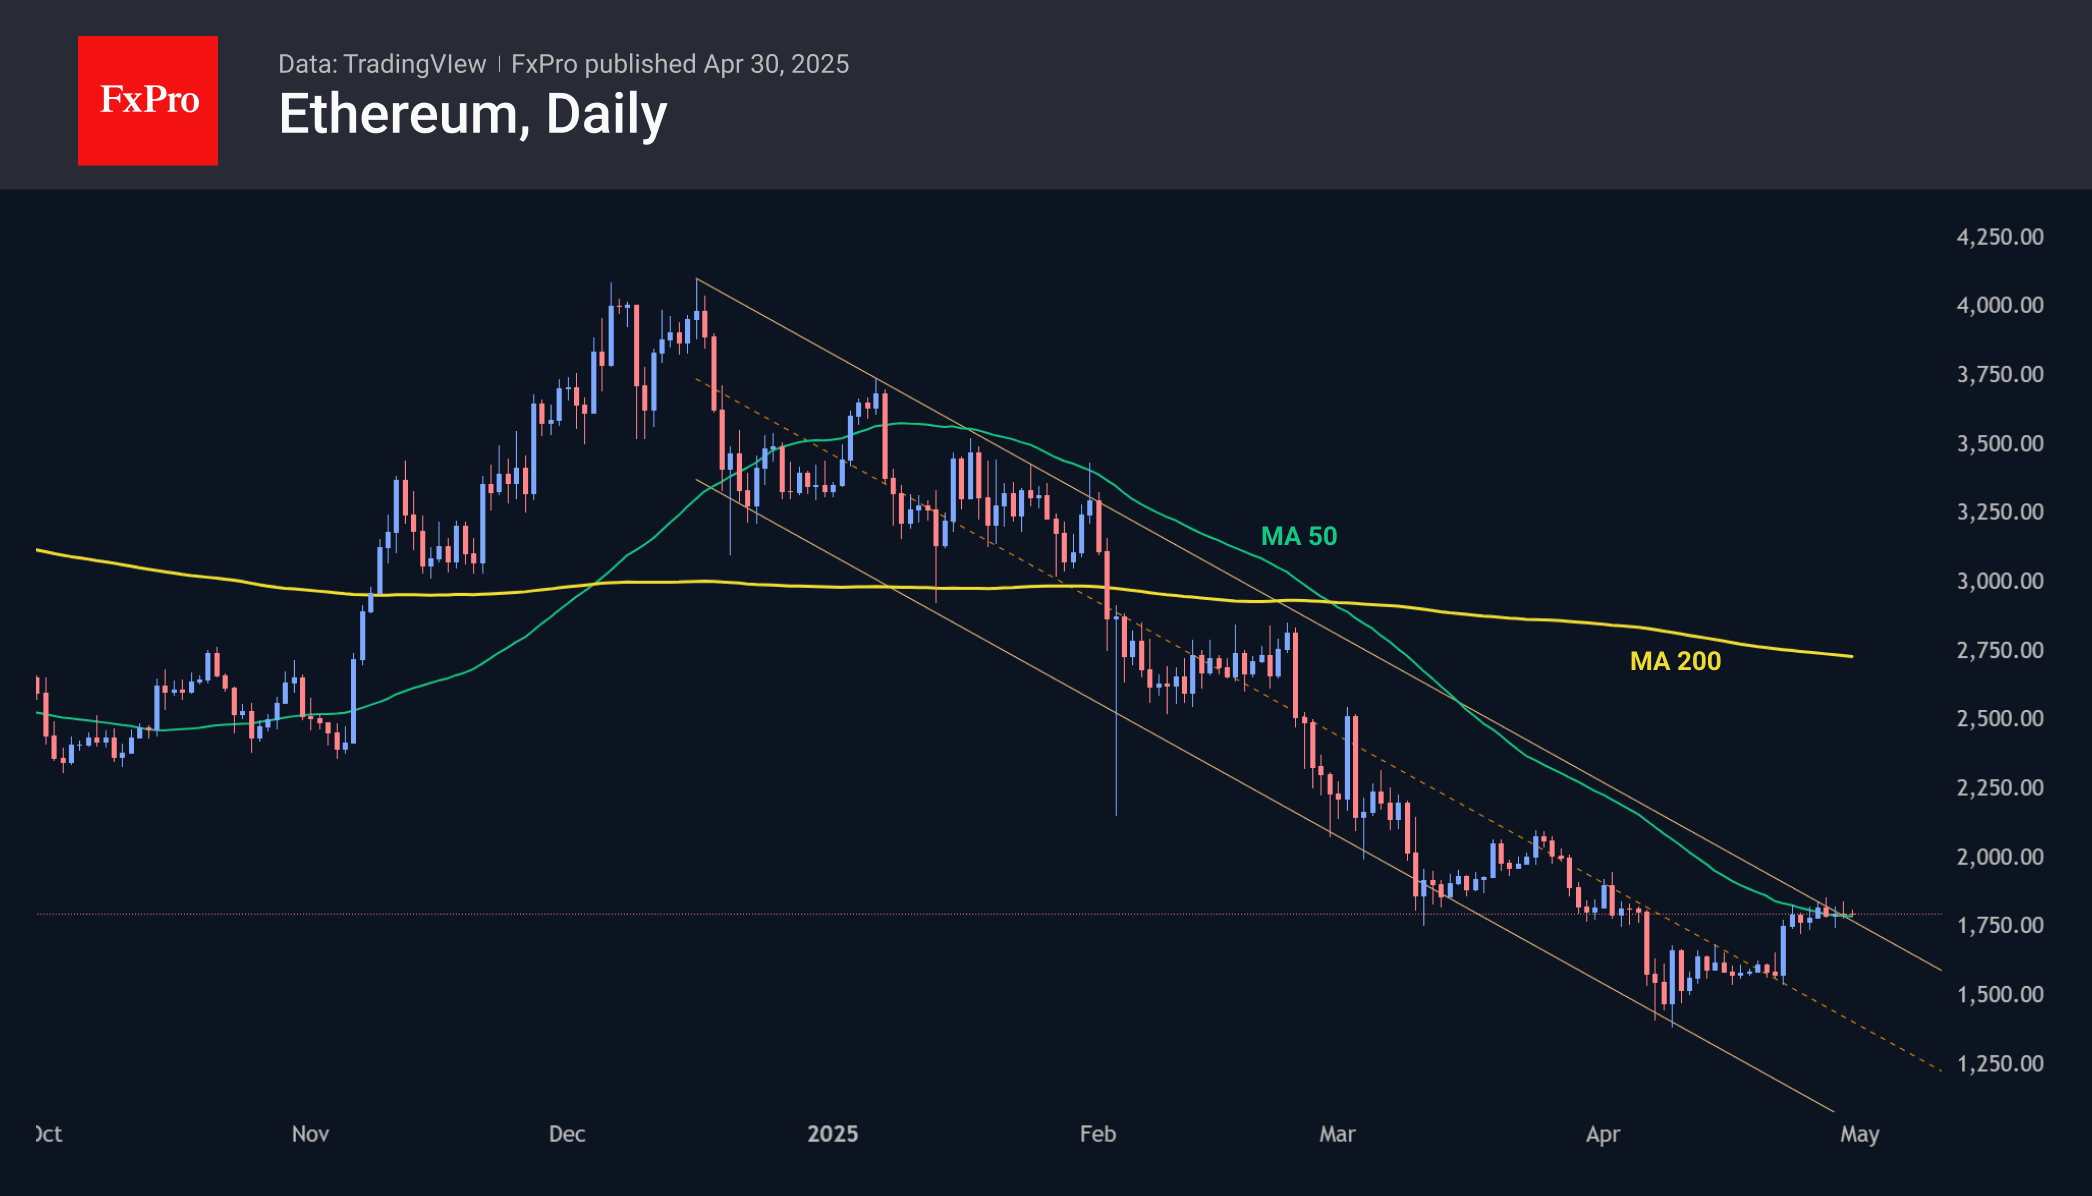
Ethereum continues to struggle with its downtrend, hovering around the $1,800 for the past seven days, right where the 50-day moving average and the resistance line of the descending channel converge.
An upward momentum would be an important positive signal, but theoretically, under these conditions, the baseline scenario is a downward reversal.
News Background
Presto Research predicts that Bitcoin will reach $210,000 by the end of this year. Growing institutional interest and rising global liquidity will be the primary drivers behind its price increase.
Bitwise believes that Bitcoin’s recent rise above $94,000 occurred with minimal participation from retail investors. The current rally has been initiated by institutional investors, financial advisors, corporations, and even governments. The list of investors buying BTC is expanding.
The growing share of bitcoins purchased at lower prices indicates that the rally is approaching a ‘historic level of euphoria,’ according to Darkfost, an analyst at CryptoQuant.
Crypto Caesar analyst believes that breaking through the psychological level of $100,000 will pave the way for Bitcoin to new all-time highs in the range of $110,000-115,000.
Eurozone GDP beats expectation of 0.4% qoq growth, EU up 0.3% qoq
Eurozone GDP expanded by 0.4% qoq in Q1, doubling market expectations of 0.2% and signaling a stronger-than-anticipated start to the year. Across the broader EU, GDP rose by 0.3% qoq.
On a year-on-year basis, seasonally adjusted GDP grew 1.2% in the Eurozone and 1.4% in the EU, matching growth rates from the previous quarter.
Ireland led the regional performance with a sharp 3.2% quarterly increase, followed by Spain and Lithuania with 0.6% growth. Hungary was the only member state to post a quarterly contraction, down -0.2%.
Japanese Yen Edges Lower as Weak Data Dampens Confidence
The USD/JPY pair is rising cautiously for a second consecutive day, reaching 142.48, as a string of underwhelming economic figures from Japan weighs on market sentiment.
Key factors driving USD/JPY Movement
March’s economic data revealed a larger-than-expected contraction in industrial production, while retail sales growth also fell short of forecasts. Collectively, these indicators point to potential challenges for Japan’s economy.
Market focus now shifts to the upcoming Bank of Japan (BoJ) meeting, where the central bank is widely expected to hold interest rates steady at 0.5%.
The BoJ’s commentary will likely remain cautious as policymakers assess the potential fallout from new US tariffs on Japan’s export-reliant economy.
In a recent development, US Treasury Secretary Scott Bessent noted that the Trump administration has extensively discussed a potential trade agreement with Japan – a sign that bilateral tensions may be easing.
Technical analysis: USD/JPY
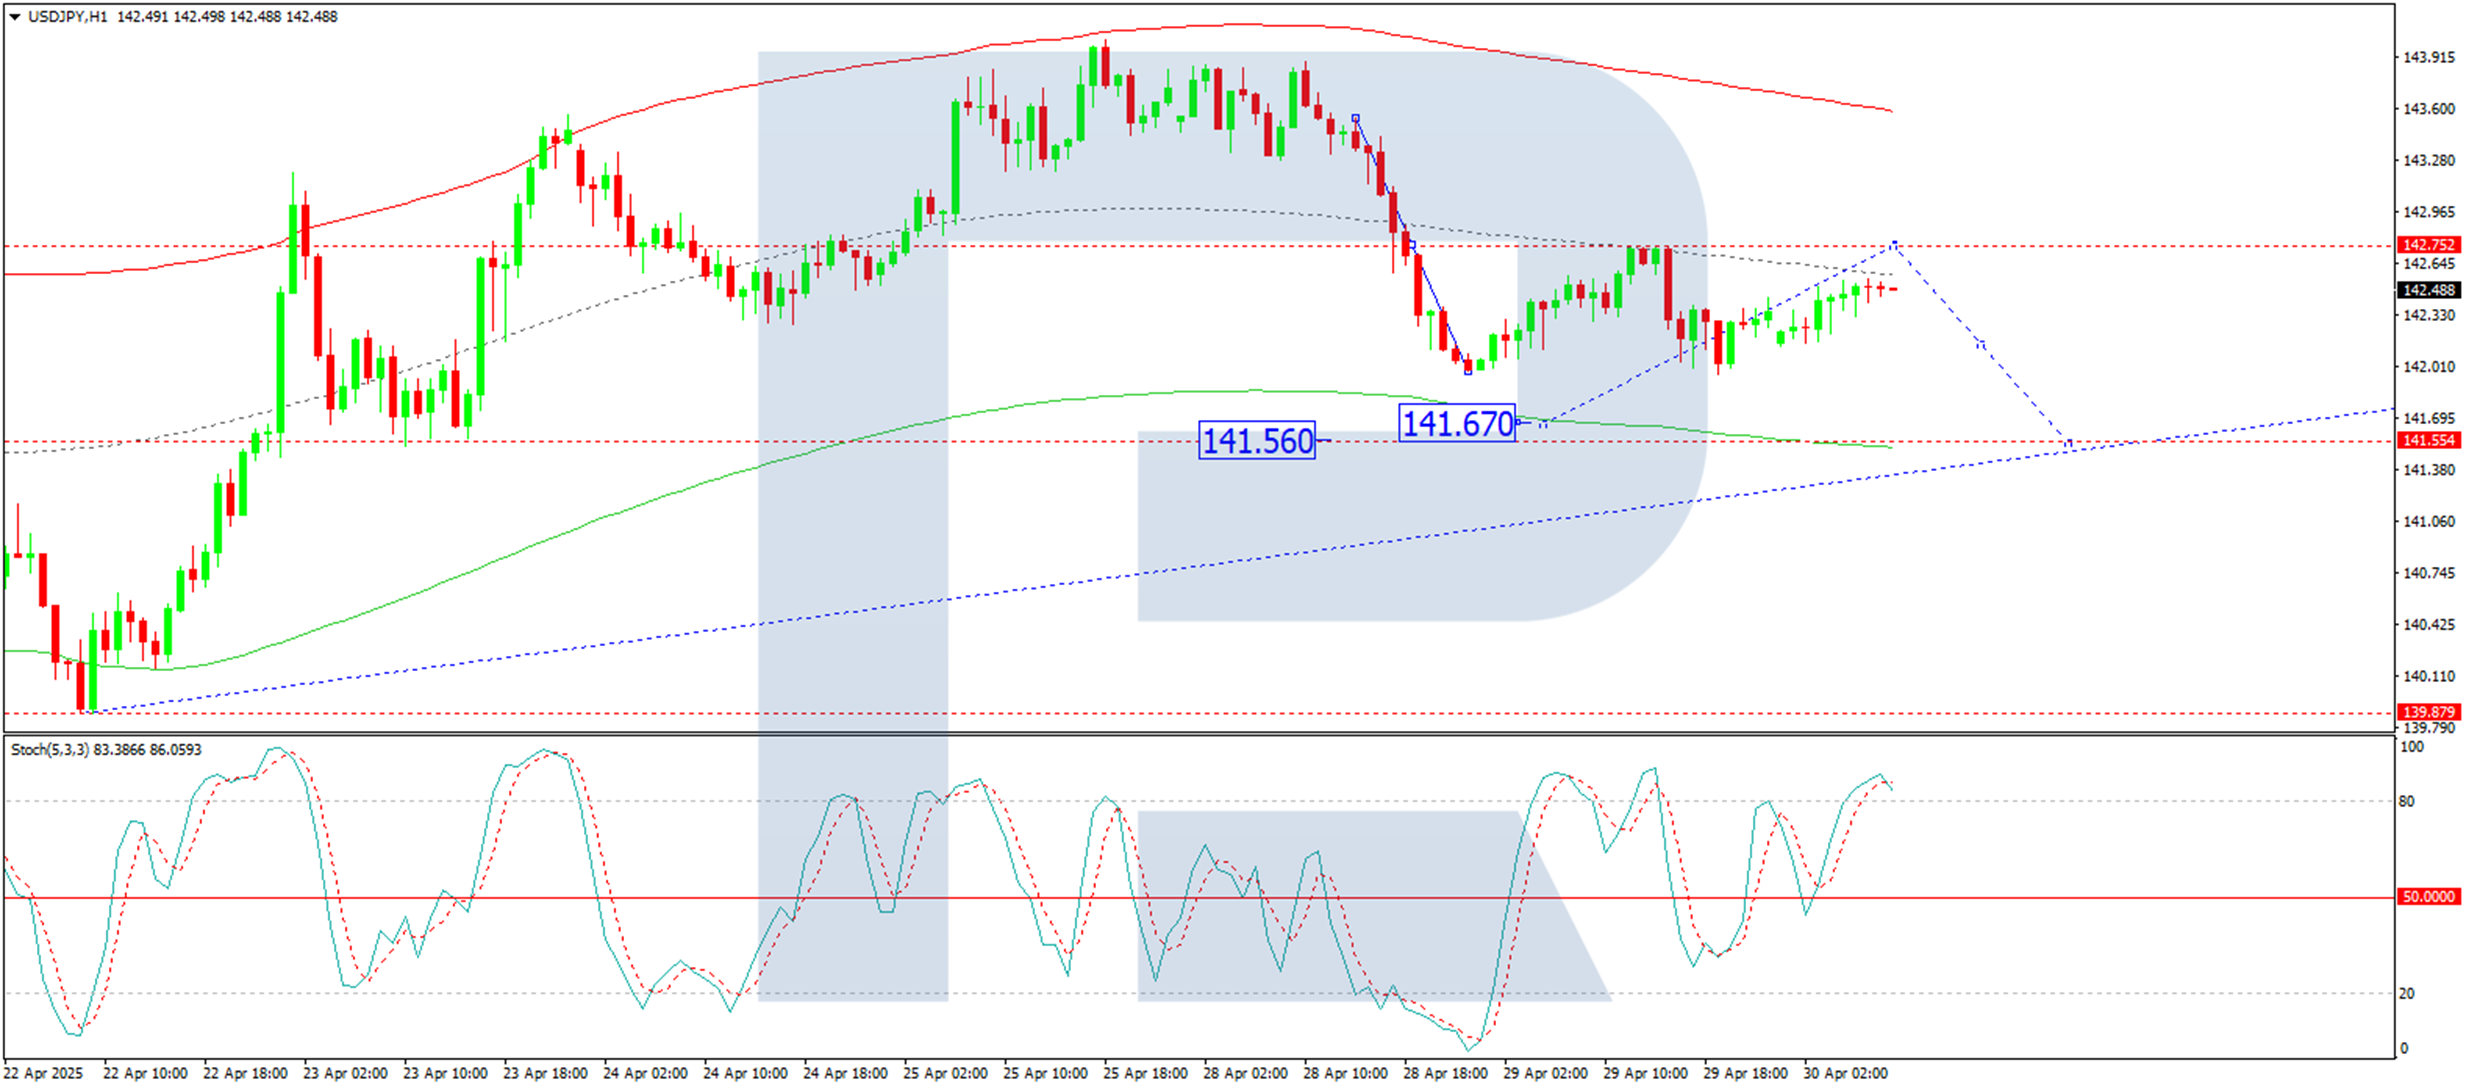
On the H4 chart, USDJPY has broken below the 142.75 level and continues to decline towards 141.56. This move is considered a correction within the broader upward trend. Once this correction ends, a new bullish wave towards 144.00 may begin. A breakout above 144.00 could pave the way for a further rise towards the local target of 146.40. Technically, this scenario is supported by the MACD indicator, as its signal line is below zero and sloping decisively downwards.
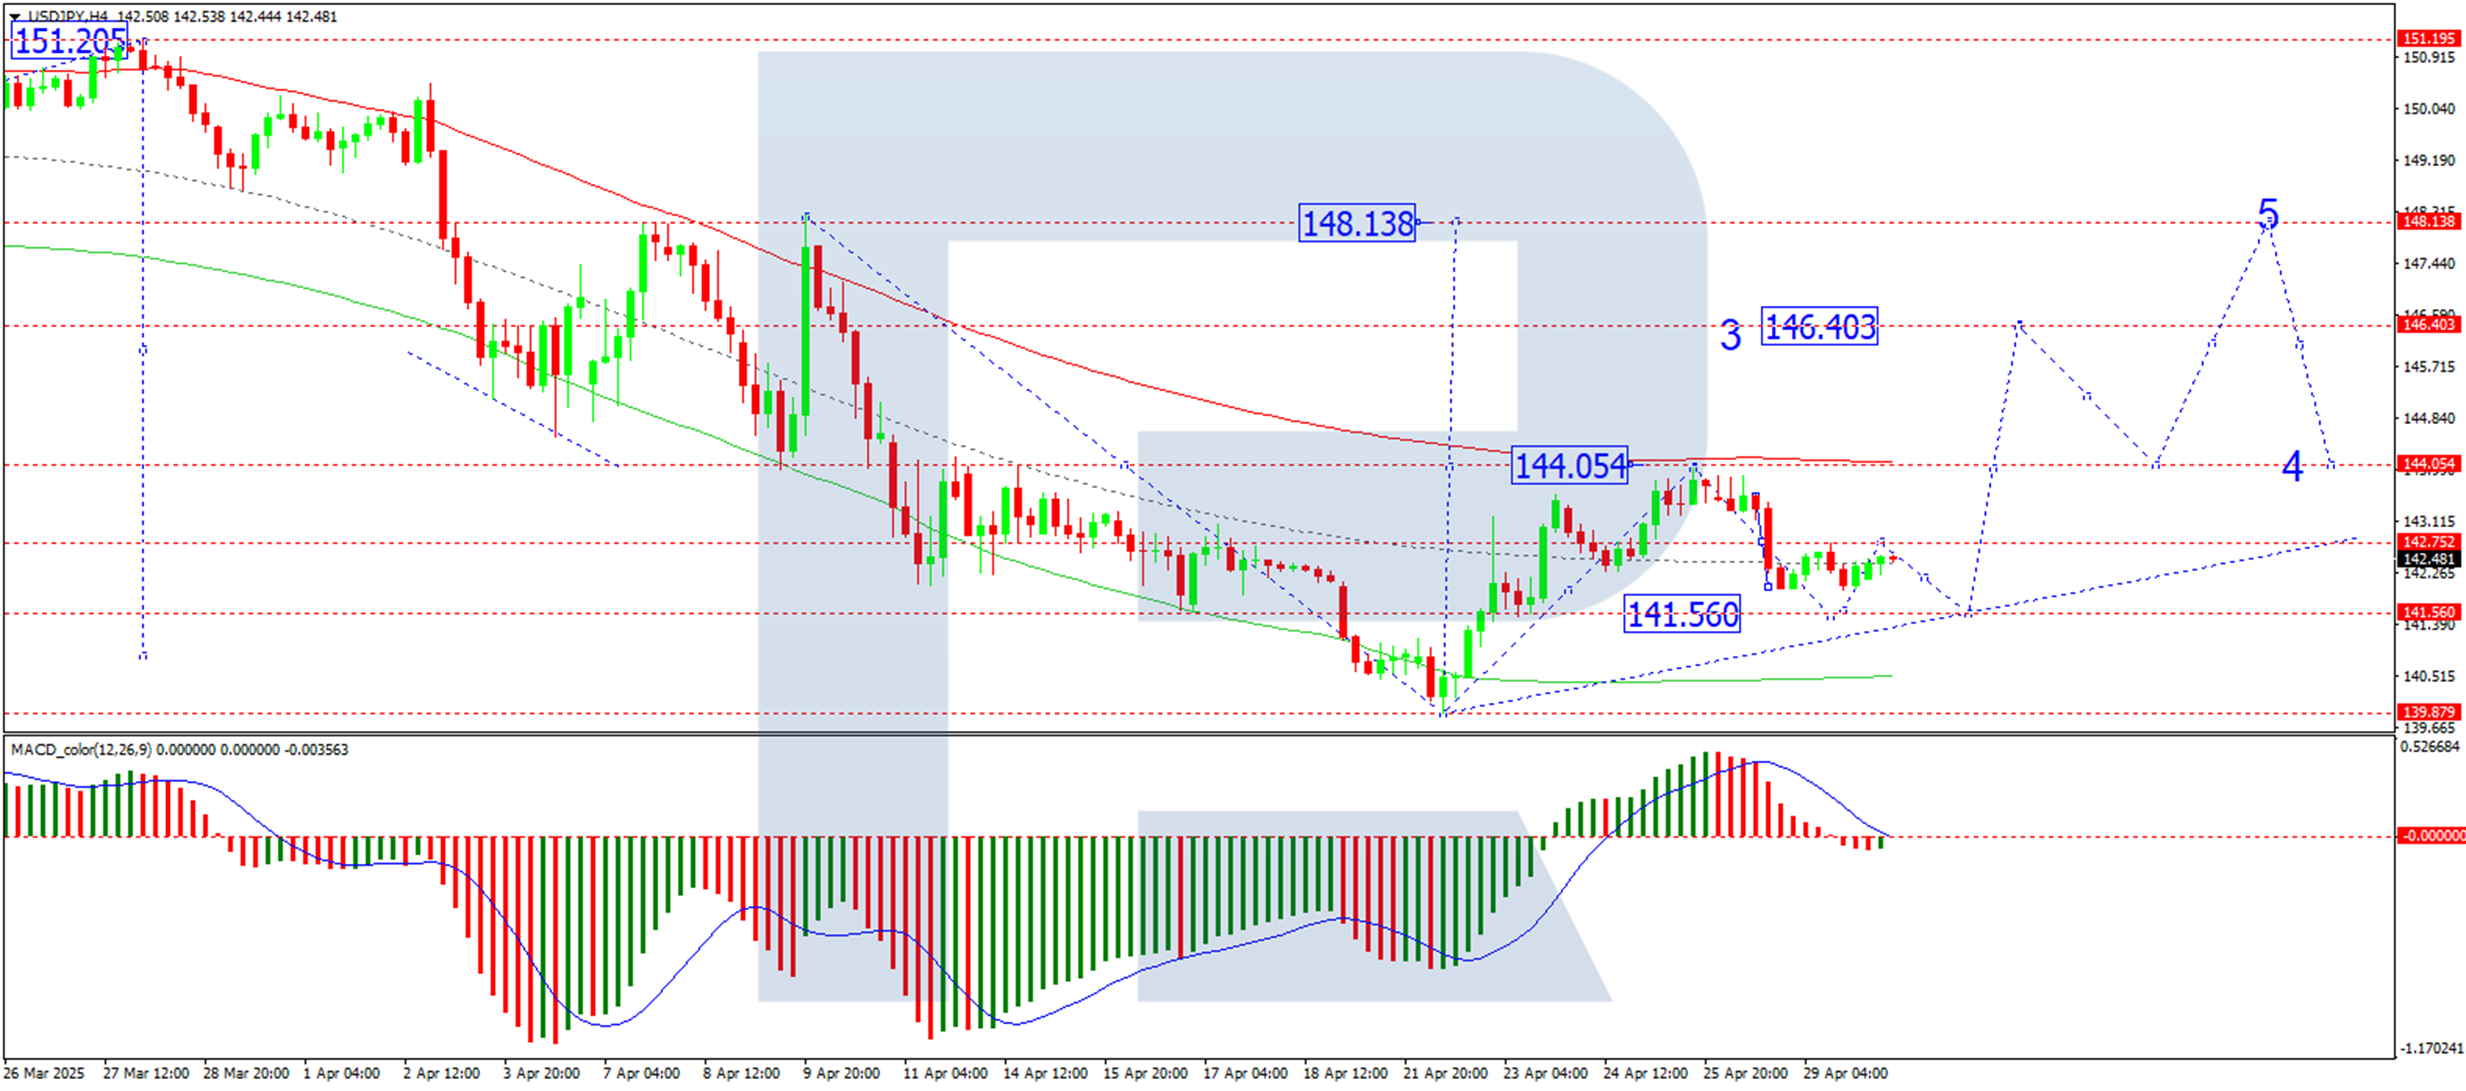
On the H1 chart, USDJPY is consolidating around the 142.30 level. A rise towards 142.75 is possible today, followed by a decline to 141.67, which marks a local target for the corrective move. Technically, this scenario is confirmed by the Stochastic oscillator, whose signal line is above 80 and preparing to reverse towards 20.
Conclusion
The yen remains under pressure amid a lacklustre economic performance while traders await fresh cues from the BoJ. While a technical rebound appears likely after the correction, the pair’s near-term trajectory will hinge on trade developments and US tariff policy.
USD/JPY Bulls Remain Cautiously Active
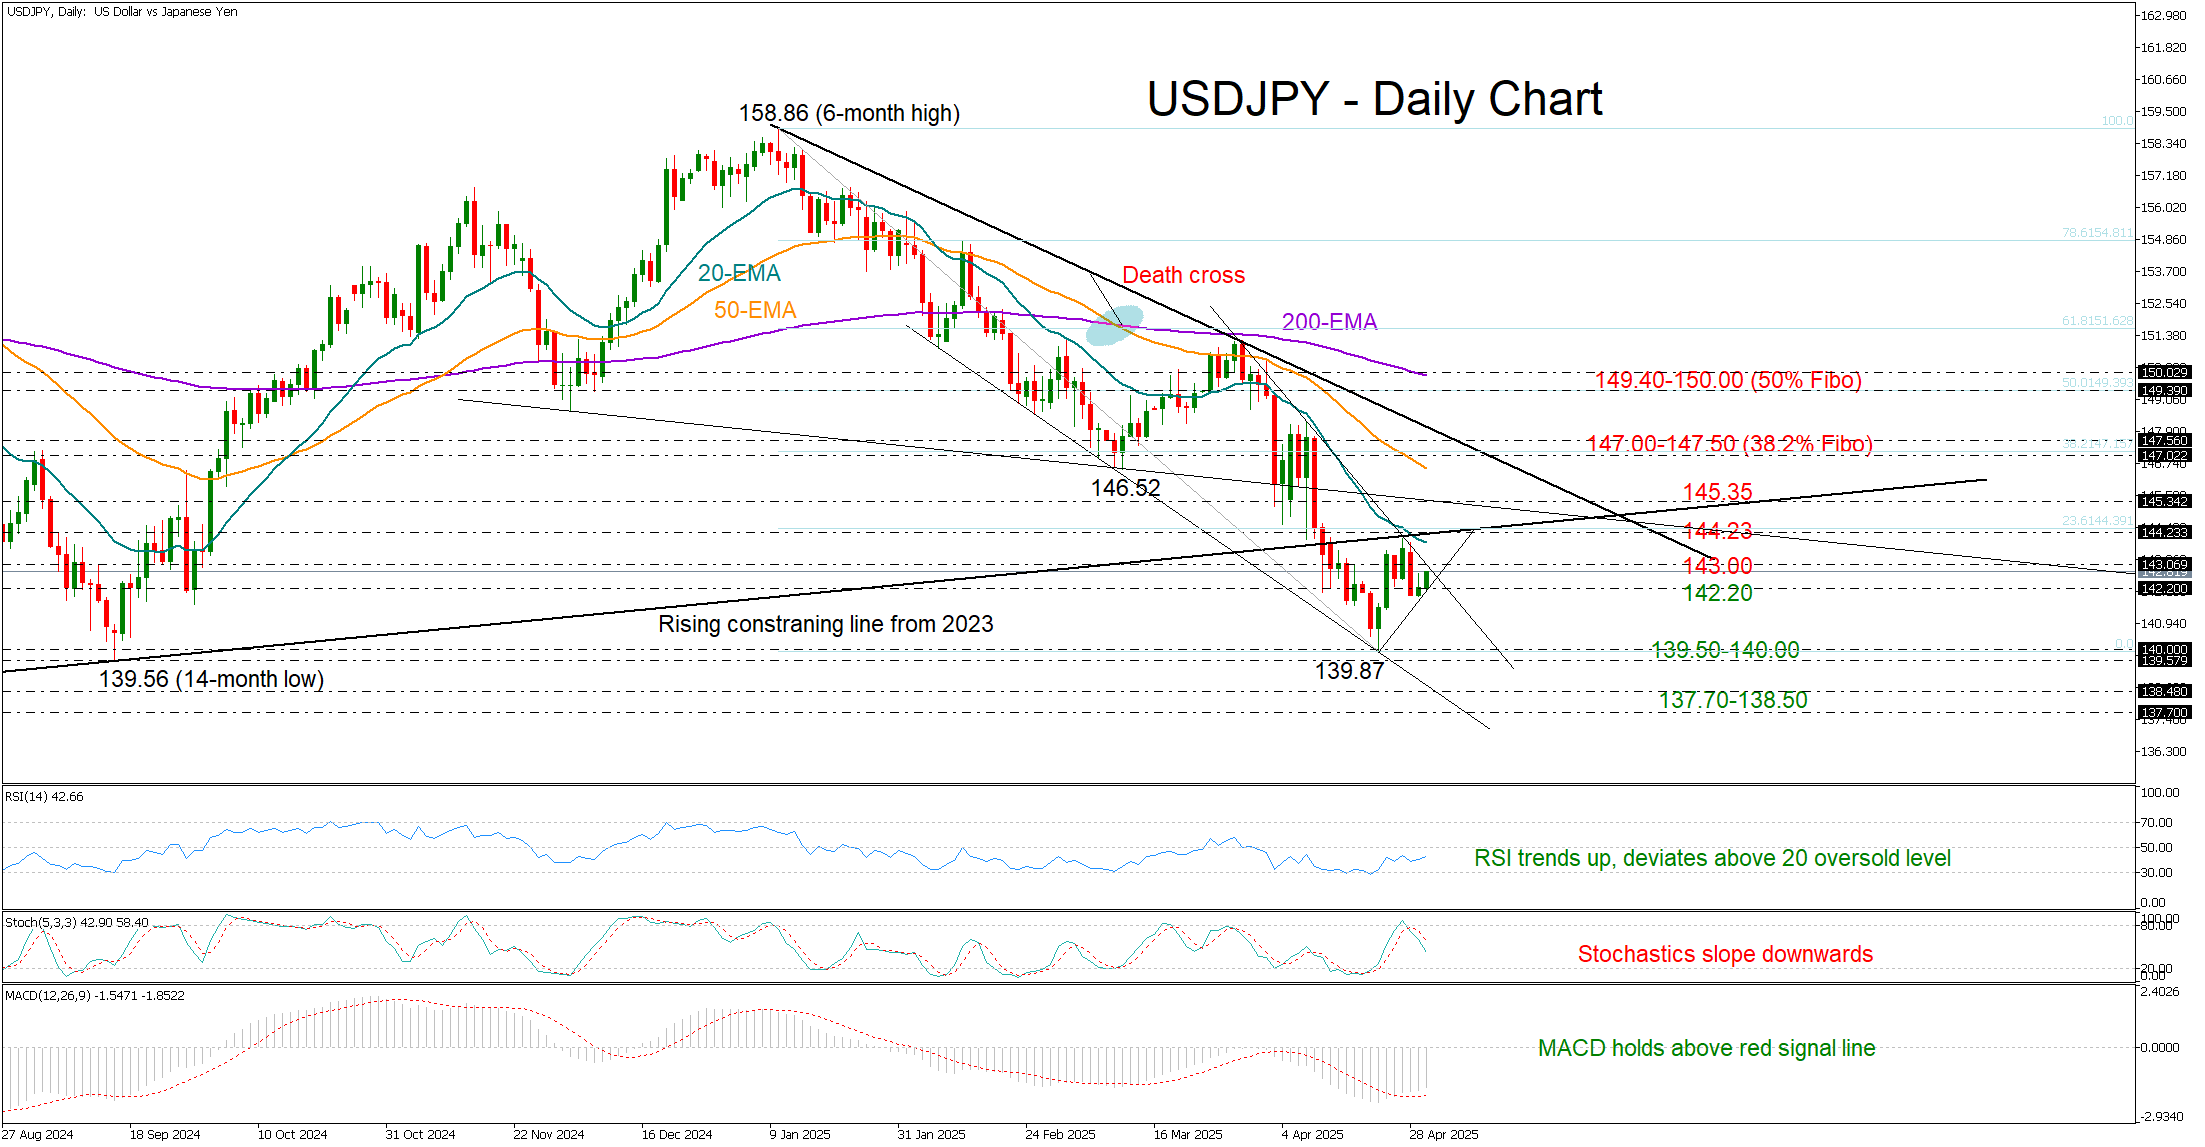
- USD/JPY tiptoes higher; forms encouraging candlestick pattern
- A slew of obstacles still lie ahead; bullish outlook above 147.50
USDJPY attempted a modest recovery after dipping to 141.95 early in the week. While Tuesday’s bullish move was limited, the formation of a small, inverted hammer candlestick suggests potential for upward momentum. Confirmation, however, would require a solid green candlestick to follow.
The upward trajectory in the RSI and MACD keeps hopes for a rebound alive as investors await the release of US Q1 GDP growth and core PCE data later today. On the other hand, the falling stochastics undermine the strength of any potential bullish action, while the negative slope in the exponential moving averages (EMAs) lends further support to the prevailing downtrend.
Immediate resistance lies at the 143.00 mark, followed by the 20-day EMA and the 144.23–145.35 constraining zone. A break higher could open the door to the 50-day EMA and the tentative resistance trendline near 147.50 – also the 38.2% Fibonacci retracement of the 2025 downtrend.
On the downside, a close below 142.20 could drag the pair back toward 139.50–140.00. A deeper decline could test support at 137.70–138.50, and potentially 137.20, a break of which could clear the way to 132.85.
In summary, while USDJPY bulls remain cautiously active, a confirmed bullish outlook hinges on a decisive move above 147.50.