Sample Category Title
ECB’s Lane sees Dollar outflows as rebalancing, not the end of dominance
Speaking at an IIF conference overnight, ECB Chief Economist Philip Lane downplayed concerns over recent portfolio shifts away from US Dollar assets, suggesting the move may reflect a normalization rather than a structural retreat.
Lane noted that allocations are likely moving from an overweight position in Dollar-denominated assets toward a more balanced distribution among global currencies.
He pointed out that US assets had been “priced to perfection” following US President Donald Trump’s election last year, making some degree of reallocation expected as valuations adjust.
Lane also addressed recent outflows from U.S. Treasuries, framing them as part of this rebalancing process. “It can either settle down or invite a deeper rethink,” he said, leaving the door open to further shifts depending on global investor sentiment.
However, he admitted that despite the near-term adjustments, Dollar is still expected to far outweigh Euro in most global portfolios.
ECB’s Knot and Muller downplay tariff impacts on inflation and growth
Dutch ECB Governing Council member Klaas Knot noted that the combination of US tariffs, a stronger Euro, and falling energy prices could push eurozone inflation lower than expected in the short term.
“The strong euro, together with falling energy prices, suggests that the near-term impact might not be so inflationary after all,” Knot said. However, he cautioned that medium-term risks remain, especially if global supply chain disruptions intensify. He supported keeping the ECB’s key policy rate within a neutral range of 1.75% to 2.25%, where it currently stands.
Echoing a cautious but measured tone, Estonia’s ECB Governing Council member Madis Muller acknowledged that the US’s evolving trade policy creates “quite a bit more challenging” outlook for the Eurozone. Nevertheless, he maintained that moderate growth remains achievable, albeit at a slower pace than previously anticipated.
Muller added that he is not forecasting a recession, noting that the impact of trade tensions, while significant, is unlikely to derail the region’s economic recovery entirely. Though, he emphasized the need for optionality, suggesting that more accommodation could be warranted if conditions deteriorate
Ethereum Flips Key Resistance – Can Bulls Ride the Wave to $2,000?
Key Highlights
- Ethereum rallied over 15% and cleared the $1,750 resistance.
- ETH surpassed a key bearish trend line with resistance at $1,640 on the daily chart.
- Bitcoin price also rallied and surpassed the $93,500 resistance.
- XRP is showing positive signs, and the bulls could aim for a move toward $2.50.
Ethereum Technical Analysis
Ethereum remained stable above $1,500 and started a fresh increase. ETH cleared a few key hurdles near $1,620 to start a fresh surge.
Looking at the daily chart, the price surpassed a key bearish trend line with resistance at $1,640. The price even surpassed the 50% Fib retracement level of the downward wave from the $2,100 swing high to the $1,380 low.
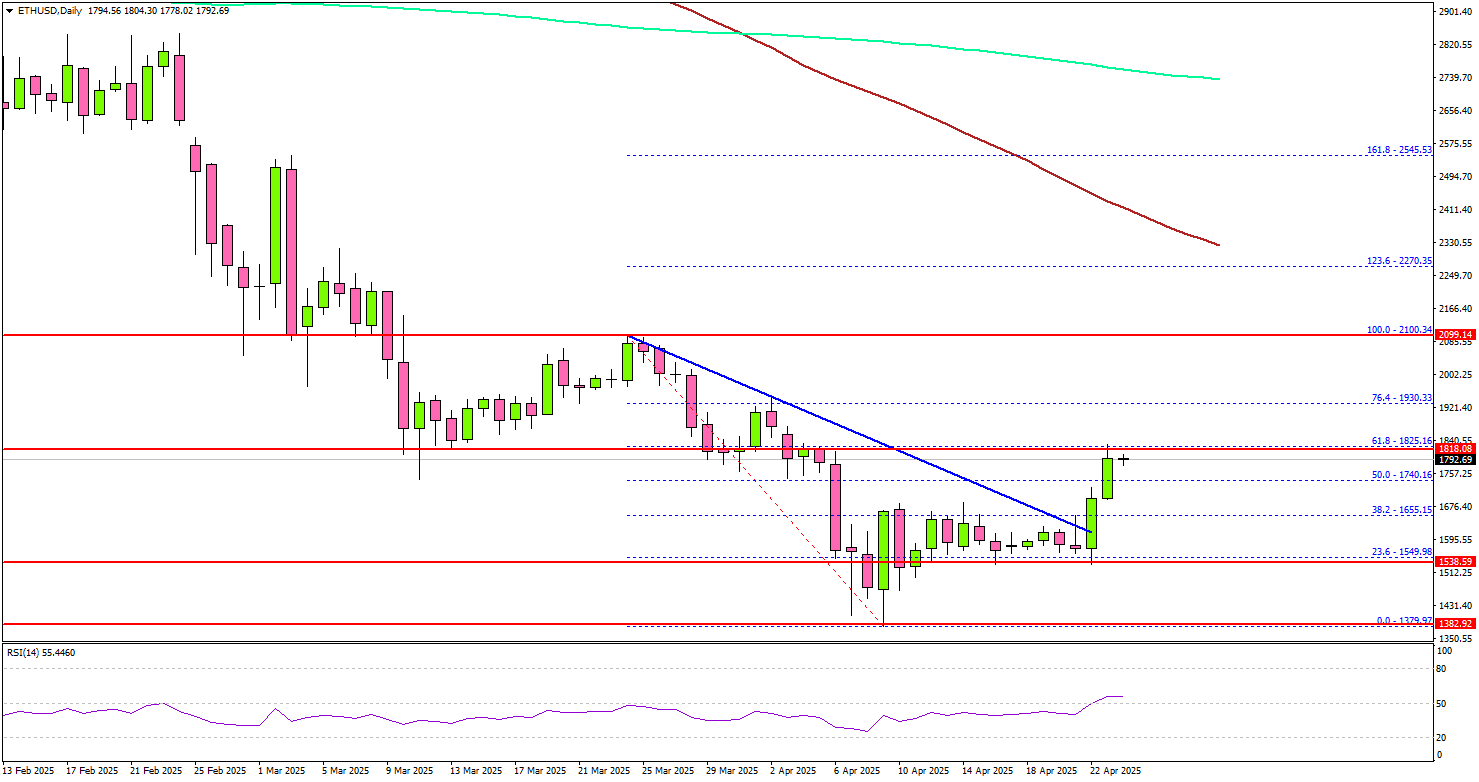
ETH settled above the 100-day simple moving average (red) and the 200-day simple moving average (green). Immediate resistance is near the $1,825 level.
The next major resistance is near the $1,930 level and the 76.4% Fib retracement level of the downward wave from the $2,100 swing high to the $1,380 low. A daily close above the $1,930 resistance zone could start another steady increase. In the stated case, the price may perhaps rise toward the $2,000 level. The next stop for the bulls may perhaps be $2,120.
On the downside, Ethereum might find support near the $1,700 level. The next major support is $1,650, below which the price could slide toward $1,600. Any more losses might call for a move toward the $1,550 level.
Looking at Bitcoin, there was a steady increase above the $92,000 level, and the price might continue to rise toward the $98,000 level.
Economic Releases
- US Initial Jobless Claims - Forecast 221K, versus 215K previous.
- US Durable Goods Orders for March 2025 – Forecast +2% versus +1% previous.
EURCHF Wave Analysis
EURCHF: ⬆️ Buy
- EURCHF broke the resistance area
- Likely to rise to resistance level 0.9500
EURCHF currency pair recently broke the resistance area between the resistance level 0.9365 (former strong support from the start of 2025) and the 38.2% Fibonacci correction of the downward impulse from March.
The breakout of this resistance area should accelerate the active upward correction which started earlier from the major support level 0.9250.
Given the strength of the support level 0.9250 and the strong outflows from the Swiss franc, EURCHF currency pair can be expected to rise toward the next resistance level 0.9500.

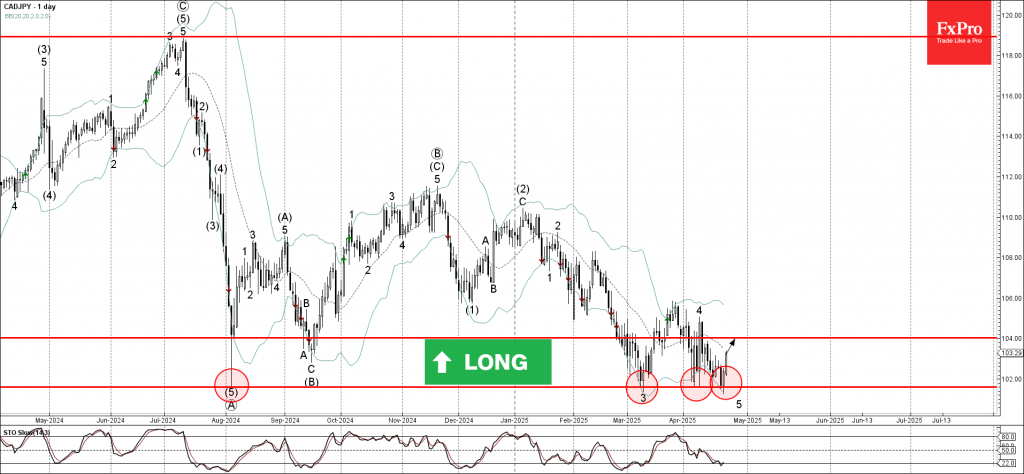
CADJPY Wave Analysis
CADJPY: ⬆️ Buy
- CADJPY reversed from strong support area
- Likely to rise to resistance level 104.00
CADJPY currency pair recently reversed from the strong support area between the long-term support level 101.60 (which stopped the sharp downtrend in August of 2024) and the lower daily Bollinger Band.
The upward reversal from this support area created the daily Japanese candlesticks reversal pattern Piercing Line.
Given the strength of the support level 101.60 and the bullish Canadian dollar sentiment seen today, CADJPY currency pair can be expected to rise toward the next resistance level 104.00.
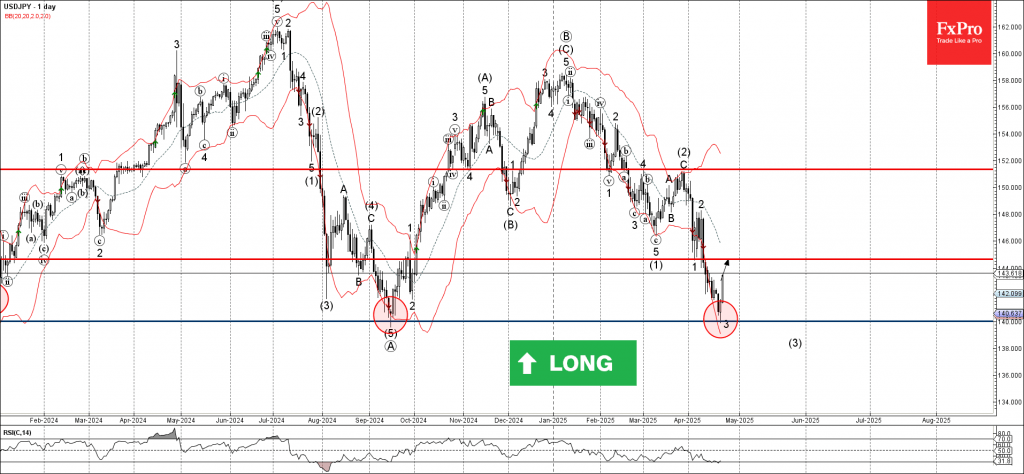
USDJPY Wave Analysis
USDJPY: ⬆️ Buy
- USDJPY reversed from the support area
- Likely to rise to the resistance level 144.65
USDJPY currency pair recently reversed up from the support area between the long-term support level 140.00 (former multi-month low from September) and the lower daily Bollinger Band.
The upward reversal from this support area stopped the previous sharp downward impulse wave 3 of the higher impulse wave (3) from February.
Given the strength of the support level 140.00 and the strongly bearish yen sentiment seen today, USDJPY currency pair can be expected to rise toward the next resistance level 144.65 (former support from the start of April).
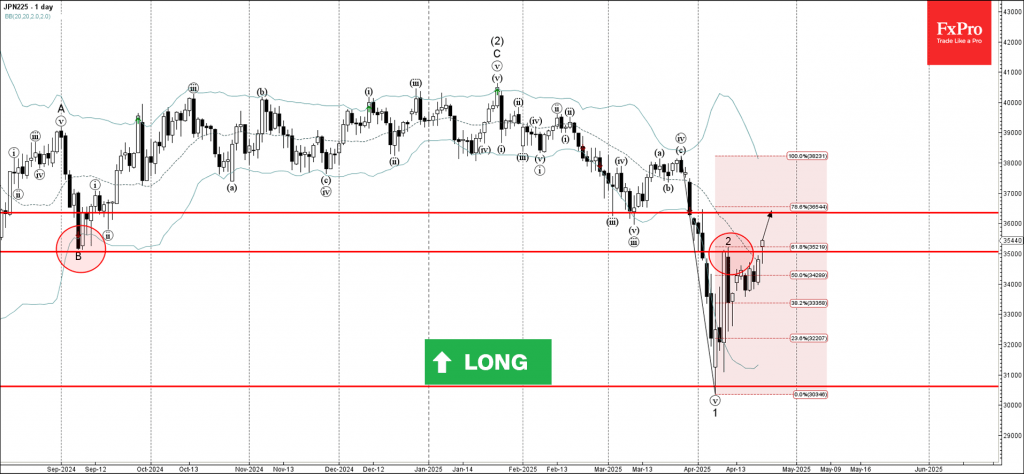
Nikkei 225 Wave Analysis
Nikkei 225: ⬆️ Buy
- Nikkei 225 broke the resistance area
- Likely to rise to resistance level 36355.00
Nikkei 225 index recently broke the resistance area between the pivotal resistance level 35000.00 (which stopped the previous correction 2, former strong support from September) and the 61.8% Fibonacci correction of the downward impulse from March.
The breakout of this resistance area would extend the earlier short-term ABC correction 2 from the start of April.
Nikkei 225 index can be expected to rise toward the next resistance level 36355.00 (former support which stopped the previous corrections iii and v last month).
Sunset Market Commentary
Markets
April EMU PMI surveys showed business activity broadly unchanged. The composite gauge dipped from 50.9 to 50.2 (vs 50.1 expecting), narrowly holding above the boom/bust level (50) for the fourth consecutive month. There were contrasting trends between marginally decreasing business activity in services (49.7 from 51) and the manufacturing sector holding up better than expected (48.8 from 48.7; 27-month high). Moreover, the manufacturing output index rose for a second month straight (51.2 from 50.5), recording a 35-month high. Despite the US introducing general tariffs of 10% and car tariffs of 25%, manufacturers increased production, slowed down job cuts and managed to boost their profit margins thanks to lower input prices and the ability to raise output prices faster. Lower energy prices and the announced increase in defense spending are currently a boon for the EMU’s manufacturing sector. On a national level, German manufacturers even saw a slight uptick in export orders, the first since early 2022. Apart from hopes of reaching some compromises with the US, Germany has a well-diversified export base (90% of exports go to countries other than the US). Overall cost inflation remains centered around services (wages) but input costs increased at the slowest pace since November last year. Selling prices were raised across both sectors. The most pessimistic part of the PMI survey was a sharp drop in business confidence, with sentiment down to the lowest since November 2022. In a separate release, the ECB’s wage tracker predicts wage growth to slow from >=4% in Q1 and Q2 (annualized) to 2.1% Q/Qa in Q3 (from 2.2% last month) and 1.6% Q/Qa in Q4 (up from 1.5%). EMU markets didn’t respond to today’s data releases.
US President Trump succumbed to market pressure a second time by saying it isn’t his intention to sack Fed chair Powell. Earlier this month, he immediately cut reciprocal tariffs to the 10% base rate for at least 90 days. Twice, the U-turn came after US assets went into tailspin. In the same vein, he suggested that high tariffs against China will come down substantially with Treasury Secretary Bessent also indicating that the current implicit trade embargo between the two nations isn’t the longed-for outcome. Markets start seeing a pattern here and responded positively. US stock markets are on track for back-to-back gains of 2.5%. European stock markets equally gain over 2%. US Treasuries rally with the curve bull flattening. US yields lose 2.2 bps (2-yr) to 13.8 bps. Interestingly, the German yield curve bear flattens with yields up 2.2 bps (30-yr) to 6.3 bps (2-yr). It affirms both German Bunds’ safe haven status and markets overly optimistic ECB rate cut bets. EUR/USD held rather steady around 1.14.
News & Views
EUREX, Europe’s largest bond futures (and derivatives in general) exchange, announced the introduction of EU bond futures for September 10. The launch was expected for last year but got postponed due to concerns over the sustainability and the long-term nature of the EU’s joint bond programme. The news will be welcomed by EU officials, who have been pushing for increased liquidity in EU bond trading via several ways, including through the creation of a repo facility. The bloc is also lobbying to have the bonds included in sovereign debt indices but the major index providers (ICE, MSCI) so far keep refusing. The launch reflects EUREX’s “strategic commitment to supporting European ambitions for greater autonomy at a time when the continent is relying on additional debt issuance”, the global head of products and markets said. The EU quickly became the fifth largest borrower in the wake of the pandemic’s Next Generation EU programme. Since then, momentum is building for joint EU borrowing to help finance the upcoming huge defense investments.
UK April private sector activity unexpectedly contracted for the first time in 1,5 years with the composite PMI dropping from 51.5 to 48.2. Optimism for the year ahead outlook slumped to its lowest since October 2022. The decline was led by the services sector, falling to 48.9 from 52.5 on rising global economic & tariff uncertainty and subdued domestic demand. Manufacturing production volumes dropped at the steepest rate since August 2022 due to weakening market conditions, particularly in key export destinations. This resulted in a solid reduction in new work inflows for a fifth month running. Both sectors kept cutting back employment due to decreased workloads and rising payroll costs. The latter is still a consequence of the Labour government’s tax increases and jolted input cost inflation to the fastest pace since February 2023. Output charge inflation picked up to the highest for nearly two years. The stagflationary narrative once again highlights the tough trade-off the Bank of England faces. The pound sterling erased earlier gains against the euro to trade nearly unchanged around EUR/GBP 0.857.
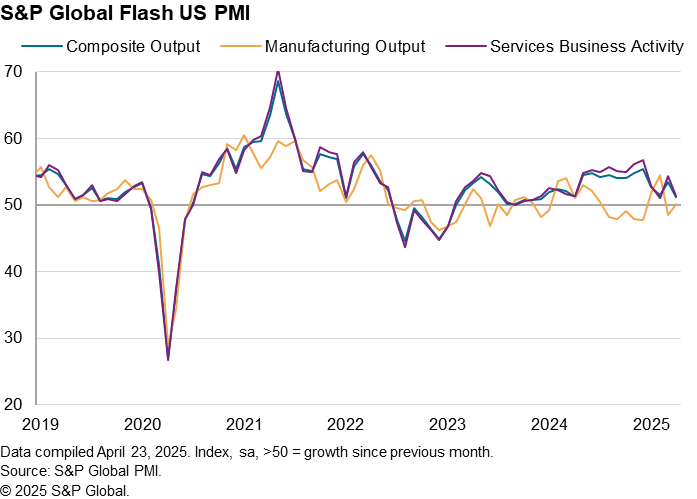
US PMI composite falls to 16-month low, activity cools and price pressures intensify
The US economy showed clear signs of slowing in April, with S&P Global flash composite PMI falling from 53.5 to 51.2, its lowest level in 16 months. While manufacturing activity edged up slightly from 50.2 to 50.7, the services sector lost significant momentum, dropping from 54.4 to 51.4.
According to S&P Global’s Chris Williamson, the early data signals a “marked slowing of business activity growth” at the start of Q2, with output rising at its weakest pace since December 2023. This implies a modest annualized GDP growth rate of around just 1.0%.
At the same time, inflationary pressures are re-emerging. Companies reported a sharp uptick in input costs, led by tariff-related price increases and persistent wage pressures.
In manufacturing, price increases reached their fastest pace in nearly two-and-a-half years. Services firms also raised their selling prices at the highest rate in over a year.