Sample Category Title
US Stocks React to Trump’s Comments and Earnings, PMI Ahead
Markets have had a rollercoaster 24 hours as President Trump has once again proved to be the market driver.
Wall Street looked ready to extend its best gains in two weeks, with S&P 500 futures rising 2.5%. This came after President Trump reassured markets he wouldn't fire Federal Reserve Chair Jerome Powell. Hopes for easing US-China trade tensions also boosted investor confidence.
Market sentiment improved thanks to positive earnings reports. Tesla shares rose 7% in premarket trading, even though the company fell short of forecasts. The rise came about when Elon Musk announced he would step back from his government work to focus on the company.
Tesla posted a 16.3% total gross margin, beating analysts'predictions of 15.8%. A big decline from the 17.4% a year earlier.
Still the revenue slumped 20% to $13.97 billion for the quarter.
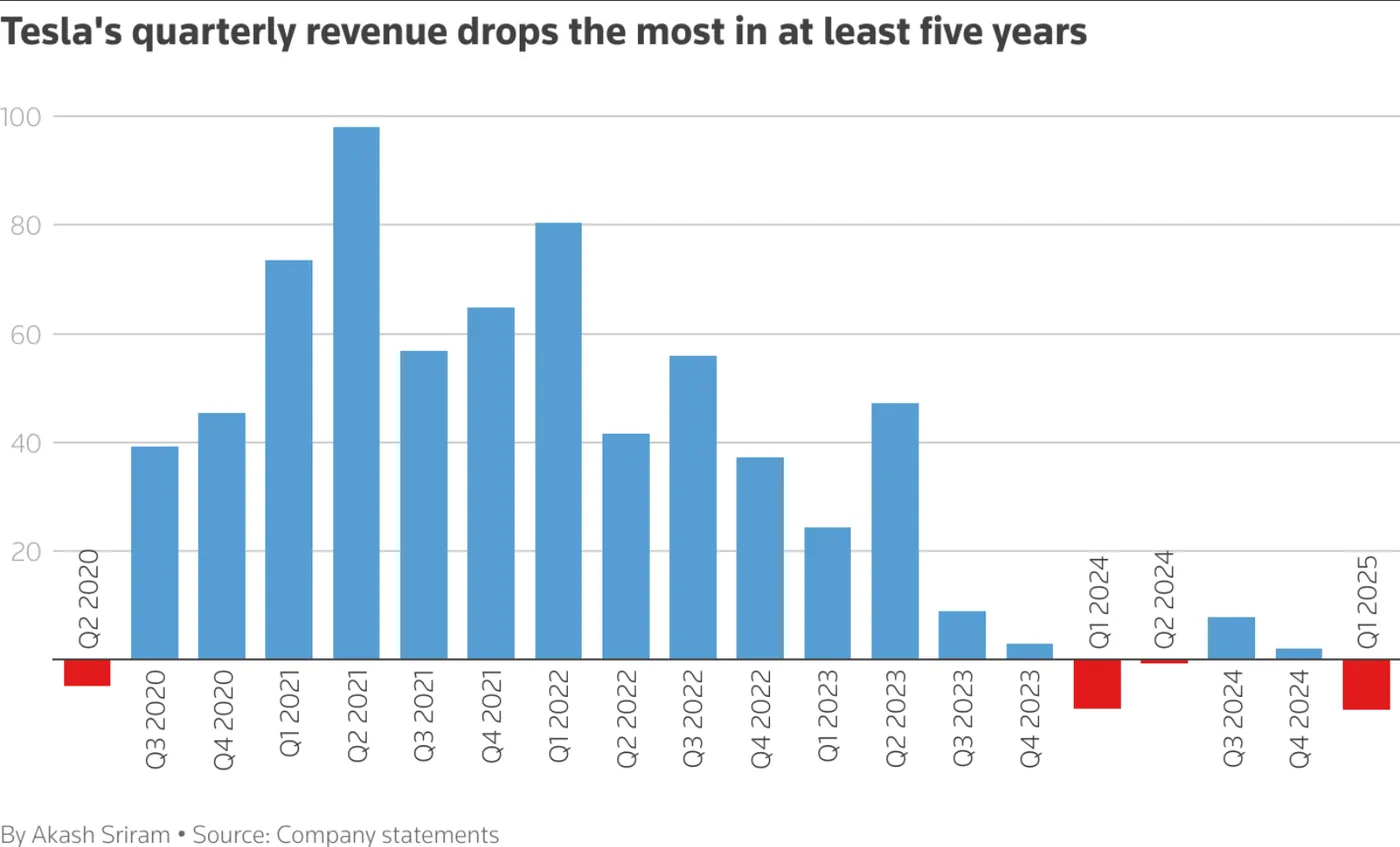
Source LSEG
Treasuries gained as concerns over Powell’s job eased, with 10-year yields falling to 4.30%. The dollar stabilized after a recent rally. Bitcoin surged past $90,000 for the first time since early March. Gold dropped as safe-haven demand weakened, while oil continued to recover.
Other earnings releases that have come out include Boeing, who reported a smaller loss for the first quarter, thanks to more production and deliveries after a strike and quality issues halted most aircraft manufacturing in late 2024.
The company plans to increase production of its popular 737 MAX jets to 38 per month by 2025, following last year’s setbacks from worker strikes and other crises.
AT&T shares are up in pre-market trading after gaining more new wireless subscribers than analysts had predicted in the first quarter.
On the earnings front, there are still earnings after market close today which include International Business Machines (IBM), Newmount, QuantumScape and ServiceNow.

Source: Interactiveinvestor
The general improvement in risk sentiment still faces some challenges.Until there are some tariff deals announced officially or official word on US-China relations, the move may eventually run out of steam.
For a full review of Euro PMI data released this morning, please read Euro under pressure as Services PMIs slip
Economic data releases
For now focus will shift to earnings but may still be overshadowed by tariff developments. US PMI may also give us a glimpse if there has been any effects yet from the proposed US tariffs on the data. It might still be too early to tell but comments from manufacturers may shed some light as well.
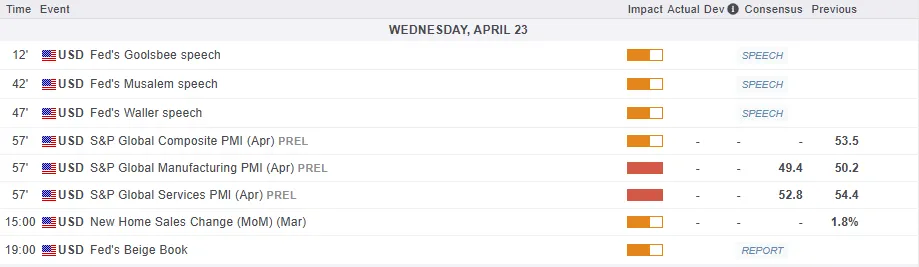
For all market-moving economic releases and events, see the MarketPulse Economic Calendar. (click to enlarge)
Chart of the day - Nasdaq 100
From a technical standpoint, the Nasdaq 100 is threatening a change of structure as it looks to print a fresh higher high.
A daily candle close above the 19123 handle should see the requirements being met and should increase the probability of further gains.
Of course in the current climate, sentiment can shift quickly but for now the bias does appear to favor the bulls.
Immediate resistance resistance rests at 19123 and 19436 before the 19781 and 20000 psychological level come into focus.
A change in sentiment could knock the rally back which would bring support at 18361, 17800 and 17304 back into focus.
Nasdaq 100 Daily Chart, April 23, 2025
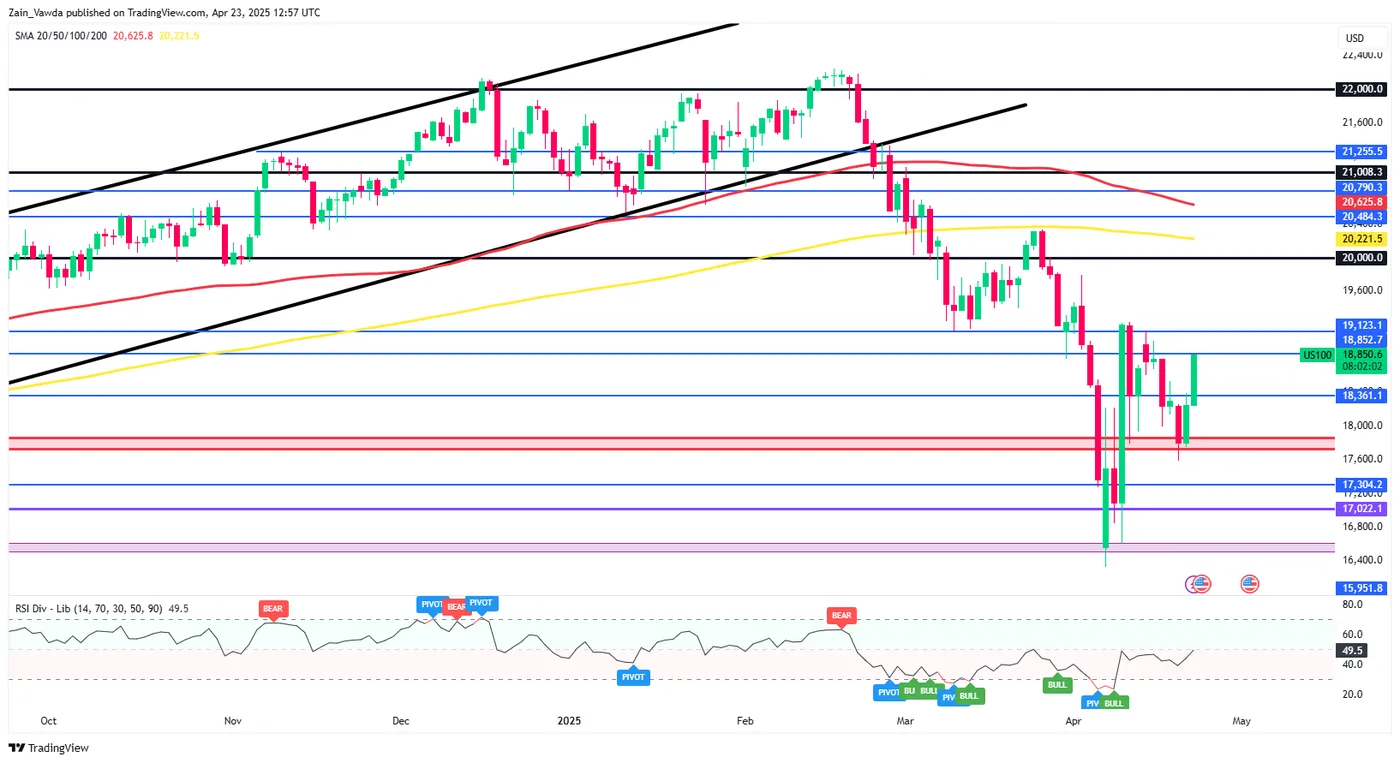
Source: TradingView.com (click to enlarge)
EUR/USD Mid-Day Outlook
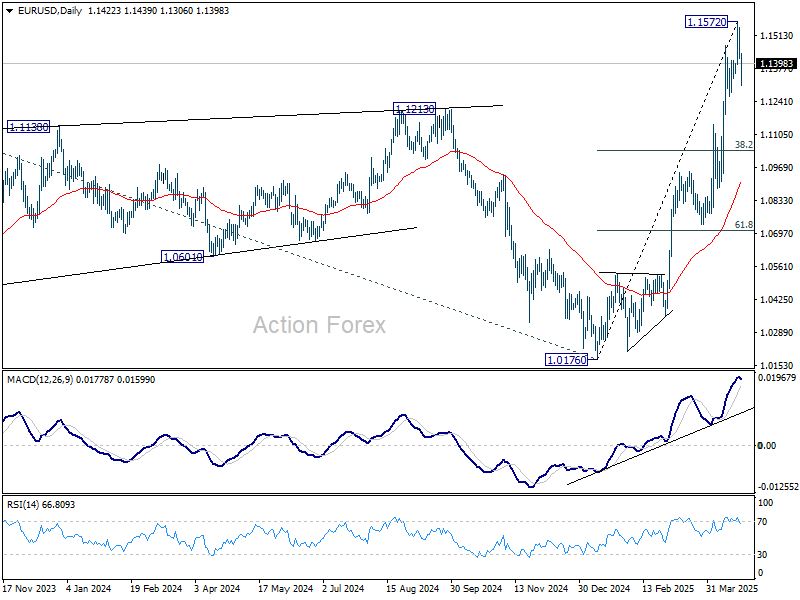
Daily Pivots: (S1) 1.1377; (P) 1.1462; (R1) 1.1507; More...
Intraday bias in EUR/USD remains mildly on the downside. Pull back from 1.1572 short term topping could extend lower. But downside should be contained by 38.2% retracement of 1.0176 to 1.1572 at 1.1039. On the upside, break of 1.1572 will resume larger up trend.
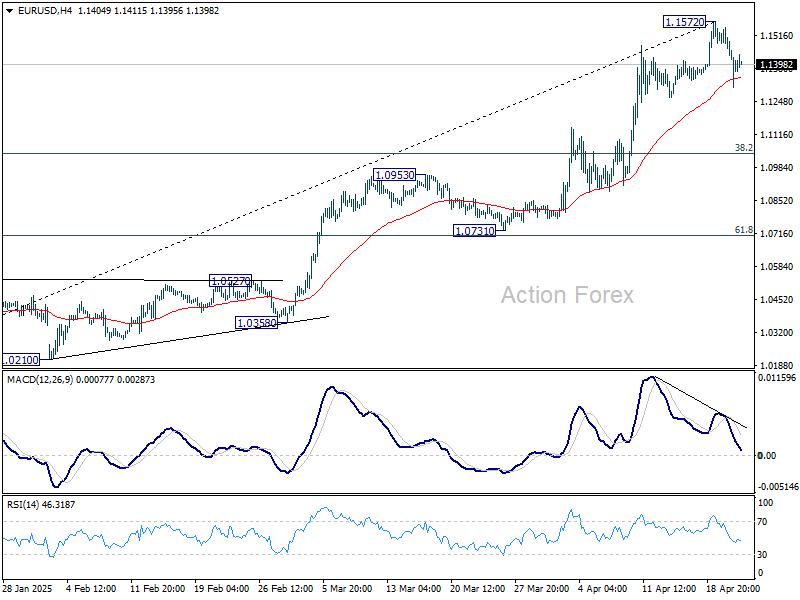
In the bigger picture, rise from 0.9534 long term bottom could be correcting the multi-decade downtrend or the start of a long term up trend. In either case, further rise should be seen to 100% projection of 0.9534 to 1.1274 from 1.0176 at 1.1916. This will now remain the favored case as long as 55 W EMA (now at 1.0776) holds.
GBP/USD Mid-Day Outlook
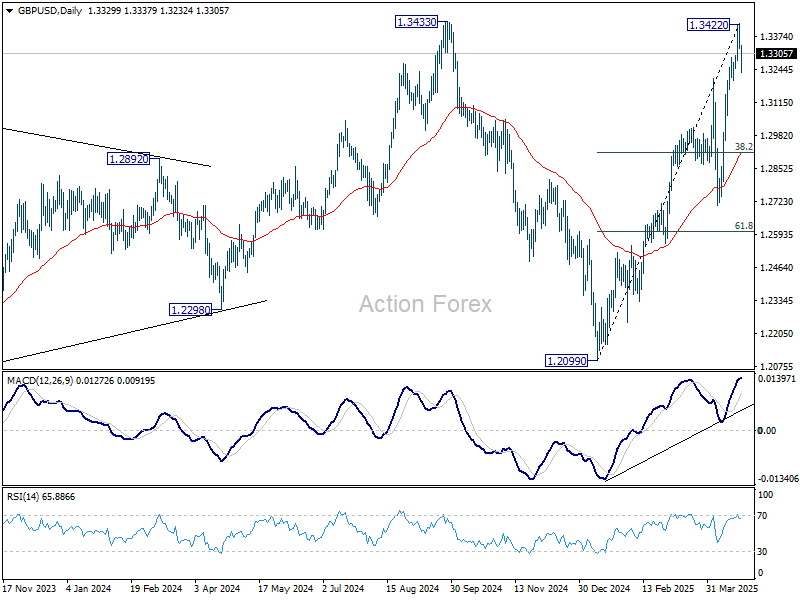
Daily Pivots: (S1) 1.3298; (P) 1.3360; (R1) 1.3395; More...
Intraday bias in GBP/UD remains mildly on the downside, as pullback from 1.3422 short term top would continue lower. But downside should be contained by 38.2% retracement of 1.2099 to 1.3422 at 1.2917. On the upside, firm break of 1.3433 will resume larger up trend.
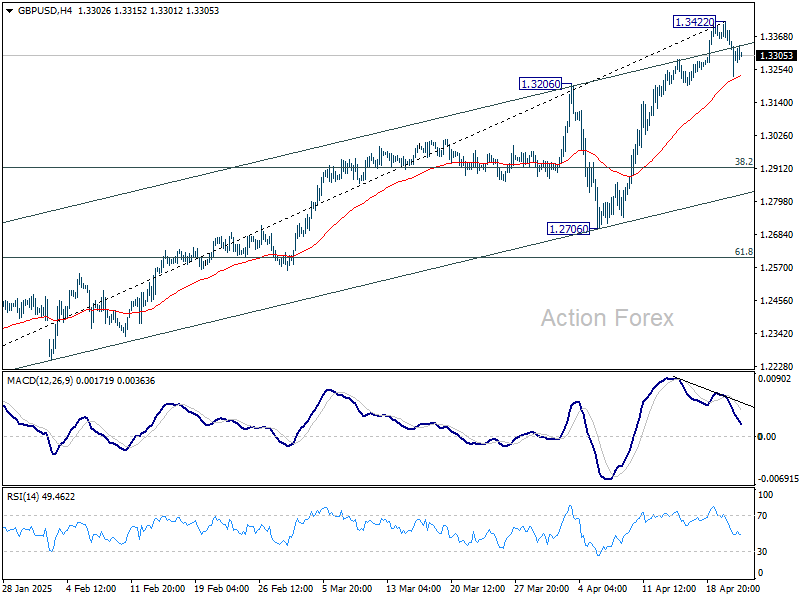
In the bigger picture, price actions from 1.3433 are seen as a corrective pattern to the up trend from 1.3051 (2022 low). Rise from 1.2099 could be the second leg. Overall, GBP/USD should target 1.4248 key resistance (2021 high) on break of 1.3433 at a later stage.
USD/CHF Mid-Day Outlook
Daily Pivots: (S1) 0.8106; (P) 0.8149; (R1) 0.8233; More…
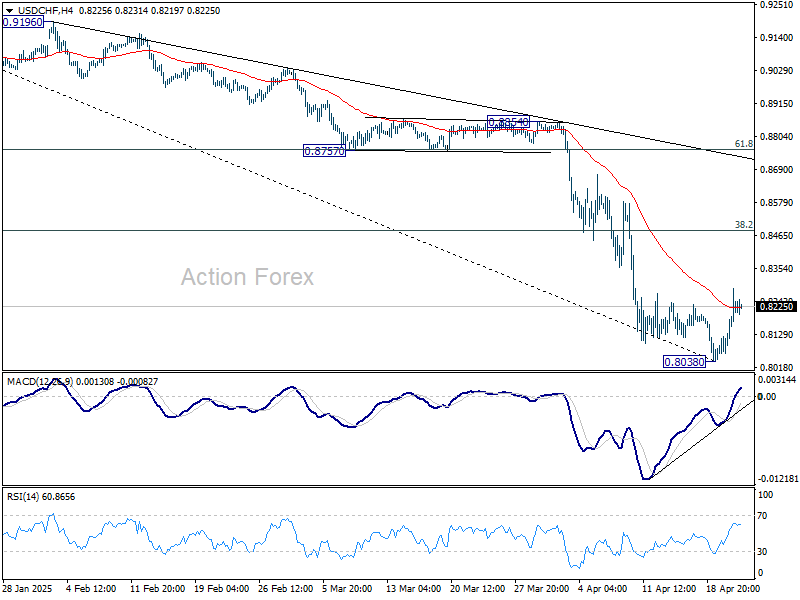
Intraday bias in USDCHF is mildly on the upside at this point. Rebound from 0.8038 short term bottom could extend to 38.2% retracement of 0.9200 to 0.8038 at 0.8482. But strong resistance should be seen there to limit upside. On the downside, break of 0.8038 will resume larger down trend.
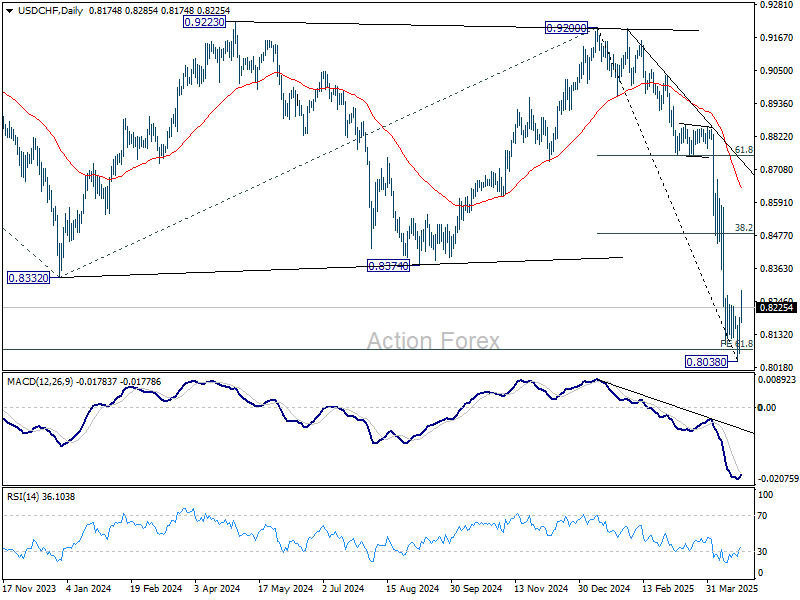
In the bigger picture, long term down trend from 1.0342 (2017 high) is still in progress and met 61.8% projection of 1.0146 (2022 high) to 0.8332 from 0.9200 at 0.8079 already. In any case, outlook will stay bearish as long as 55 W EMA (now at 0.8794) holds. Sustained break of 0.8079 will target 100% projection at 0.7382.
USD/JPY Mid-Day Outlook
Daily Pivots: (S1) 140.44; (P) 141.05; (R1) 142.22; More...
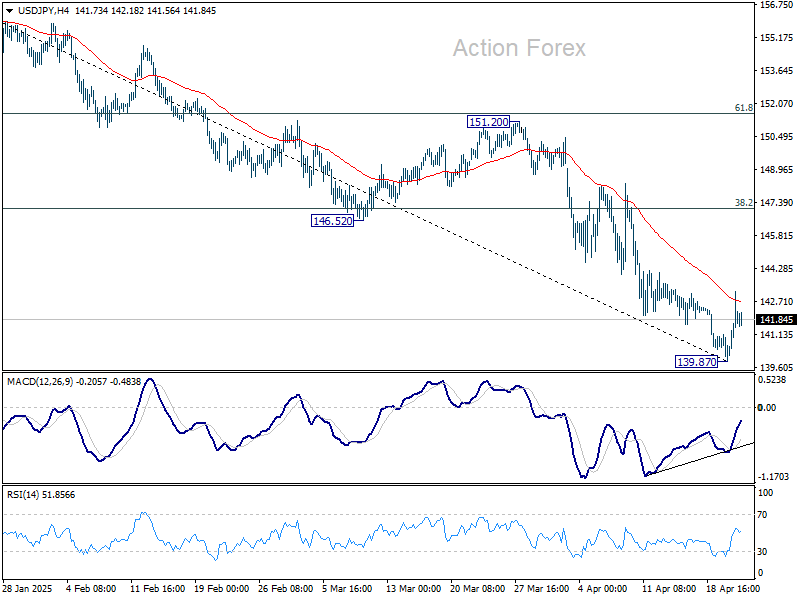
Intraday bias in USD/JPY remains mildly on the upside at this point. Rebound from 139.87 short term bottom could extend higher. But overall risk will stay on the downside as long as 38.2% retracement of 158.86 to 139.87 at 147.12 holds. On the downside, decisive break of 139.26 will carry larger bearish implications.
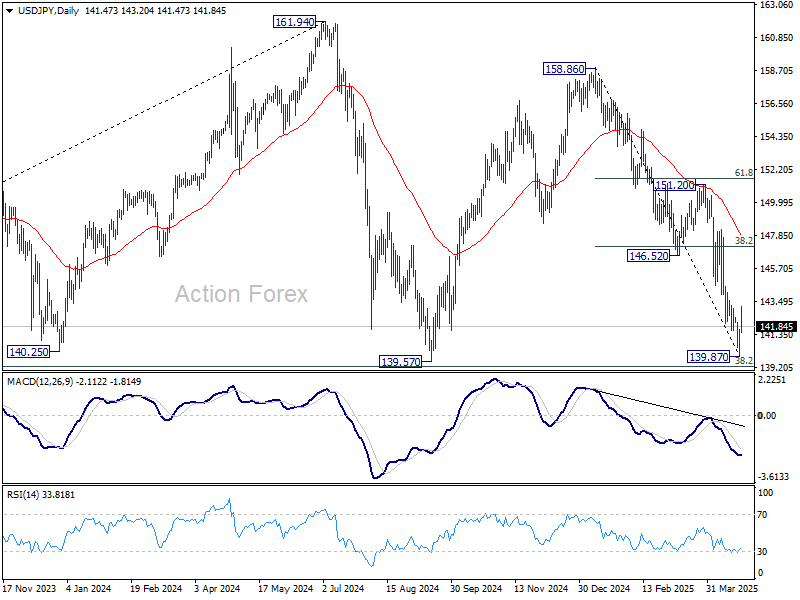
In the bigger picture, price actions from 161.94 are seen as a corrective pattern to rise from 102.58 (2021 low), with fall from 158.86 as the third leg. Strong support should be seen from 38.2% retracement of 102.58 to 161.94 at 139.26 to bring rebound. However, sustained break of 139.26 would open up deeper medium term decline to 61.8% retracement at 125.25.
Relief Rally Continues, Yet Fragile Geopolitics May Limit Momentum
Global financial markets are trading with a cautiously positive tone today, with modest gains across Europe and US futures pointing to a higher open. Investor sentiment has improved on the back of US President Donald Trump stepping back from recent aggressive rhetoric—both toward Fed Chair Jerome Powell and on tariffs against China. The perceived softening in tone has provided much-needed relief after weeks of heightened tension, leading to a reversal in safe-haven flows and helping risk assets stabilize.
In the currency space, European majors are lagging, with Euro and Pound among the worst performers of the day. This weakness partly reflects the broader pullback in safe-haven demand but is also driven by disappointing PMI services data. Both Eurozone and the UK saw service sector activity slip back into contraction. Conversely, Aussie and Kiwi are leading the pack, buoyed by the improved risk mood. Dollar is mixed—holding steady alongside Loonie and Yen. Traders are closely watching whether the recent dollar weakness has bottomed out.
One development that has raised eyebrows is the abrupt cancellation of a planned diplomatic meeting in London involving US Secretary of State Marco Rubio, European leaders, and Ukraine. The talks were meant to address an endgame to Russia’s war in Ukraine but were downgraded to a lower-level “technical” discussion after Rubio withdrew. Reports suggest sharp divisions between Washington and European allies, particularly over Trump’s proposals to recognize Russian control over Crimea and large parts of eastern Ukraine—conditions deemed unacceptable by Europe. Observers suggest this could mark a significant shift in US posture, from active mediator to a more unilateral stance, further straining transatlantic cohesion over the handling of the war in Ukraine.
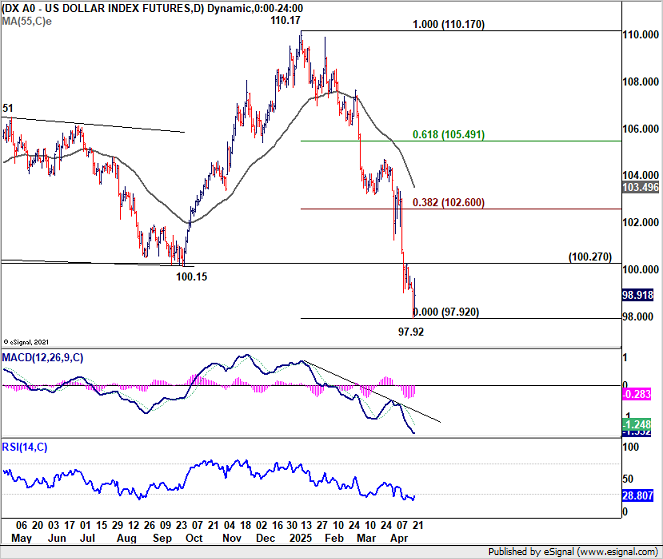
Technically, the focus of Dollar Index will be on 100.27 resistance in coming days. Firm break there should confirm short term bottoming at 97.92, and open up further rebound back to 38.2% retracement of 110.17 to 97.92 as a corrective move. However, before that, risk will stay on the downside for extending recent decline through 97.92 sooner rather than later.
In Europe, at the time of writing, FTSE is up 1.20%. DAX is up 2.45%. CAC is up 2.07%. UK 10-year yield is down -0.054 at 4.506. Germany 10-year yield is up 0.028 at 2.476. Earlier in Asia, Nikkei rose 1.89%. Hong Kong HSI rose 2.37%. China Shanghai SSE fell -0.10%. Singapore Strait Times rose 0.97%. Japan 10-year JGB yield rose 0.013 to 1.324.
UK PMI composite plunges to 48.2, recession fears, pressures BoE to cut rates
The UK private sector contracted sharply in April, with the flash PMI Composite falling from 51.5 to 48.2, the lowest reading in 29 months. PMI Manufacturing dropped from 45.3 to 44.0, a 20-month low. PMI Services slipped from 52.5 to 48.9, the weakest in 27 months.
According to S&P Global’s Chris Williamson, the downturn marks the steepest fall in output in nearly two and a half years, with data now pointing to a potential quarterly GDP decline of -0.3%.
Also, business sentiment has sunk to its lowest level since late 2021, and even beneath the post-Brexit vote lows. The slump in exports, tied to weak global demand and escalating trade tensions, is adding to domestic burdens. Rising staffing costs—partly due to changes in National Insurance and minimum wage rules—have further squeezed margins.
The sharp contraction and collapsing sentiment pose "red flags" for policymakers and could tip BoE toward cutting rates at its upcoming May meeting.
Eurozone PMI Composite slips to 50.1, services contract but manufacturing unfazed by tariffs
Eurozone economy showed signs of stagnation in April as its Composite PMI slipped to 50.1, down from 50.9 in March—a four-month low. The decline was driven primarily by a downturn in the services sector, which contracted for the first time in five months, with the PMI falling from 51.0 to 49.7. In contrast, manufacturing showed unexpected resilience, with PMI ticking up slightly from 48.6 to 48.7, reaching a 27-month high.
Cyrus de la Rubia, Chief Economist at Hamburg Commercial Bank, noted that manufacturers appear "not too fazed" by the recent imposition of broad US tariffs, including 10% general duties and 25% on autos.
He pointed to falling energy prices, driven in part by US recession fears, and planned increases in defence spending as factors supporting the manufacturing sector. However, the decline in services activity has dragged down overall output, pushing the Eurozone economy into what de la Rubia called "stagnation territory."
ECB may find some comfort in the latest inflation signals. While input costs in services remained elevated, the pace of selling price increases eased. In the goods sector, input prices fell, breaking a four-month trend of rising costs, while output prices saw only a modest rise.
At the country level, both Germany and France mirrored the regional trend, with manufacturing output gaining but services activity declining.
Japan’s PMI composite rises to 51.1, service leads while manufacturing drags
Japan’s flash PMI data for April signaled a return to growth in the private sector, with Composite PMI rising from 48.9 to 51.1. The recovery was driven primarily by a rebound in the services sector, where activity rose to 52.2 from 50.0. Meanwhile, manufacturing remained in contraction, though the pace of decline eased slightly, with the PMI inching up from 48.4 to 48.5.
According to S&P Global’s Annabel Fiddes, the divergence between sectors reflected subdued factory output versus strengthening service demand.
A closer look at new business trends revealed further divergence. Manufacturers reported the sharpest drop in new orders in over a year, driven by falling foreign demand and persistent concerns over tariffs and client spending. In contrast, service providers saw their strongest rise in new work since January.
Still, inflationary pressures were strong across the board, with input costs rising at the fastest pace in two years, prompting firms to pass on those costs to customers via higher selling prices.
Overall optimism for output over the next year fell to its lowest level since August 2020, during the early phase of the COVID-19 crisis.
Australia’s PMI composite dips to 51.4, cost pressures emerge
Australia’s flash PMI data for April showed continued, albeit slower, expansion in the private sector, with Manufacturing PMI slipping from 52.1 to 51.7 and Services PMI easing from 51.6 to 51.4. The Composite PMI also declined slightly from 51.6 to 51.4.
Despite the modest pullback, S&P Global’s Jingyi Pan noted that domestic demand remained a "strong proponent" of business activity, supporting further job creation across sectors. The data suggests a solid start to Q2, underpinned by internal momentum, even as external headwinds mount.
However, the impact of US tariffs are starting to show. Export performance weakened, and manufacturers reported "intensification of cost pressures" due to currency fluctuations.
In response, many firms passed on higher costs to clients, pushing overall selling price inflation to a nine-month high.
USD/JPY Mid-Day Outlook
Daily Pivots: (S1) 140.44; (P) 141.05; (R1) 142.22; More...
Intraday bias in USD/JPY remains mildly on the upside at this point. Rebound from 139.87 short term bottom could extend higher. But overall risk will stay on the downside as long as 38.2% retracement of 158.86 to 139.87 at 147.12 holds. On the downside, decisive break of 139.26 will carry larger bearish implications.
In the bigger picture, price actions from 161.94 are seen as a corrective pattern to rise from 102.58 (2021 low), with fall from 158.86 as the third leg. Strong support should be seen from 38.2% retracement of 102.58 to 161.94 at 139.26 to bring rebound. However, sustained break of 139.26 would open up deeper medium term decline to 61.8% retracement at 125.25.
Rapid Assault on Crypto
Market Overview
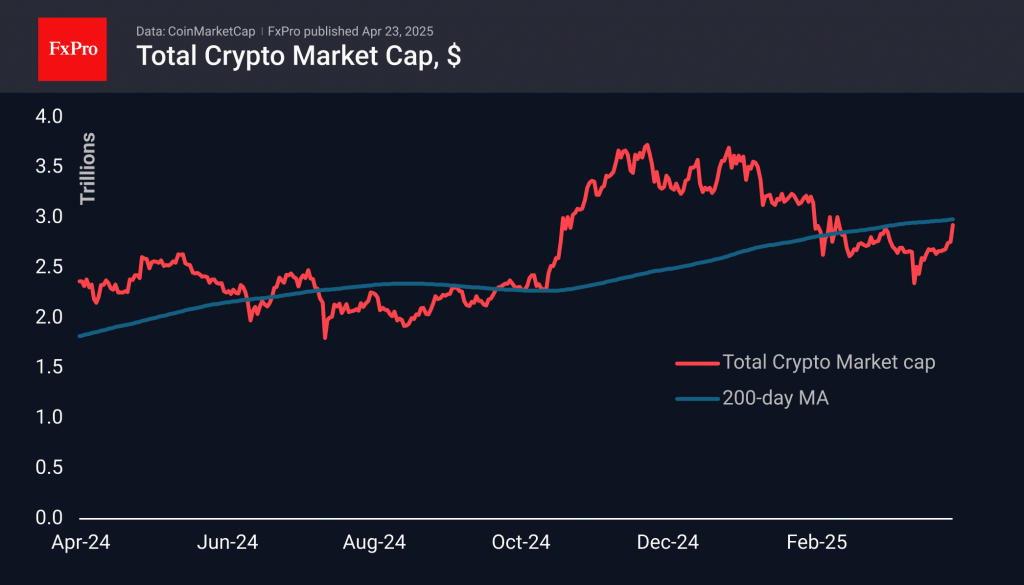
The cryptocurrency market capitalisation surged by 6.4% in the past 24 hours, reaching $2.95 trillion — its highest level in seven weeks and a confident return to a key round figure. Global financial markets underpinned this rally. However, it’s worth noting that the market was already gaining ground on Monday, in defiance of declining stock indices.
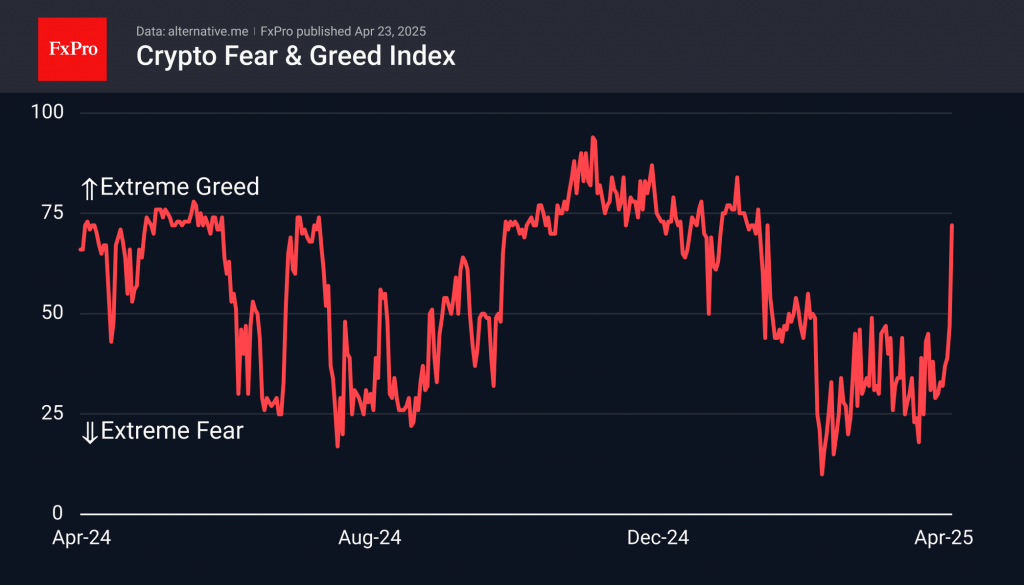
Sentiment in the cryptocurrency space has swiftly shifted towards greed and is now steps away from extreme greed, with the relevant index climbing to 72, the highest since late January.
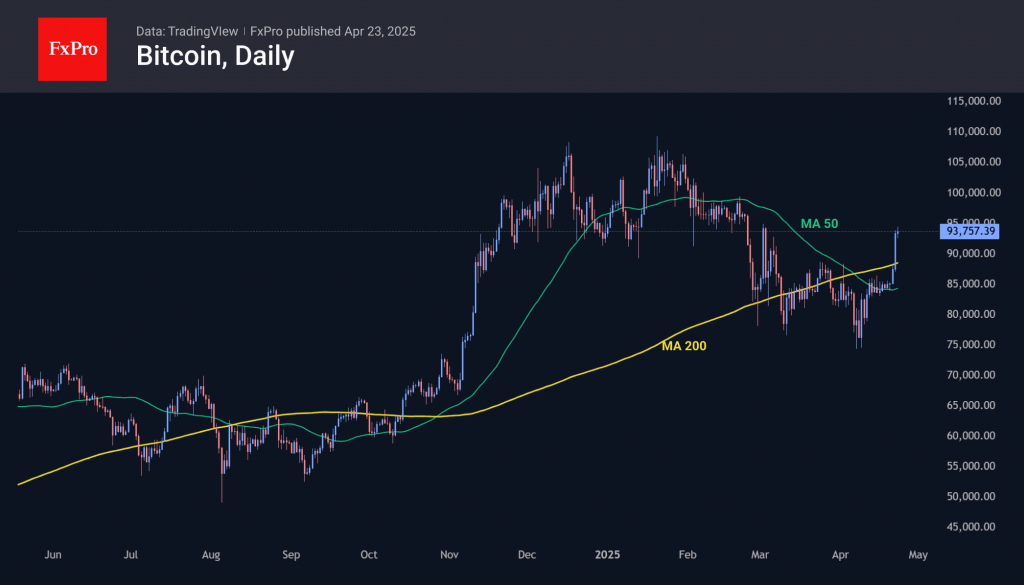
Bitcoin is nearing the $94,000 mark, which it briefly surpassed in early March. Sustained trading above this level was last observed in late February, before the most recent sell-off began. The market has signalled a clear bullish trend, initiating a sharp rise from the 50-day moving average and breaking through the 200-day with determination. In recent days, the price has also exceeded the downward resistance that had been in place since late January. The next target seems to be the $96,000 region, but the broader picture suggests a rally gaining momentum with the potential to challenge all-time highs near $110,000.
News Background
Last week, MicroStrategy acquired an additional 6,556 BTC for $555.8 million at an average price of $84,785 per coin. The company now holds 538,200 BTC, accumulated at an average cost of $67,766. The total investment is estimated at $36.47 billion.
Shares of consumer goods producer Upexi skyrocketed more than sixfold after the company announced that Solana would be adopted as a reserve asset. The company plans to bolster its position in SOL and stake the tokens it possesses.
According to Lookonchain, Mike Novogratz’s Galaxy Digital has exchanged $105 million worth of Ethereum for Solana over the past fortnight.
Paul Atkins has officially been sworn in as the new Chair of the US SEC. He has stated that developing a clear and comprehensible regulatory framework for digital assets is a top priority.
According to Politico, the ECB is concerned that President Trump’s backing of the crypto industry could trigger “financial contagion” and adversely impact the European economy. The regulator is particularly apprehensive about the escalating influence of US dollar-backed stablecoins.
XAU/USD: Reaction at $3,300 Support Zone to Generate Near-Term Direction Signal
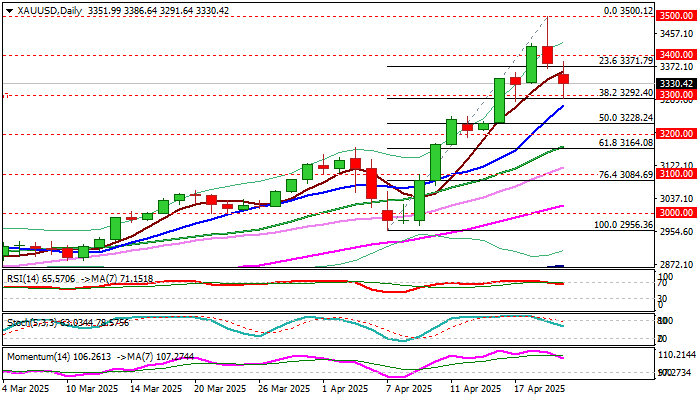
Gold remains in red for the second straight day and hit support at $3300 in early Wednesday, in extension of quick pullback from new record high at $3500, posted on Tuesday.
Significance of $3500 level which many analysts saw as 2025 target and strongly overbought daily studies contributed to profit-taking that pushed the price around $200 in past 24 hours.
Significant change in President Trump’s rhetoric over tariffs on China’s imports, in which he greatly eased tensions by signaling much lower tariffs, as well as comment that there was no plan to fire Fed Chair Powell, resulted in fresh pressure on gold price.
Pullback from new all-time high so far found a solid ground at $3300 zone (psychological/Fibo 38.2% of $2956/$3500 upleg/rising daily Tenkan-sen) with subsequent bounce suggesting that near-term bears might be running out of steam.
Daily close above 3300 would generate an initial signal of a healthy correction, which was to provide better levels to re-enter larger bullish market.
However, this scenario still needs confirmation, with minimum requirement seen on daily close above broken Fibo 23.6% ($3371) and return and close above $3400.
On the other hand, daily RSI emerged from overbought territory, 14-d momentum is heading south, and both indicators show more space at the downside that keeps in play risk of further easing.
Key factors that will influence gold’s direction in the near term will be the magnitude of change in market sentiment over Trump’s latest much softer and reconciliating tone.
On the other hand, persisting geopolitical tensions and growing concerns over predominantly negative economic outlook (IMF slashed its outlook for US and global growth, although denied immediate threats of recession for the US) are expected to continue to fuel safe haven demand.
From that perspective, gold price is likely to resume its rally after a brief pause, with firm break of $3500 to open the door towards $4000, which many already see as next target.
Levels to be watched below $3300 are $3228 and $3200, while upper pivots lay at $3371 and $3400, guarding $3430 and $3500.
Res: 3371; 3400; 3430; 3500.
Sup: 3300; 3285; 3228; 3200.
Gold Price Plunges After Climbing to $3,500 for the First Time
As the XAU/USD chart shows:
- Yesterday, the spot gold price stopped just a few cents short of the key psychological level of $3,500 (and even exceeded it on the futures market);
- But this morning, an ounce is trading around $3,300, having dropped aggressively by more than 5%.
Why Did Gold Suddenly Drop?
The sharp decline followed a shift in rhetoric from President Trump. According to Reuters:
- The US President backed away from threats to dismiss Federal Reserve Chair Jerome Powell;
- He also signalled a more moderate stance on tariffs against China.
Market participants interpreted this as a reason to take profits on long positions, as the softened tone from the White House reduced demand for safe-haven assets. As a result, gold collapsed from its historic high, while the US dollar index rebounded from multi-month lows.
Technical Analysis of the XAU/USD Chart
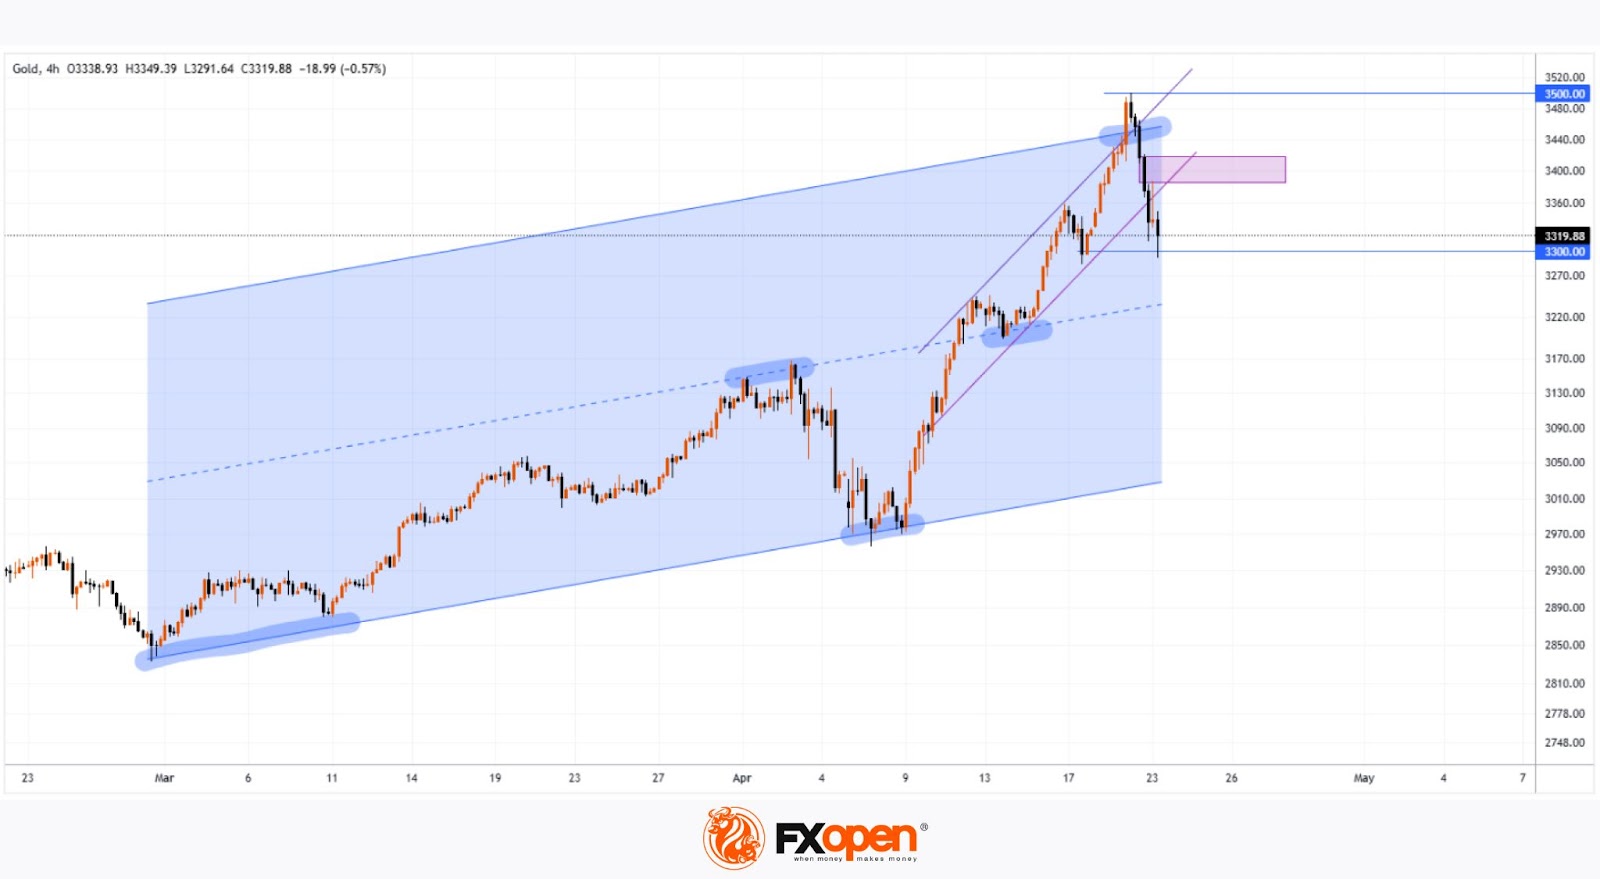
Gold price fluctuations have formed an upward channel (highlighted in blue), with key reversal points marked for constructing the channel. From this perspective, one interpretation is that the upper boundary marked a price area where gold was extremely overbought. Now, the imbalance in market sentiment may be driving the price back towards the median, where supply and demand tend to stabilise.
And although the $3,300 level is currently acting as support, the XAU/USD chart reveals several signs suggesting that bears are taking control:
- The price has dropped by approximately $200 in less than two days;
- A bearish Fair Value Gap has formed during the decline (highlighted by a rectangle) – a pattern typically interpreted as sellers outweighing buyers;
- The steep purple ascending channel has been broken.
It can be assumed that even if the fundamental backdrop offers reasons for a short-term price recovery, this may prove to be only a temporary bounce following a sharp shift in sentiment towards bearishness at the start of the current week.
Start trading commodity CFDs with tight spreads. Open your trading account now or learn more about trading commodity CFDs with FXOpen.
This article represents the opinion of the Companies operating under the FXOpen brand only. It is not to be construed as an offer, solicitation, or recommendation with respect to products and services provided by the Companies operating under the FXOpen brand, nor is it to be considered financial advice.
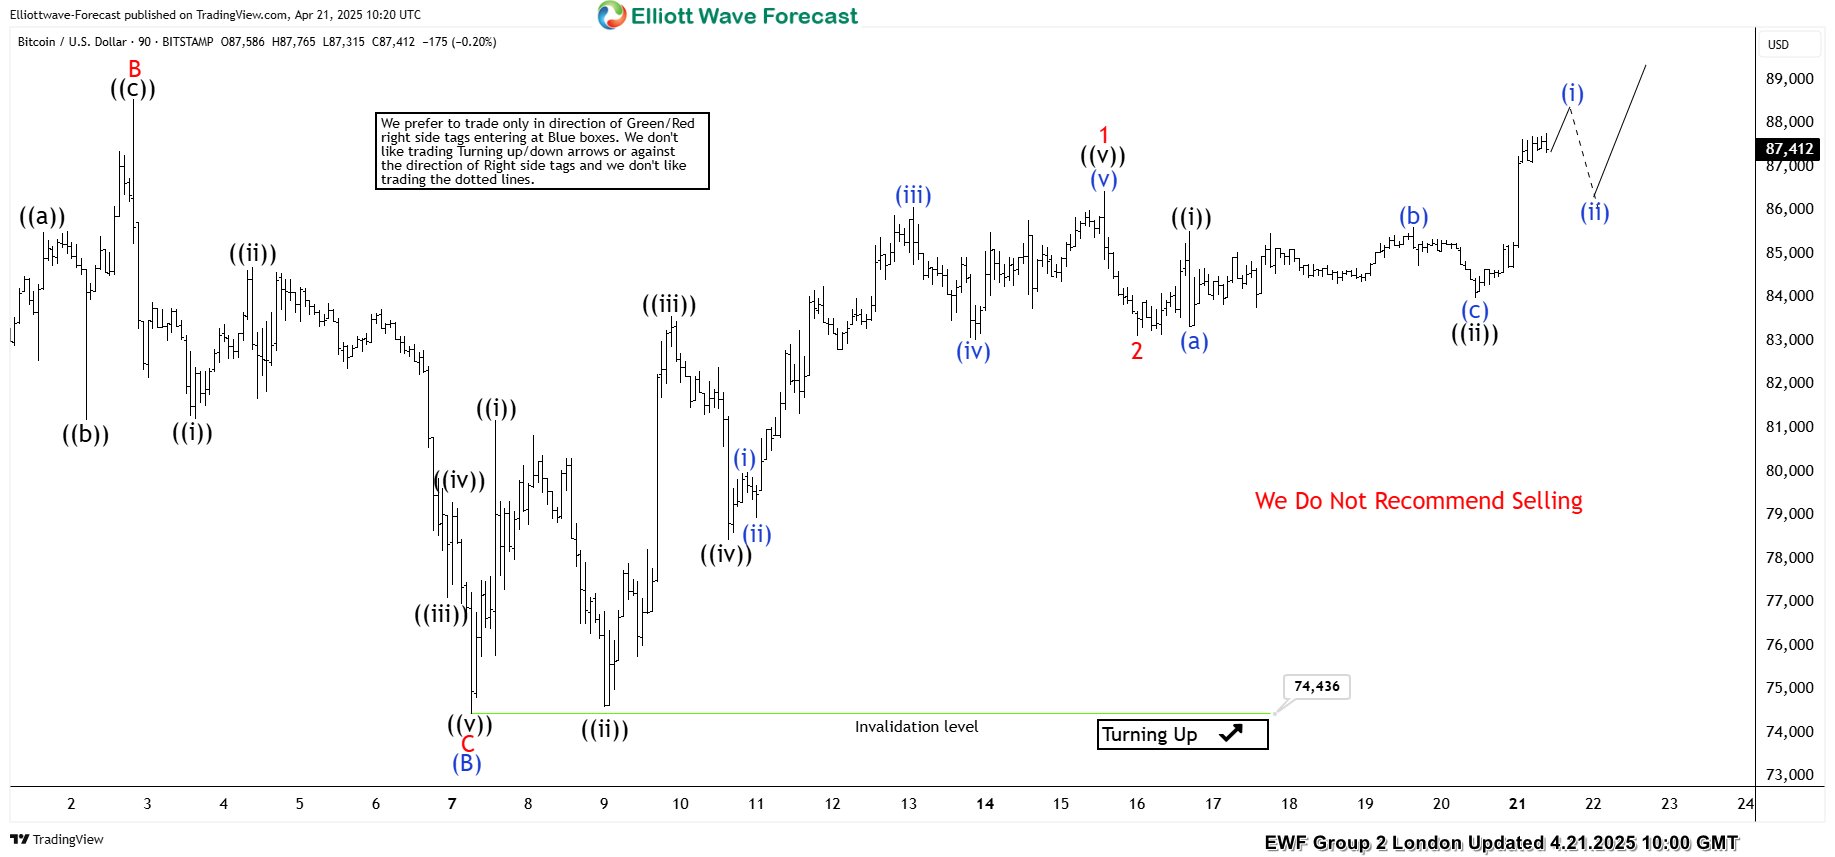
Bitcoin (BTCUSD) Elliott Wave : Bullish Sequences Calling the Rally
Hello fellow traders. In this technical article, we are going to present Elliott Wave charts of Bitcoin BTCUSD . The crypto is showing impulsive bullish sequences in the cycle from the 74436 low calling for further strength. In the following sections, we will delve into the specifics of the Elliott Wave pattern.
BTCUSD Elliott Wave 1 Hour Chart 04.18.2025
The current analysis suggests that BTCUSD is trading within the cycle from the 74436 low. Intraday pull back ((ii)) black is counted completed at the 83035 low. While above that level we expect further strength in the ctypto.
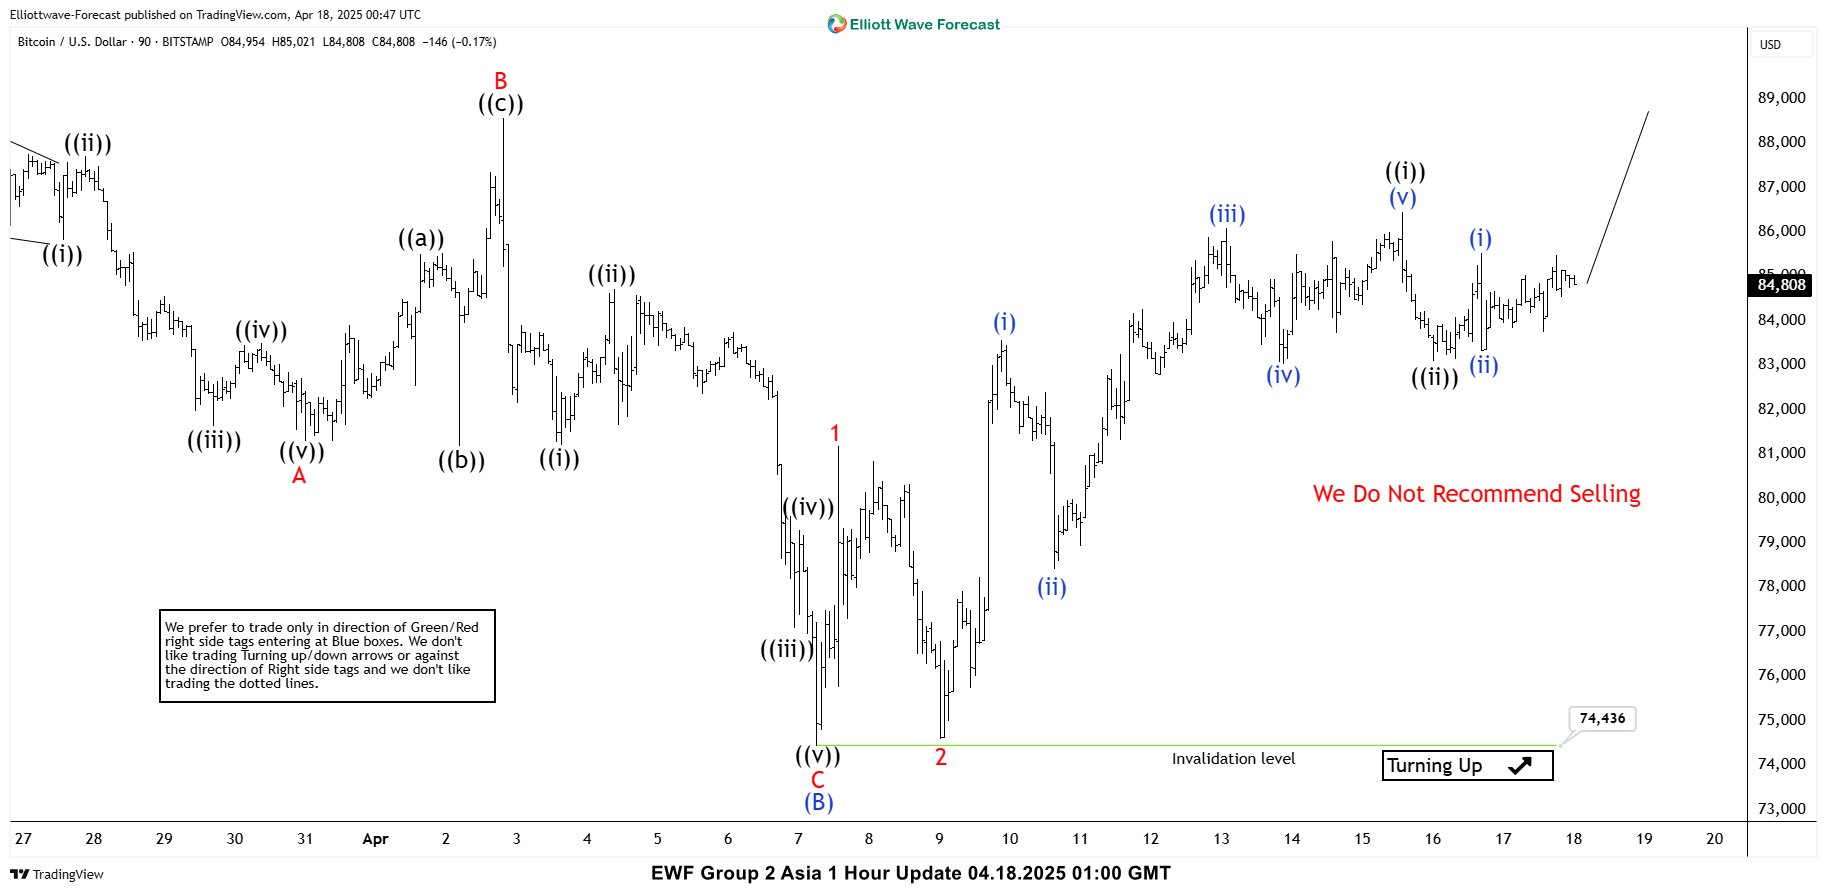
BTCUSD Elliott Wave 1 Hour Chart 04.21.2025
The crypto held above the 74436 low and continued to rally, as expected. The price made break above previous peak and now showing higher high bullish sequences in the cycle from the 74436 , calling for more upside in upcoming days. We do not recommend selling the crypto at this time and favor the long side, targeting 94532-97273 area next.