
Sample Category Title
AUD/USD Daily Report
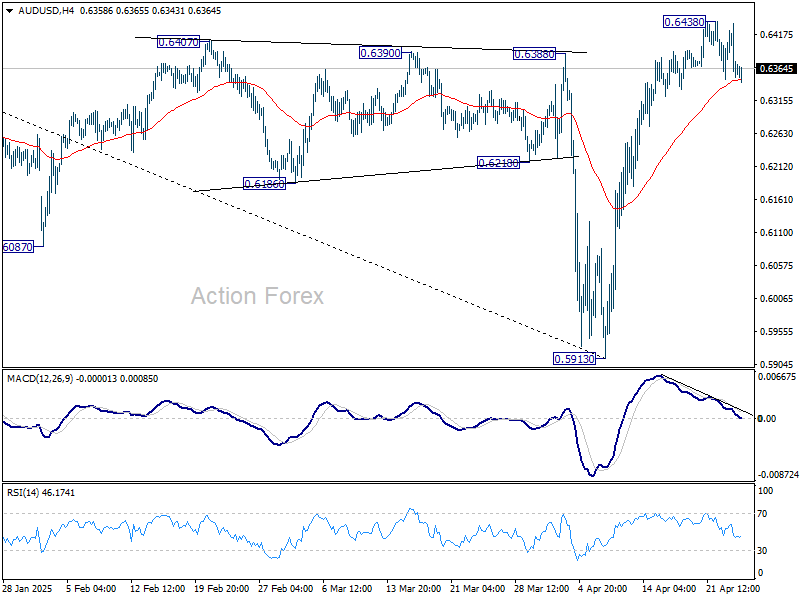
Daily Pivots: (S1) 0.6328; (P) 0.6381; (R1) 0.6414; More...
Intraday bias in AUD/USD remains neutral for consolidations below 0.6438. Further rally is expected as long as 55 D EMA (now at 0.6297) holds. Above 0.6438 temporary top will resume the rebound from 0.5913 to 61.8% retracement of 0.6941 to 0.5913 at 0.6548. However, sustained trading below 55 D EMA will argue that the rebound has completed and turn bias back to the downside.
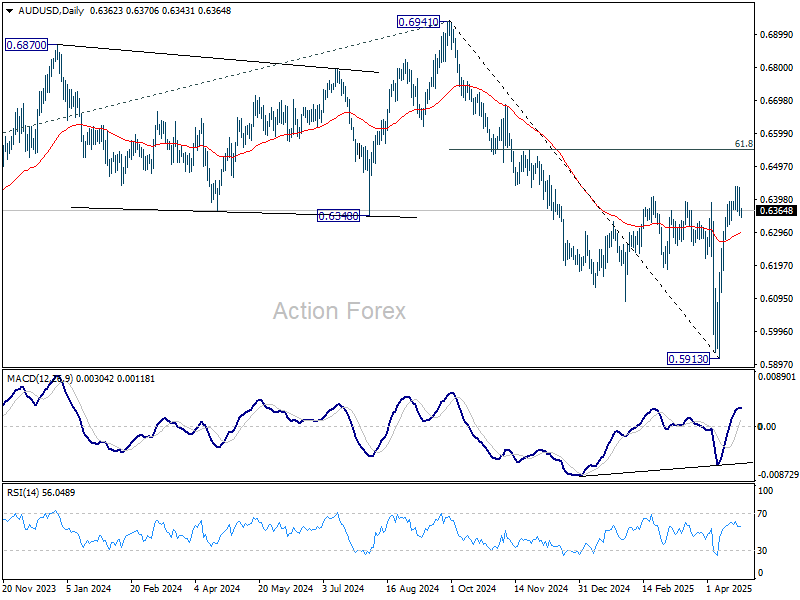
In the bigger picture, fall from 0.6941 (2024 high) is seen as part of the down trend from 0.8006 (2021 high). Next medium term target is 61.8% projection of 0.8006 to 0.6169 from 0.6941 at 0.5806. However, sustained trading above 55 W EMA (now at 0.6443) will argue that a medium term bottom was already formed, and set up further rebound to 0.6941 resistance instead.
Sentiment Remains Fragile on Conflicting Comments
The first half of the week was full of fear and hope. Trump’s frustration with the Federal Reserve (Fed) President Powell and the threat of Powell being removed from his role weighed on sentiment at the start of the week. Meanwhile, the IMF lowered its world growth forecasts sharply pointing at hectic and harmful US trade policy. Equities fell and the US dollar weakened. Gold hit the $3500 mark. Then, mood improved as Trump said he wouldn’t remove Powell from his role and that the triple-digit tariffs on Chinese imports will be pulled ‘substantially’ lower. Equities rallied, the China-sensitive stocks cheered the news more than the others. Apple, for example, jumped nearly 10% from the week low to yesterday’s high point and the dollar index rebounded from the lowest levels in more than three years and the US 10-year yield eased after spiking above the 4.40% mark. Then, Bessent said that there are no plans to lower the Chinese tariffs unilaterally. Concretely, the Trump show continues, optimism is too fragile to call the end of the equity selloff. Futures this morning are pointing at a negative start, the selling pressure is stronger for the US indices than the European peers while the Chinese CSI 300 is flat and the Nikkei is down 1%, testing the 35000 psychological support to the downside as the USJPY trades a touch below 143 after an early attempt to clear the 140 support this week.
Across the pond, the Stoxx 600 remained relatively stable this week compared to the American peers, and the index jumped 1.80% yesterday on potential improvement in trade situation. On the earnings front, the luxury-good makers didn’t have a strong Q1 but SAP, the most valuable European company by market cap, announced a 58% increase to its profit last quarter with a 26% jump to its revenue from cloud products. The share price jumped more than 10% yesterday. Overall, the preference for the European companies continues as the US exceptionalism trade fades. The same is true for the euro. The EURUSD eased this week after trading above the 1.15 level. Yesterday’s softer-than-expected PMI figures certainly weighed on expectations that the massive government spending would boost growth across the euro area, but they also fuelled expectations that the European Central Bank (ECB) will continue to provide support to the underlying economies. Price pullbacks remain interesting opportunities to strengthen long positions in favour of the single currency with the next major target for the bulls standing at the 1.20 mark.
In energy, crude oil’s positive momentum was hit yesterday by the IMF’s sharp downside revisions to global growth forecasts. The outlook remains negative on higher supply and lower demand prospects. Expect solid resistance to the latest rebound approaching the $66.70/67pb range, including the major 38.2% retracement on the first quarter decline and the 50-DMA. Below this price range, crude oil remains in the bearish trend with the possibility of a sustained decline below the $60pb level.
Politics Continue to Push Sentiment
In focus today
Today we receive the German Ifo index, and it will be interesting to see if it shows the same development as the PMIs yesterday. We particularly look out for the Ifo index as it has an expectations component in contrast to the PMI, which should give a better reflection of the trade war impact.
Economic and market news
What happened yesterday
In the US, against all the gloomy signals from the regional Fed indices, the manufacturing index increased to 50.7 (cons: 49.1, prior: 50.2), while the services measure declined to 51.4 (cons: 52.5, prior: 54.4), though it remains in expansionary territory. The composite PMI ticked lower to 51.2 from 53.5 but still signalled growth. Looking into details, export orders indices weakened across both manufacturing and services, while the domestic side appears surprisingly strong. Services new orders weakened slightly to 52.7 from 53.7, whereas manufacturing new orders actually increased to 51.4 from 51.1. All in all, a surprisingly positive PMI report, providing some support to the USD.
Remarks from the Trump administration weighed on markets again yesterday. Reports emerged that Treasury Secretary Bessent and Commerce Secretary Lutnick were the ones who stopped Trump's intentions of firing Powell. Bessent also added colour to the ongoing trade de-escalation talks with China, noting that a full trade deal could take 2-3 years. He stated that a prerequisite for restarting negotiations is lowering tariffs - currently 145% on Chinese goods and 125% on US goods - but emphasized that Trump is unlikely to make that move unilaterally. Rumours also circulated that the White House might consider cutting tariffs on China to as low as 50%, though a White House official dismissed this, clarifying that any tariff announcements would come directly from Trump. Markets turned slightly more optimistic on the back of potential tariff relief, with the probability of a US-China deal before June rising to around 38%, up from 34% prior to the news.
Furthermore, the Financial Times also reported that Trump is considering exempting carmakers from some tariffs following recent lobbying efforts from US auto manufactures.
In the euro area, as expected, the composite PMI ticked lower to 50.1 in April (cons: 50.2, prior: 50.9). Notably, the downtick was surprisingly entirely driven by the services leg, which fell to 49.7 (cons: 50.5, prior: 51.0), whereas the manufacturing counterpart beat expectations, increasing slightly to 48.7 (cons: 47.4, prior: 48.6). With the services sector edging below the 50-threshold, the print supports the narrative of further easing by the ECB as also price pressures were easing in the report. However, looking at details, services employment is still sound at 50.8, indicating that the decline is not as dire as the headline suggests.
Speaking of the ECB, the latest update of their wage tracker continues to signal lower wage growth in 2025, further underscoring the case for additional monetary easing from the ECB. Looking ahead, we continue to expect the ECB to deliver 25bp cuts at the upcoming meetings, bringing the deposit rate to 1.50% by September 2025.
In the UK, April PMIs surprised sharply to the downside across sectors, showing signs of stagflationary tendencies. The composite measure stood at 48.2 (cons: 50.4, prior: 51.5), with services at 48.9 (cons: 51.5, prior: 52.5) and manufacturing at 44.0 (cons: 44.0, prior: 44.9). Price components ticked higher across the board, with both input and output prices increasing at a faster pace in April, while employment indicators moved further into contractionary territory for both services and manufacturing. Hence the more muted growth outlook and higher price components spells trouble for the BoE.
In commodities, oil prices declined by around 2.0% during yesterday's session following news that several OPEC+ members want the cartel to approve another accelerated oil output increase for June - similar in volume to the one agreed for May. Kazakhstan was also out stating that they are not eager to cut output to make up for previous overproduction. Eight OPEC+ countries will convene on 5 May to agree upon the output plan for June. As we expect downward pressure to persist in Q2, we forecast Brent to average USD70/bbl in Q2 and recover to USD85/bbl in Q4.
Equities: Equities rose again yesterday as optimism around US politics gained traction. We saw significant outperformance of cyclical sectors over defensives - across both US and European markets. From a broader perspective, the new market narrative remains intact: a mix of unusual correlations where the long end of the US curve falls, the USD strengthens, and risk assets outperform. The fact that equities rallied sharply on a day when macro data was at best mixed - and arguably disappointing on the services side - underscores the prevailing sentiment. Earnings yesterday came in solid, adding to the positive tone. US equities yesterday Dow +1.1%, S&P 500 +1.7%, Nasdaq +2.5%, Russell 2000 +1.5%. Looking at markets this morning, Asia is trading in the red and futures in both the US and Europe are pointing lower. This seems consistent with the more cautious political signals emerging after the U.S. close yesterday.
FI & FX: Whereas U.S. Treasury Secretary Scott Bessent acknowledged that the current tariff levels of 145% for good from China is not sustainable, he nonetheless held on to the mission of a rebalancing of us economic relationships with other countries. The extremely positive market sentiment lost somewhat of its steam during the speech. The 10y US treasury bond yield rose by 12bp from the lows just ahead of Bessent's comments to a intraday high of 4.39% a couple hours after Bessent left the stage.
USD/CAD Daily Outlook
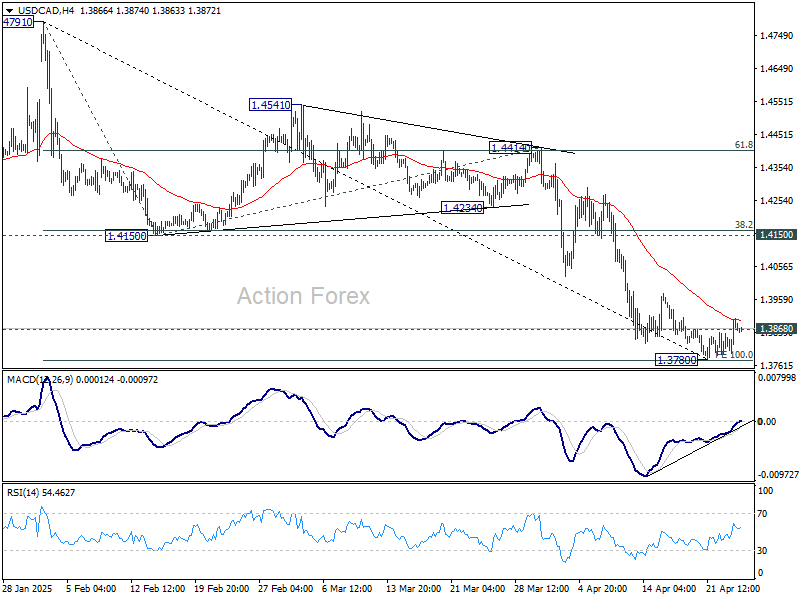
Daily Pivots: (S1) 1.3818; (P) 1.3861; (R1) 1.3925; More...
A short term bottom should be in place at 1.3780, just ahead of 100% projection of 1.4791 to 1.4150 from 1.4414 at 1.3773, and on bullish convergence condition in 4H MACD. Intraday bias in USD/CAD is mildly on the upside for recovery. But upside should be limited by 1.4150 support turned resistance (38.2% retracement of 1.4791 to 1.3780 at 1.4166. On the downside, firm break of 1.3780 will resume the whole fall from 1.4791.
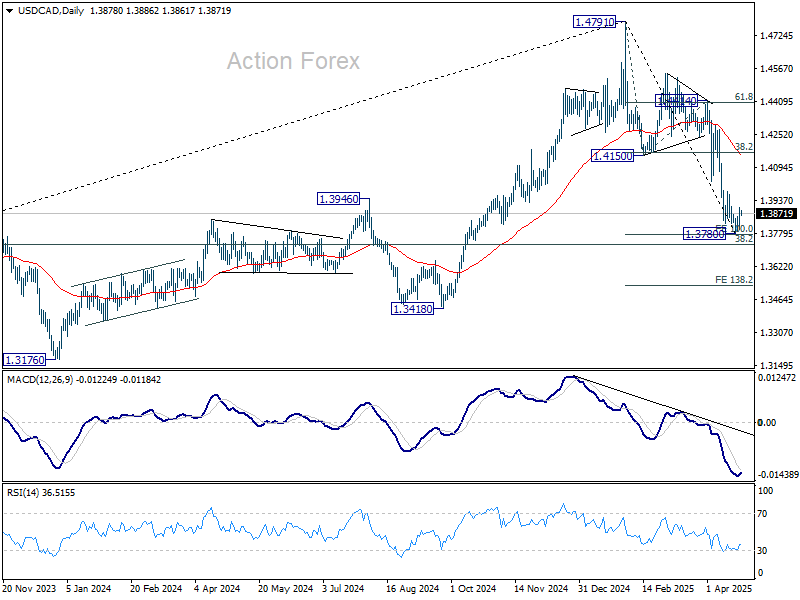
In the bigger picture, the break of 1.3976 resistance turned support (2022 high) and 55 W EMA (now at 1.3982) indicates that a medium term top is already in place at 1.4791. Fall from there would either be a correction to rise from 1.2005, or trend reversal. In either case, firm break of 38.2% retracement of 1.2005 (2021 low) to 1.4791 at 1.3727 will pave the way back to 61.8% retracement at 1.3069.
Markets Pause After Relief Rally, Bessent Tempers De-escalation Optimism
Markets are treading water in the Asian session today, with most asset classes trading mixed and within familiar ranges. While US equities closed higher overnight, much of the early gains were pared back, signaling the fragility of the current risk-on mood. The price action reflects what is often seen during a relief rally—short-lived optimism that fades quickly if underlying uncertainty persists. Hopes of a breakthrough in US-China tariff talks briefly lifted sentiment, but optimism quickly met a dose of reality from Washington.
US Treasury Secretary Scott Bessent pushed back against speculation that President Donald Trump had offered any unilateral gesture to ease tariffs on China. “No unilateral offer—none at all,” Bessent clarified. He acknowledged that current tariff levels are likely unsustainable but stressed that any reduction would have to be mutual. His remarks serve as a reminder that structural obstacles in the trade negotiations remain and that headline-driven rallies may lack staying power.
In the currency markets, price actions are subdued, with all major pairs and crosses trading within yesterday’s ranges. Kiwi is leading gains for the week so far, followed by Dollar and Loonie. On the other side, the safe-haven trio in on the back foot, with Swiss Franc, Yen, and Euro the weakest performers, in line with stabilizing risk sentiment and a broader unwinding of prior defensive flows. Sterling and Aussie are middling.
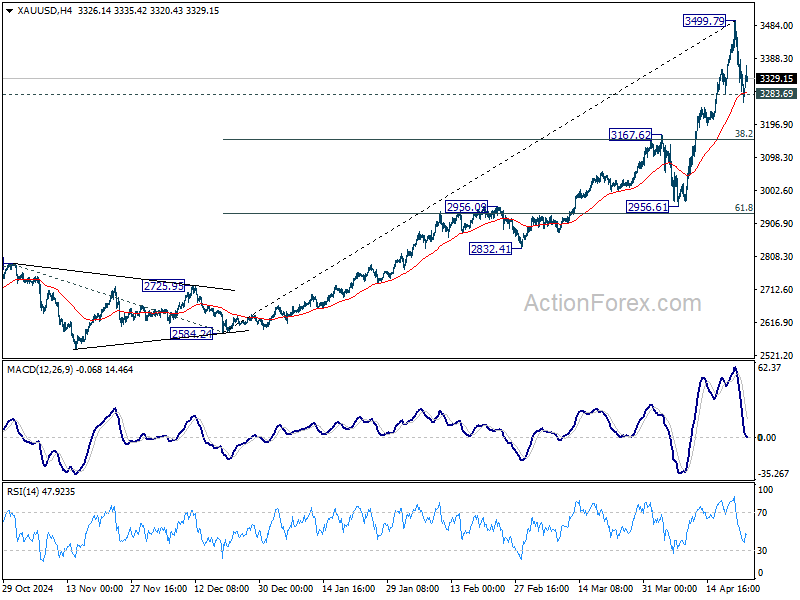
Technically, Gold's breach of 3283.69 minor support indicates short term topping at 3499.79, just ahead of 3500 psychological level. Some consolidations should be seen in the near term, with risk of deeper pullback. But downside should be contained by 3167.62 cluster support (38.2% retracement of 2584.24 to 3499.79 at 3150.04 to bring rebound. Gold's long term up trend is expected to continue after the consolidation completes.
In Asia, at the time of writing, Nikkei is up 0.40%. Hong Kong HSI is down -1.08%. China Shanghai SSE is up 0.06%. Singapore Strait Times is up 0.26%. Japan 10-year JGB yield is up 0.001 at 1.325. Overnight, DOW rose 1.07%. S&P 500 rose 1.67%. NASDAQ rose 2.50%. 10-year yield fell -0.02 to 4.387.
Looking ahead, German Ifo business climate is the main feature in European session. Later in the day, US will release jobless claims, durable goods orders, and existing home sales.
IMF: BoJ may delay rate hike on tariff risk, cacks Yen’s haven role
Nada Choueiri, deputy director of IMF's Asia Pacific Department, told Reuters that BoJ is likely to delay further interest rate hikes as heightened uncertainty from US tariff policy weighs on business sentiment and economic outlook.
She noted that many Japanese firms are now hesitant to move forward with investment plans, opting instead to wait for greater clarity on global trade developments. "This is postponing investment decisions as well," Choueiri said, adding that the downside risks to both growth and inflation have increased.
“We do see that if our reference scenario materializes, the BOJ interest rate increases will be pushed backwards in time,” she said.
Choueiri also commented on the recent appreciation of Yen, reaffirming its role as a "safe-haven currency", supported by the country's economic stability and predictability.
Fed's Beige Book: Stagnant growth, tariff-driven inflation
The latest Fed Beige Book painted a picture of a stagnating US economy, with activity described as “little changed” across most of the country. Of the 12 Districts, only five reported slight growth, while three saw flat conditions and the remaining four noted modest declines.
However, the most striking theme running through the report was the "pervasive" uncertainty around international trade policy, which was highlighted in nearly all Districts as a key concern weighing on sentiment and business planning.
Inflation pressures remain persistent, with half of the Districts describing price growth as moderate and the other half calling it modest. However, many businesses signaled "elevated input cost growth" tied to tariffs, with some already receiving notices from suppliers warning of upcoming price hikes.
In response, firms have started add "tariff surcharge" or shortening their pricing terms. Still, the ability to fully pass on higher costs is proving difficult in some sectors, particularly for consumer-facing sectors where demand remains sluggish.
ECB’s Lane sees Dollar outflows as rebalancing, not the end of dominance
Speaking at an IIF conference overnight, ECB Chief Economist Philip Lane downplayed concerns over recent portfolio shifts away from US Dollar assets, suggesting the move may reflect a normalization rather than a structural retreat.
Lane noted that allocations are likely moving from an overweight position in Dollar-denominated assets toward a more balanced distribution among global currencies.
He pointed out that US assets had been “priced to perfection” following US President Donald Trump’s election last year, making some degree of reallocation expected as valuations adjust.
Lane also addressed recent outflows from U.S. Treasuries, framing them as part of this rebalancing process. “It can either settle down or invite a deeper rethink,” he said, leaving the door open to further shifts depending on global investor sentiment.
However, he admitted that despite the near-term adjustments, Dollar is still expected to far outweigh Euro in most global portfolios.
ECB’s Knot and Muller downplay tariff impacts on inflation and growth
Dutch ECB Governing Council member Klaas Knot noted that the combination of US tariffs, a stronger Euro, and falling energy prices could push eurozone inflation lower than expected in the short term.
“The strong euro, together with falling energy prices, suggests that the near-term impact might not be so inflationary after all,” Knot said. However, he cautioned that medium-term risks remain, especially if global supply chain disruptions intensify. He supported keeping the ECB’s key policy rate within a neutral range of 1.75% to 2.25%, where it currently stands.
Echoing a cautious but measured tone, Estonia’s ECB Governing Council member Madis Muller acknowledged that the US’s evolving trade policy creates “quite a bit more challenging” outlook for the Eurozone. Nevertheless, he maintained that moderate growth remains achievable, albeit at a slower pace than previously anticipated.
Muller added that he is not forecasting a recession, noting that the impact of trade tensions, while significant, is unlikely to derail the region’s economic recovery entirely. Though, he emphasized the need for optionality, suggesting that more accommodation could be warranted if conditions deteriorate
BoE’s Bailey: We must take tariff-related growth risks very seriously
BoE Governor Andrew Bailey emphasized the growing downside risks to UK growth stemming from US President Donald Trump’s tariff policies. Speaking at an IIF conference, Bailey said, “We do have to take very seriously the risk to growth,” highlighting the UK's vulnerability as a highly open economy.
He noted that the impact of U.S. trade measures extends far beyond bilateral ties, influencing the UK through broader disruptions in global trade dynamics.
When asked how much the BoE is factoring in the effects of US trade policy, Bailey confirmed that the issue is front and center. “We're currently working through that because we've got an interest rate decision coming in two weeks' time,” he said.
USD/CAD Daily Outlook
Daily Pivots: (S1) 1.3818; (P) 1.3861; (R1) 1.3925; More...
A short term bottom should be in place at 1.3780, just ahead of 100% projection of 1.4791 to 1.4150 from 1.4414 at 1.3773, and on bullish convergence condition in 4H MACD. Intraday bias in USD/CAD is mildly on the upside for recovery. But upside should be limited by 1.4150 support turned resistance (38.2% retracement of 1.4791 to 1.3780 at 1.4166. On the downside, firm break of 1.3780 will resume the whole fall from 1.4791.
In the bigger picture, the break of 1.3976 resistance turned support (2022 high) and 55 W EMA (now at 1.3982) indicates that a medium term top is already in place at 1.4791. Fall from there would either be a correction to rise from 1.2005, or trend reversal. In either case, firm break of 38.2% retracement of 1.2005 (2021 low) to 1.4791 at 1.3727 will pave the way back to 61.8% retracement at 1.3069.
Lock it in: RBA to Cut 25bps in May
Lock it in, no need to wait for the CPI: RBA Monetary Policy Board expected to cut by 25bps at its 20 May meeting.
For the past several quarters, the near-term outlook for RBA policy has been data-driven. This makes it tricky to predict what the Monetary Policy Board will decide beyond the upcoming meeting. You cannot be sure until you have seen the latest data. For example, had the Q4 2024 trimmed mean inflation not surprised on the downside, the Board would probably have remained on hold at the February 2025 meeting. The turmoil abroad has, however, changed the game and flipped the risks. You can lock in a 25bp cut in May, even if the Q1 inflation data are a shade disappointing.
A few months ago, the RBA’s main concern was that a still-tight labour market would keep domestic inflation pressures sticky. The risk was that the last 0.2% of inflation – the difference between their February forecasts for trimmed mean inflation and their goal of 2.5% – would not be eliminated.
Our analysis of the situation has for some time been that the RBA would nonetheless continue to cut rates at a moderate pace, as the data flow continued to surprise it on the dovish side, as has been the case recently. Wages growth has already undershot the RBA’s February forecasts and the labour market looked a bit less strong in February and March. We take particular note of the business survey indicators of labour market tightness, which have taken another leg down in the first quarter of 2025, after stalling in the second half of last year.
In addition, the RBA’s forecasts for consumption growth over 2025 still look very strong relative to the view of other observers, including our own forecasts. As that bullish view is challenged by the data flow, including next week’s retail sales release, we expected the RBA to revise its view of the outlook, and so the appropriate policy response.
Without the developments abroad though, the risks around this base case view were skewed to the upside. Given the RBA’s analysis of the economy, it was more likely that they would cut less or more slowly than our base case, than that they would go faster.
Now, however, uncertainty has escalated to a whole new level and the risks have completely flipped. Even though we do not expect the US administration to implement tariffs at the rates originally announced, some damage has already been done. Global growth – and especially US growth – will be slower; the response of China will be disinflationary for the world outside the US; and uncertainty is likely to delay decisions on some investment projects.
For this reason, we lock in our view that the Board will cut the cash rate by 25bps to 3.85% on 20 May. Holding rates steady in the face of the global turmoil and softer momentum in the labour market – for the sake of 0.2ppts on inflation – would be very hard to explain.
For the time being, we continue to expect a total of three further cuts (75bps in total), including the cut in May, with August and November pencilled in for the other two cuts. However, the risks on timing and extent are now skewed to the RBA moving faster than this and / or going further.
We do not regard an inter-meeting cut or a 50bp cut as plausible, contrary to some of the more breathless commentary. As we have been highlighting for some time, Australia is relatively less affected by US tariffs than some economies, and the hit to domestic growth is expected to be moderate. While the risks have clearly shifted to the dovish side, we do not expect the RBA’s thinking to pivot directly from cutting reluctantly if at all, to going hard in May and signalling more. To do so would look panicky and is contrary to the limited RBA communication since the ‘Liberation Day’ tariff announcements, which was much more circumspect.
If the Board were to do something other than cut by 25bps in May, it might consider a 35bp move to 3.75%, and round quarter-point levels of the cash rate. To be clear, we regard this as a very outside chance. The RBA has long emphasised that quarter-point neatness is not a consideration for policy. (It was, after all, me in my old job who would theatrically exclaim ‘we don’t care!’ whenever I was asked about getting the cash rate back to round quarter points. Nowadays I just change the pronoun and exclaim ‘they don’t care!’.) But there is one slight niggle to that understanding: the RBA is implementing a revised ‘ample reserves’ model for monetary policy implementation, and from May will no longer announce the exchange settlement funds rate as part of its policy announcements. So, if they were ever going to move back to a cash rate level at round quarter-points, the upcoming meeting is a good time to do it.
Again, though, this is a very outside chance. Lock in the 25bp move in May, and be ready to pivot thereafter should the overseas news worsen.
US-China De-escalation Optimism Fades with Bearish Technical Elements in US Stock Indices
It was another day of trade tariffs “drama” within the US White House administration. Yesterday, 23 April, the Wall Street Journal reported that the White House is considering cutting the steep tariffs on Chinese imports by more than 50%.
However, US Treasury Secretary Bessent later clarified that President Trump has not made any unilateral offer to remove tariffs on Chinese imports.
Optimism over US-China trade de-escalation has faded. Although major US indices—S&P 500, Nasdaq 100, Dow Jones, and Russell 2000, posted gains of 1.5% to 2.3% on 23 April, they all closed near session lows.
Both the S&P 500 and Dow formed bearish “Shooting Star” candlestick patterns after retesting their 20-day moving averages, signalling possible exhaustion of bullish momentum seen in the last two days.
Meanwhile, US Treasury Secretary Bessent stated there are “no currency targets” in trade talks with Japan, with the focus remaining on trade imbalances. USD/JPY slipped 0.5% in the Asian session to 142.70, following a 1.3% gain the previous day.
After two days of losses, Gold (XAU/USD) is trading higher in today’s Asian opening session with an intraday gain of 2.1% on the backdrop of conflicting US White House’s trade tariffs policy implementation.
West Texas crude oil fell 2% yesterday after a Reuters report stated that several OPEC+ members may suggest that the cartel accelerate oil output increases for a second month in June.
Economic data releases
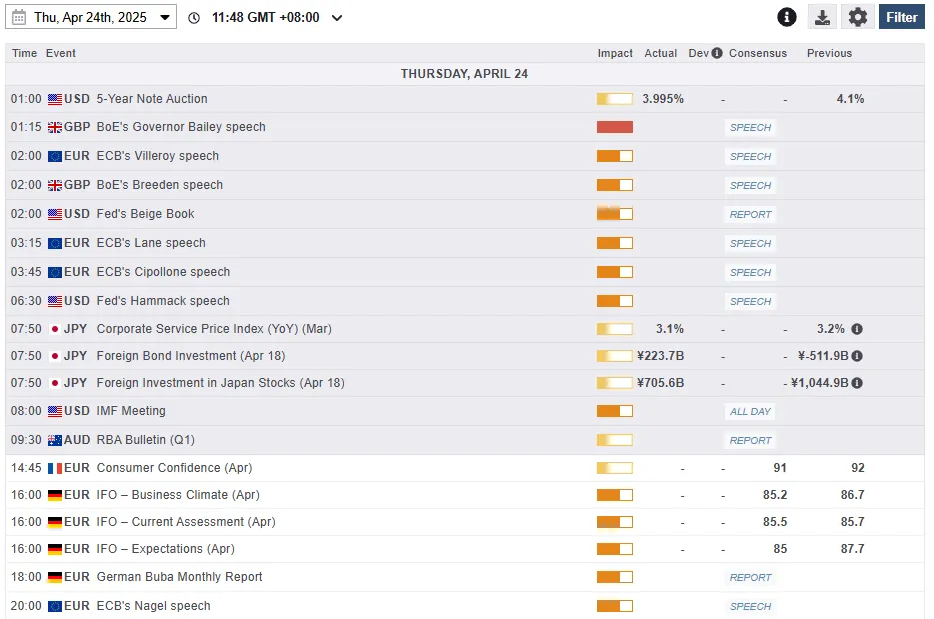
Fig 1: Key data for today’s Asian mid-session (Source: MarketPulse)
Chart of the day – US Wall Street 30 (DJIA) bearish reaction at 20-day MA
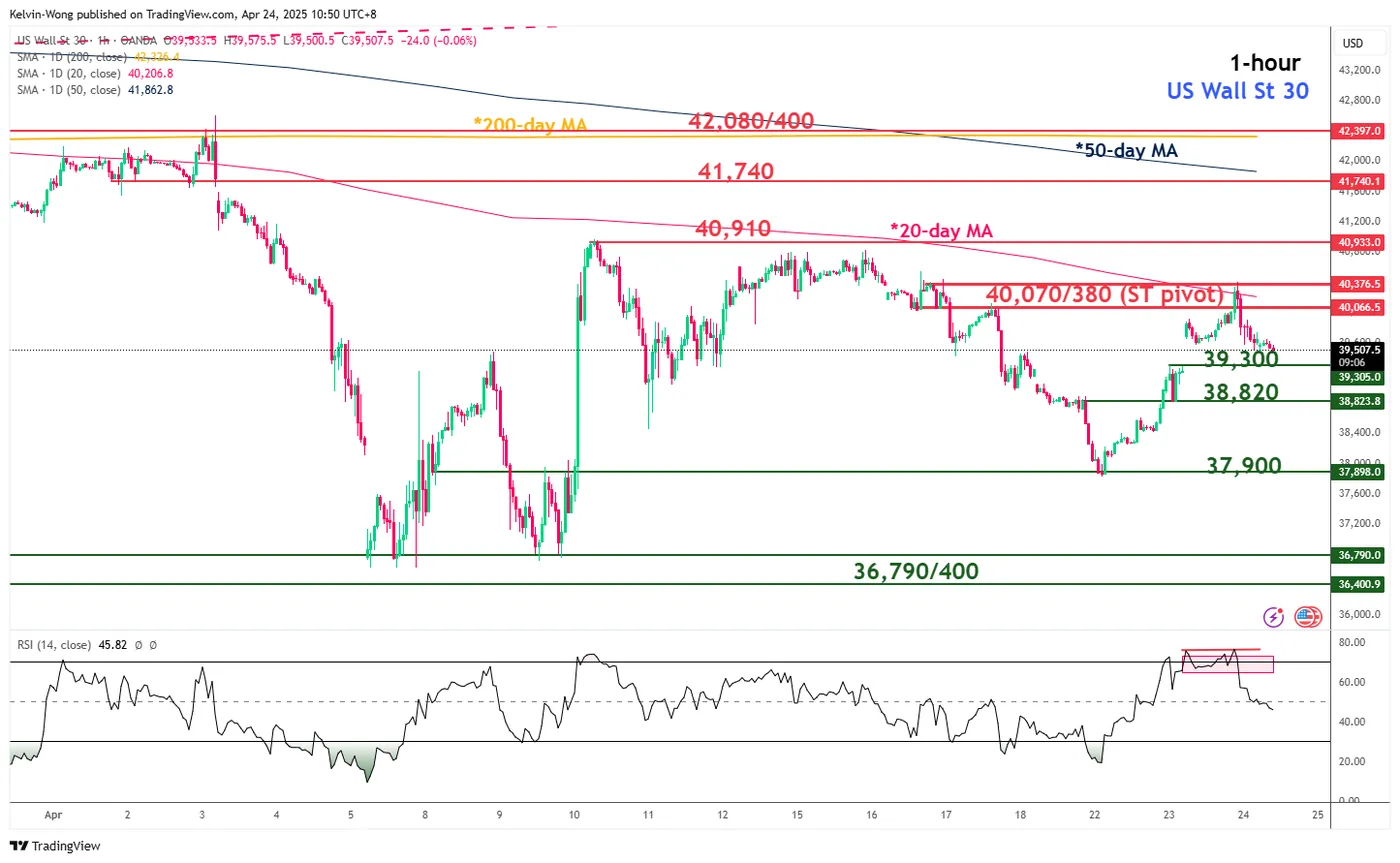
Fig 2: US Wall Street 30 CFD Index minor trend as of 24 Apr 2025 (Source: TradingView)
The price actions of the US Wall Street 30 CFD have staged a bearish reaction yesterday, 23 April, right at its 20-day moving average, which has coincided with the 40,070/40,380 key short-term pivotal resistance zone.
In addition, the hourly RSI momentum indicator has also exited its overbought region with a bearish divergence condition that suggests the prior upside momentum seen on last two days has waned.
A break below the 39,300 near-term support (the gap-up formed on Wednesday, 23 April) exposes the next intermediate supports at 38,820 and 37,900 in the first step.
On the other hand, a clearance above 40,380 invalidates the bearish tone for a potential continuation of the minor mean reversion rebound sequence to see the next intermediate resistances coming in at 40,910 and 41,740 (also the 50-day moving average).
IMF: BoJ may delay rate hike on tariff risk, backs Yen’s haven role
Nada Choueiri, deputy director of IMF's Asia Pacific Department, told Reuters that BoJ is likely to delay further interest rate hikes as heightened uncertainty from US tariff policy weighs on business sentiment and economic outlook.
She noted that many Japanese firms are now hesitant to move forward with investment plans, opting instead to wait for greater clarity on global trade developments. "This is postponing investment decisions as well," Choueiri said, adding that the downside risks to both growth and inflation have increased.
“We do see that if our reference scenario materializes, the BoJ interest rate increases will be pushed backwards in time,” she said.
Choueiri also commented on the recent appreciation of Yen, reaffirming its role as a "safe-haven currency", supported by the country's economic stability and predictability.
Fed’s Beige Book: Stagnant growth, tariff-driven inflation
The latest Fed Beige Book painted a picture of a stagnating US economy, with activity described as “little changed” across most of the country. Of the 12 Districts, only five reported slight growth, while three saw flat conditions and the remaining four noted modest declines.
However, the most striking theme running through the report was the "pervasive" uncertainty around international trade policy, which was highlighted in nearly all Districts as a key concern weighing on sentiment and business planning.
Inflation pressures remain persistent, with half of the Districts describing price growth as moderate and the other half calling it modest. However, many businesses signaled "elevated input cost growth" tied to tariffs, with some already receiving notices from suppliers warning of upcoming price hikes.
In response, firms have started add "tariff surcharge" or shortening their pricing terms. Still, the ability to fully pass on higher costs is proving difficult in some sectors, particularly for consumer-facing sectors where demand remains sluggish.
BoE’s Bailey: We must take tariff-related growth risks very seriously
BoE Governor Andrew Bailey emphasized the growing downside risks to UK growth stemming from US President Donald Trump’s tariff policies. Speaking at an IIF conference, Bailey said, “We do have to take very seriously the risk to growth,” highlighting the UK's vulnerability as a highly open economy.
He noted that the impact of U.S. trade measures extends far beyond bilateral ties, influencing the UK through broader disruptions in global trade dynamics.
When asked how much the BoE is factoring in the effects of US trade policy, Bailey confirmed that the issue is front and center. “We're currently working through that because we've got an interest rate decision coming in two weeks' time,” he said.