Sample Category Title
Trade Tensions, Earnings Reports, and Dow Jones Analysis
U.S. stock futures dropped on Thursday as a short-lived rally faded. Investors weighed the unpredictable trade moves by the Trump administration and mixed corporate earnings reports.
Stocks are having a hard time building on Wednesday's rally, which was driven by hints that President Trump may be softening his tough stance on trade and the Federal Reserve. Investors are struggling to keep up with the administration's announcements and Trump's changing positions on tariffs.
While a deal with China remains a possibility, markets still see this as some way off for now with neither side willing to look weak ahead of a potential negotiation. Chinese authorities this morning said that If the US really wants to resolve the issue, it should lift all unilateral tariff measures against China.
Further developments on this front in the US session could either hurt or help sentiment and will be worth monitoring.
On the earnings front, IBM shares dropped 8% in U.S. premarket trading after disappointing results missed high expectations. In Europe, traders navigated a wave of earnings, with Unilever rising on better-than-expected sales, while BNP Paribas fell due to a profit decline.
Procter & Gamble lowered its yearly sales and profit forecasts on Thursday after reporting a larger-than-expected drop in third-quarter sales. This happened as consumers cut back on spending due to economic uncertainty and the ongoing trade war.
Investors are keeping an eye on trade updates and a packed schedule of results from major companies like Procter & Gamble, Merck, and Alphabet for more market direction.
Something which I found interesting is Deutsche Bank strategists cutting their year-end S&P 500 target by 12%, blaming the impact of tariffs on U.S. companies. The new target of 6,150 points offers a 14% potential increase from Wednesday’s close but only allows the index to recover losses since its peak in February.
For a full update on the Japanese Yen, please read Japanese yen rebounds after corporate service inflation beats estimate
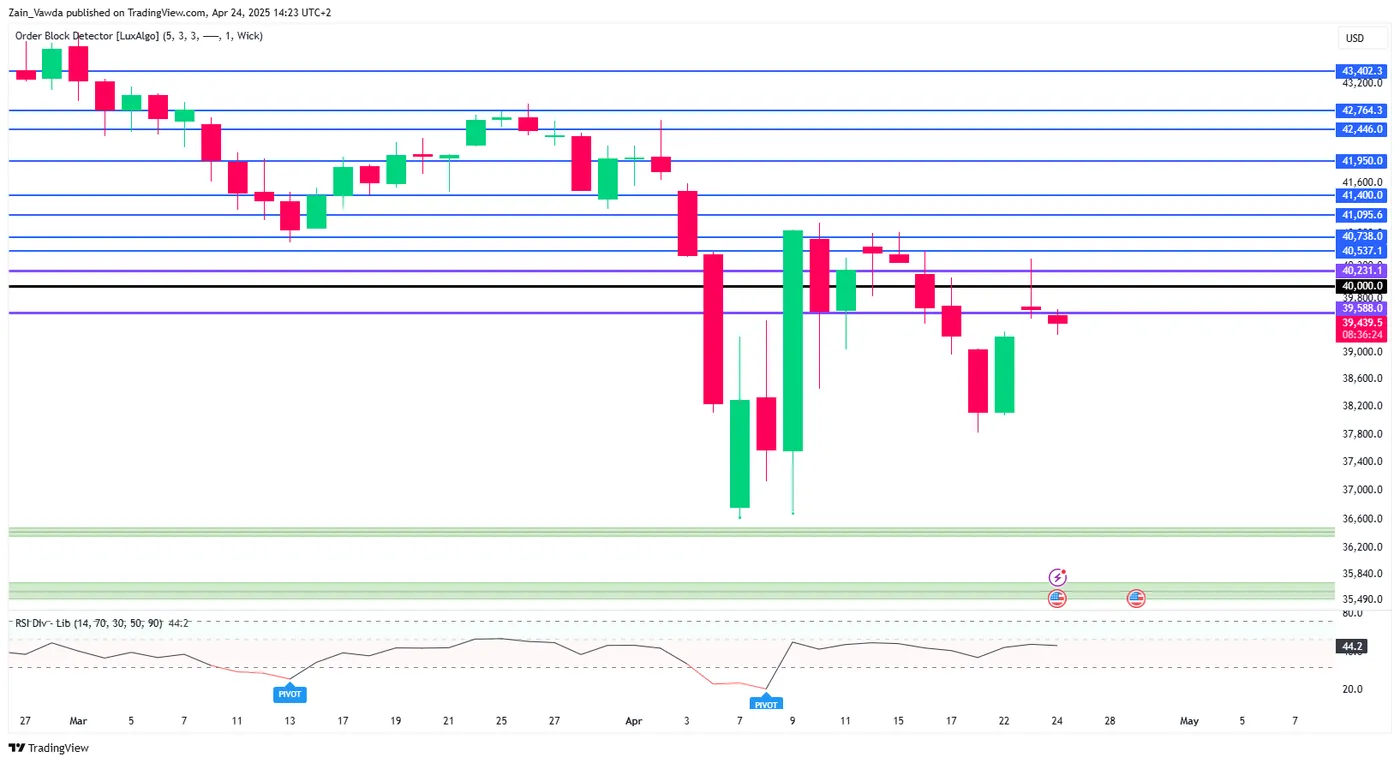
Economic data releases
For now focus will shift to earnings but may still be overshadowed by tariff developments.
March data on durable goods, home sales, and weekly jobless claims will be closely watched for insights into the economy. Minneapolis Fed President Neel Kashkari is also set to speak later today.
For all market-moving economic releases and events, see the MarketPulse Economic Calendar. (click to enlarge)
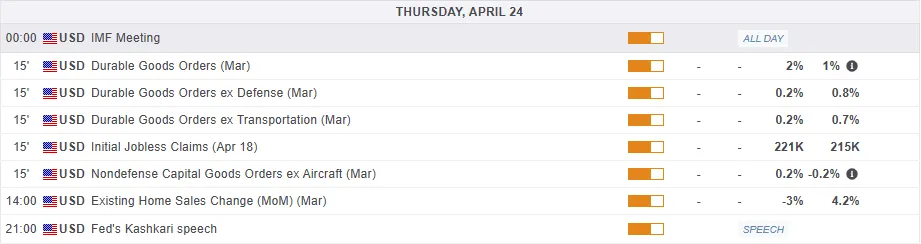
Chart of the day - Dow Jones Index (DJIA)
From a technical standpoint, the Dow Jones printed a significant shooting star rejection candle at a key resistance area around the 40000 mark.
The drop continued today to bridge the price gap created on Tuesday with the index’s next move up in the air.
Price action remains mixed while yesterday's pullback means that the RSI also remains bearish and below the neutral 50 mark.
Immediate support rests at 39232 before the 38472 and 38100 handles come into focus.
Immediate resistance rests at 39588 before the key 40000 handle and 40537 handles come into focus.
Dow Jones Daily Chart, April 24, 2025
Source: TradingView.com (click to enlarge)
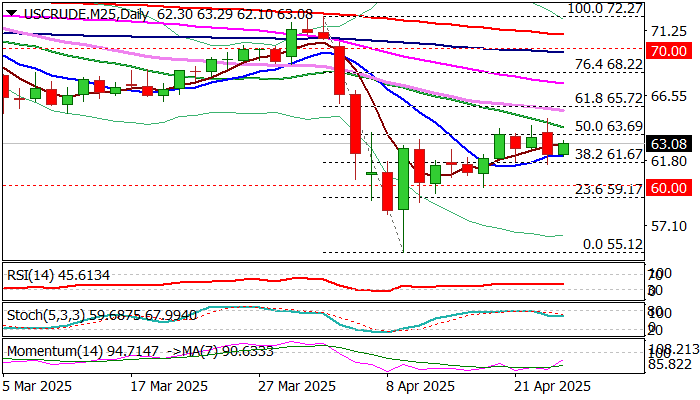
WTI Oil: Recovery Faces Strong Headwinds at Key Fibo Barrier
WTI oil edged higher on Thursday and recovered part of losses of previous day (down 2.4% for the day) after OPEC signaled further output increase from June.
Limited recovery remains weighed by signals of further supply increase and with still unclear situation with tariffs, after calmer tones were heard from the US President yesterday.
Overall picture is also clouded by weak global economy (IMF in its latest report downgraded outlook) with further output increase to add to negative factors.
Near-term price action shows that recovery from 4-year low ($55.12) faces strong headwinds at significant Fibo barrier at $63.69 (50% retracement of $72.27/$55.12 bear-leg), reinforced by daily Kijun-sen), with four consecutive rejections at this zone, indicating possible stall.
Daily studies are predominantly negative and support this scenario, however breach of boundaries of recent range which extends into fifth day (Fibo 38.2% at $61.67 and 50% at 63.69) will be required to define near term direction.
Res: 63.69; 64.21; 64.85; 65.22
Sup: 62.14; 61.67; 60.00; 59.17
S&P500 (SPX) Elliott Wave Forecasts Amid Tariff Uncertainties
There has been a back and forth regarding the tariff headlines as traders and investors are clouded in uncertainties. Clearly, the economic war has narrowed to a face-off between the US and China. Meanwhile, if we take our eyes away from the headlines, what’s price telling us? In this article, we will use the Elliott wave theory to discuss the possible paths the S&P500 (SPX) could take in the coming weeks.
Early in April, the US President, Donald Trump announced the largely anticipated tariff plans. Shortly afterwards and days after, most assets especially the risk assets started to bleed. Investors panicked and converted to cash until the dust settled. Afterwards, cash flows went into precious metals especially Gold which saw some of it’s biggest gains in the last 100 years. Gold reached record highs multiple times while the US Indices faltered.
However, before the sell-off on the US Indices – S&P500 (SPX) and others, we had anticipated that the bullish cycle from October was getting completed. Thus, we warned members in our live sessions. However, we expected the expected decline to correct the cycle from August 2024 and then turn higher but the trade war impact had forced prices much lower to now correct the bigger bullish cycle from October 2022. In the Elliott wave terms, the bullish cycle from October 2022 marked the start of the wave ((III)) grand supercycle degree. From the lows of October 2022, price completed an impulse sequence for wave (I) of ((III)) in February 2025. Thus, from the high of February, wave (II) emerged. We intended to buy wave (II) if it completed a 3 or 7 swing structure.
SPX: A typical 3 or 7 swing pullback for (II)?
The first impact from the February high was a clear 3-swing decline that ended at the extreme area where we recommended members should buy for some profit.. Price rallied from the extreme as expected. Members reached the first target and are running a risk-free trade after taking partial profit. Going forward, the debate is whether the rally will be corrective or impulsive toward the February high. The chart below shows the scenario where wave ((II)) already finished at the April 2025 low.
SPX H4 – Ist Scenario
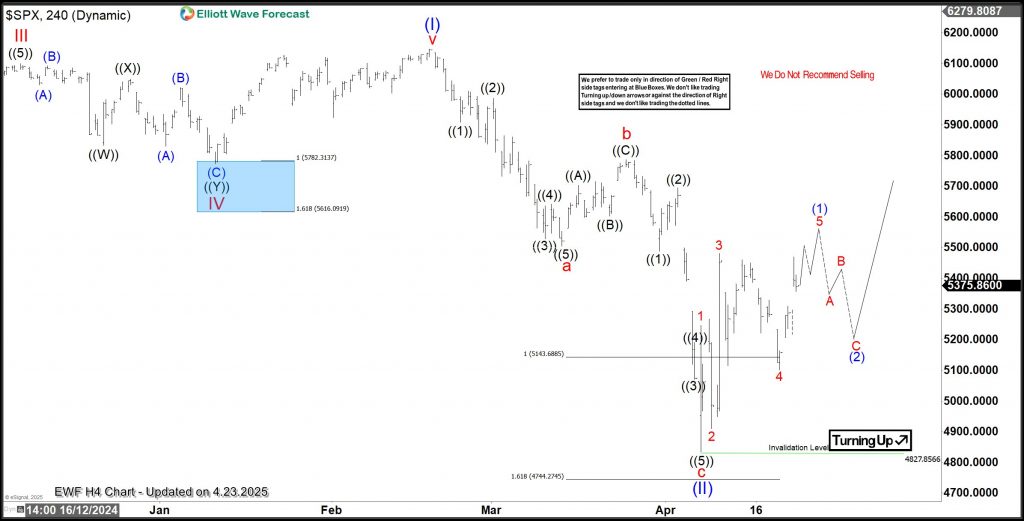
The chart above shows wave (II) may have ended at the April low and the recovery should emerge higher for wave (III) above the February high. If the tariff risks de-escalate, this scenario should work and buyers push higher. However, to add to our long position, we like to see the rebound from April complete a 5-swing. If wave (1) ends with a 5-wave structure, then we can buy the next 3/7 swing pullback from the blue box and join buyers as they push further. However, if the tariff risks escalate, then SPX could push lower from higher prices as the second scenario below shows.
H4 – 2nd Scenario
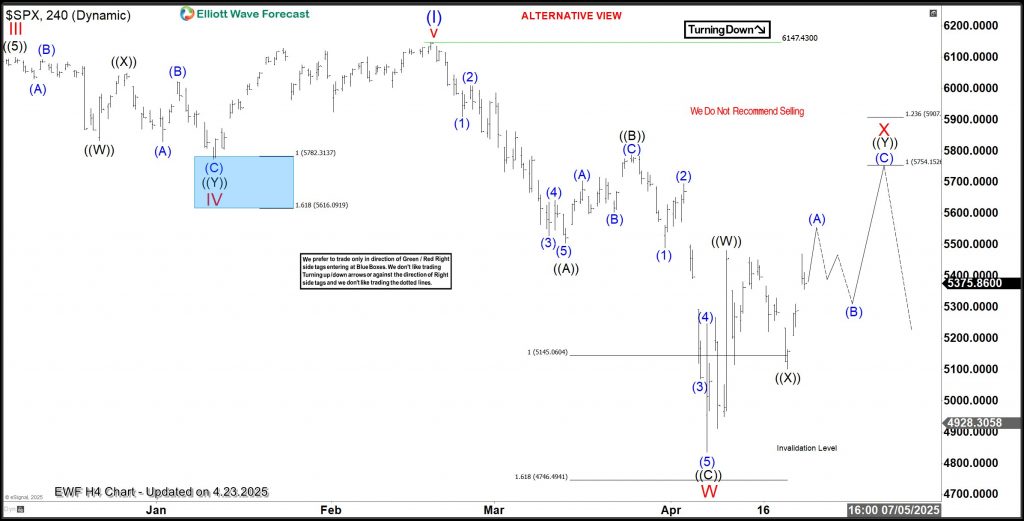
The H4 chart above indicates that wave (II) may develop lower for a deeper 7-swing structure. Corrective structures evolve as 3, 7 or 11 swing sequences. The 3-swing sequence ended wave W. However, the current reaction from the April low can also be interpreted as a a corrective – 7-swing in wave X of (II). Thus, price may still push higher to 5754 or thereabout and then turn sharply lower again. A break below the 4827 low will confirm this scenario. If this happens, we will look to buy lower at the extreme of the 7-swing structure. However, if price breaks below 4827, we could take short term shorts from the extreme of 3 or 7 swing bounces toward the next extreme for wave (II).
No matter what happens between the US and China in the coming days, weeks or months, we already mapped out how we will like to trade SPX. We don’t even need to follow the headlines let alone trading them. All will need is the price action, our Elliott wave skills and our proprietary blue box.
EUR/USD Mid-Day Outlook
Daily Pivots: (S1) 1.1269; (P) 1.1354; (R1) 1.1401; More...
Intraday bias in EUR/USD remains mildly on the downside, and pullback from 1.1572 short term top could extend lower. But downside should be contained by 38.2% retracement of 1.0176 to 1.1572 at 1.1039. On the upside, break of 1.1572 will resume larger up trend.
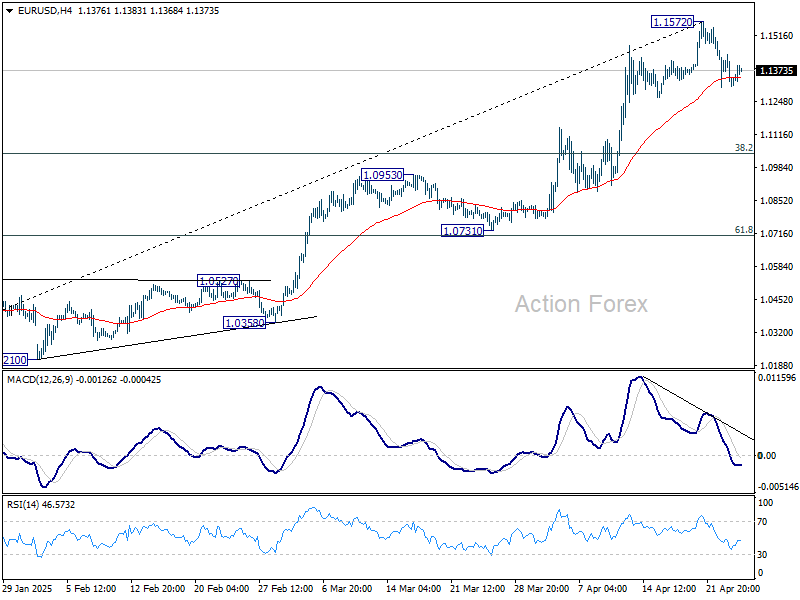
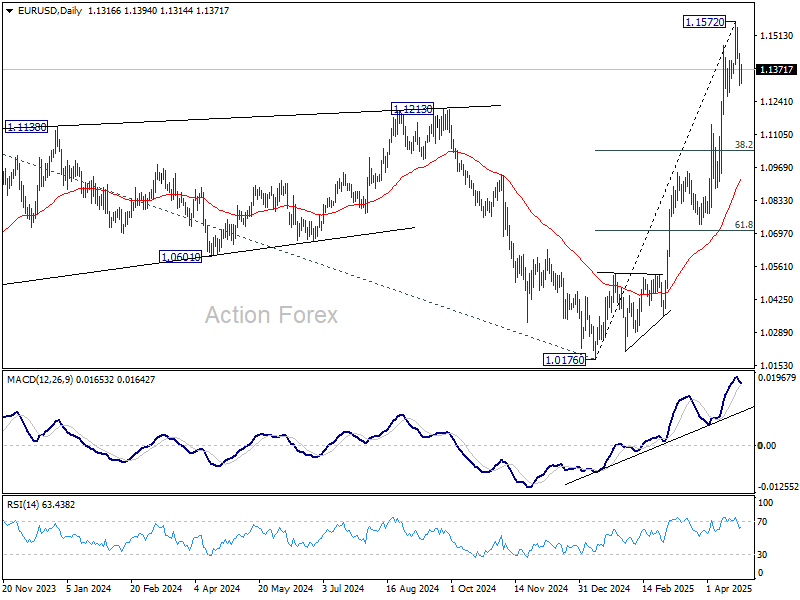
In the bigger picture, rise from 0.9534 long term bottom could be correcting the multi-decade downtrend or the start of a long term up trend. In either case, further rise should be seen to 100% projection of 0.9534 to 1.1274 from 1.0176 at 1.1916. This will now remain the favored case as long as 55 W EMA (now at 1.0776) holds.
GBP/USD Mid-Day Outlook
Daily Pivots: (S1) 1.3212; (P) 1.3276; (R1) 1.3319; More...
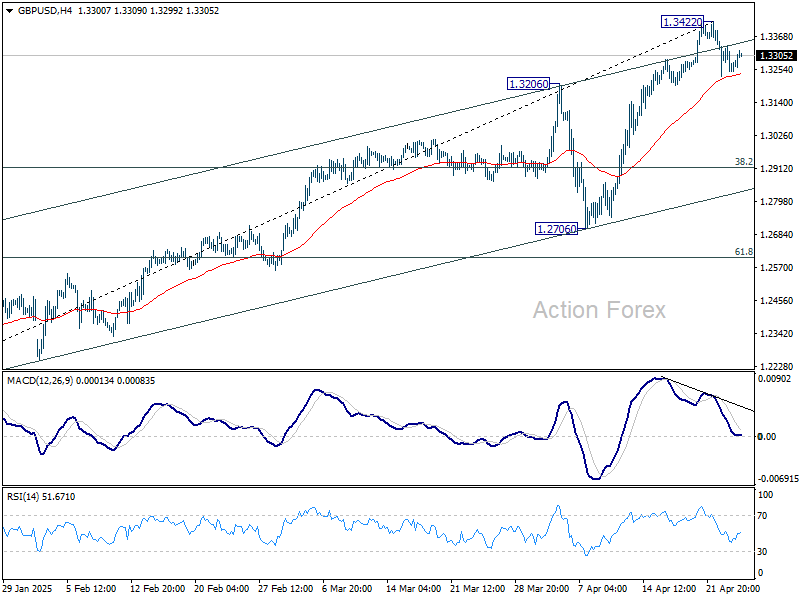
Intraday bias in GBP/USD remains mildly on the downside, and pullback from 1.3422 short term top would continue lower. But downside should be contained by 38.2% retracement of 1.2099 to 1.3422 at 1.2917. On the upside, firm break of 1.3433 will resume larger up trend.
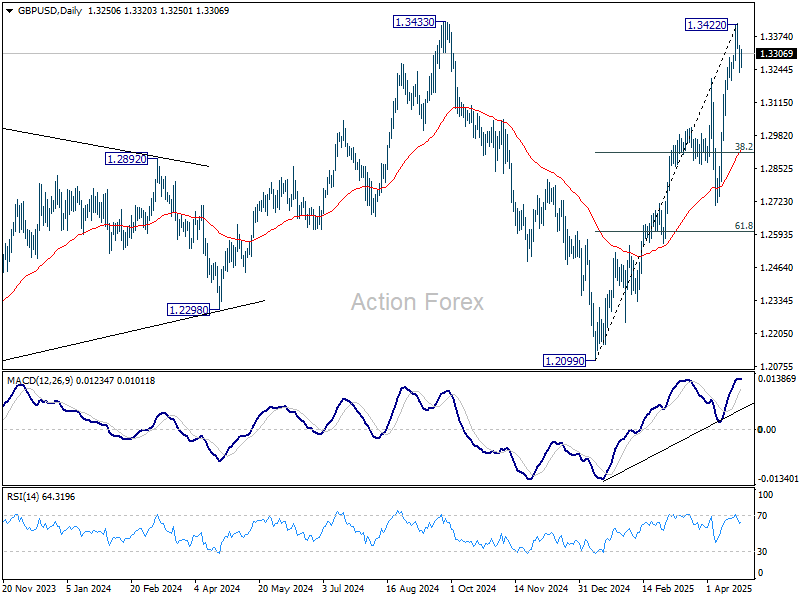
In the bigger picture, price actions from 1.3433 are seen as a corrective pattern to the up trend from 1.3051 (2022 low). Rise from 1.2099 could be the second leg. Overall, GBP/USD should target 1.4248 key resistance (2021 high) on break of 1.3433 at a later stage.
USD/JPY Mid-Day Outlook
Daily Pivots: (S1) 142.07; (P) 142.82; (R1) 144.19; More...
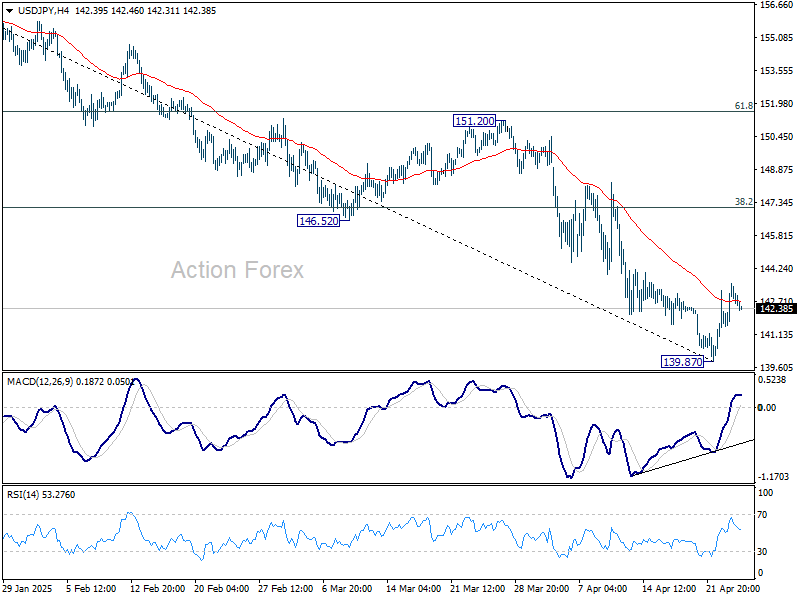
Intraday bias in USD/JPY remains mildly on the upside for the moment. Rebound from 139.87 short term bottom could extend higher. But overall risk will stay on the downside as long as 38.2% retracement of 158.86 to 139.87 at 147.12 holds. On the downside, decisive break of 139.26 will carry larger bearish implications.
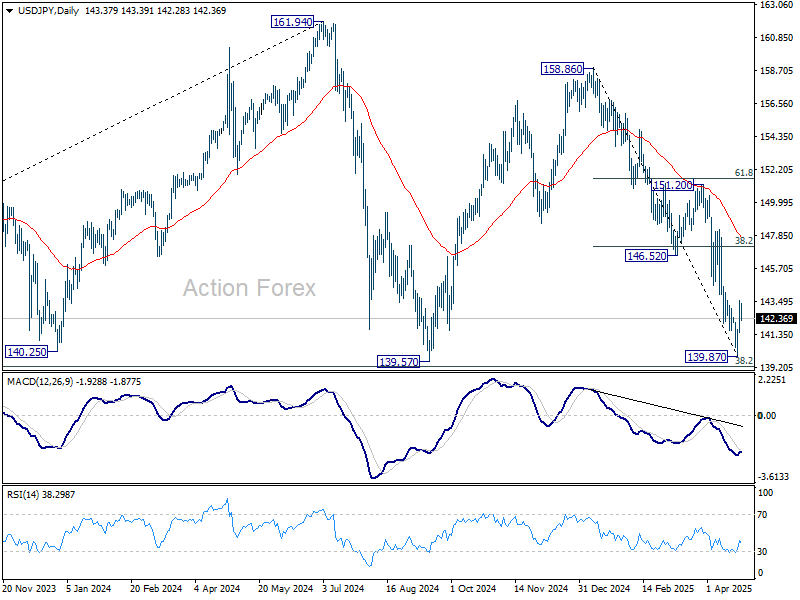
In the bigger picture, price actions from 161.94 are seen as a corrective pattern to rise from 102.58 (2021 low), with fall from 158.86 as the third leg. Strong support should be seen from 38.2% retracement of 102.58 to 161.94 at 139.26 to bring rebound. However, sustained break of 139.26 would open up deeper medium term decline to 61.8% retracement at 125.25.
USD/CHF Mid-Day Outlook
Daily Pivots: (S1) 0.8215; (P) 0.8264; (R1) 0.8355; More….
USD/CHF's rebound from 0.8038 is still in progress and intraday bias stays mildly on the upside. However, strong resistance should be seen from 38.2% retracement of 0.9200 to 0.8038 at 0.8482 to limit upside. On the downside, break of 0.8038 will resume larger down trend.
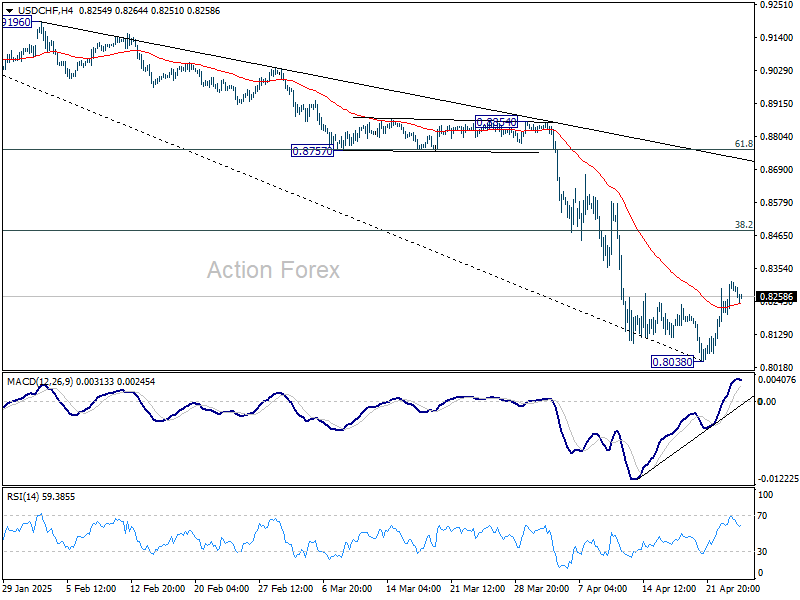
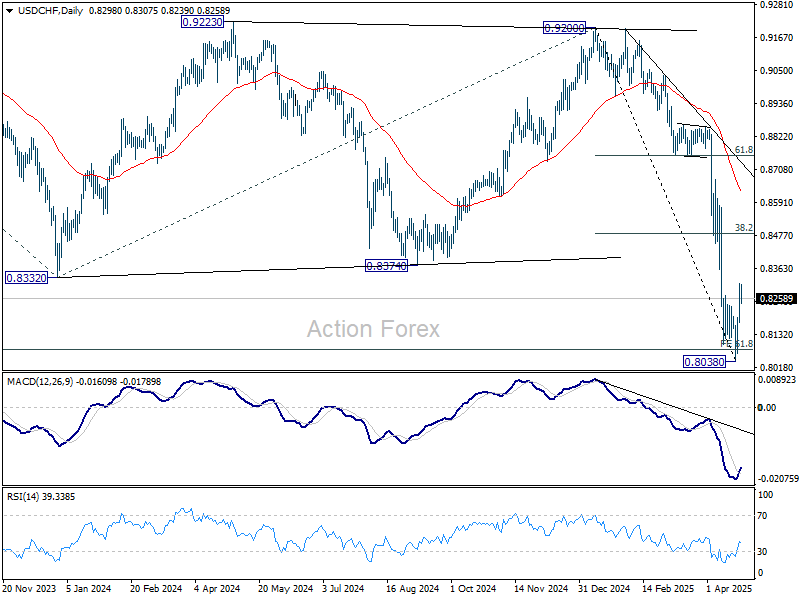
In the bigger picture, long term down trend from 1.0342 (2017 high) is still in progress and met 61.8% projection of 1.0146 (2022 high) to 0.8332 from 0.9200 at 0.8079 already. In any case, outlook will stay bearish as long as 55 W EMA (now at 0.8794) holds. Sustained break of 0.8079 will target 100% projection at 0.7382.
Dollar Rebound Stalls as US-China Trade Talks Hit a Wall
The forex markets remain subdued today, with all major pairs and crosses trading inside yesterday's range. After a brief bounce, Dollar’s recovery appears to be losing momentum. While it’s too soon to confirm whether the rebound has fully run its course, fading trade optimism is clearly starting to weigh on sentiment, especially as the broader macro picture continues to be dominated by uncertainty surrounding US trade policy.
One of the key sources of hesitation remains the unresolved state of US trade negotiations. Despite market hopes earlier in the week for progress, there has been no meaningful development between the US and its key trading partners regarding tariff reductions. More critically, the much-anticipated talks with China appear not to have even started at all—deflating sentiment that had briefly lifted risk assets and commodity currencies earlier in the week.
China’s Ministry of Commerce poured cold water on any speculation of near-term breakthroughs, stating unequivocally that there are “absolutely no negotiations” currently underway with the US on trade. The Foreign Ministry further emphasized that reports of ongoing talks or agreements are “false news,” and reiterated that Washington must first cancel its unilateral measures for talks to begin. The firm stance from Beijing signals a hardening of positions, making the path toward de-escalation far less certain than previously hoped.
For now, Dollar and other major currencies are in wait-and-see mode, with traders looking for more concrete signals before re-engaging decisively. As for the week so far, Kiwi is still sitting at the top of the performance ladder, followed by Aussie, and then Sterling. On the weaker side, safe-haven currencies continue to lag, with Swiss Franc underperforming, followed by Euro and Yen. The Dollar and Loonie position in the middle of the pack.
In Europe, at the time of writing, FTSE is down -0.19%. DAX is down -0.24%. CAC is down -0.03%. UK 10-year yield is down -0.048 at 4.515. Germany 10-year yield is down -0.049 at 2.455. Earlier in Asia, Nikkei rose 0.49%. Hong Kong HSI fell -0.74%. China Shanghai SSE rose 0.03%. Singapore Strait Times fell -0.01%. Japan 10-year JGB yield fell -0.014 to 1.310.
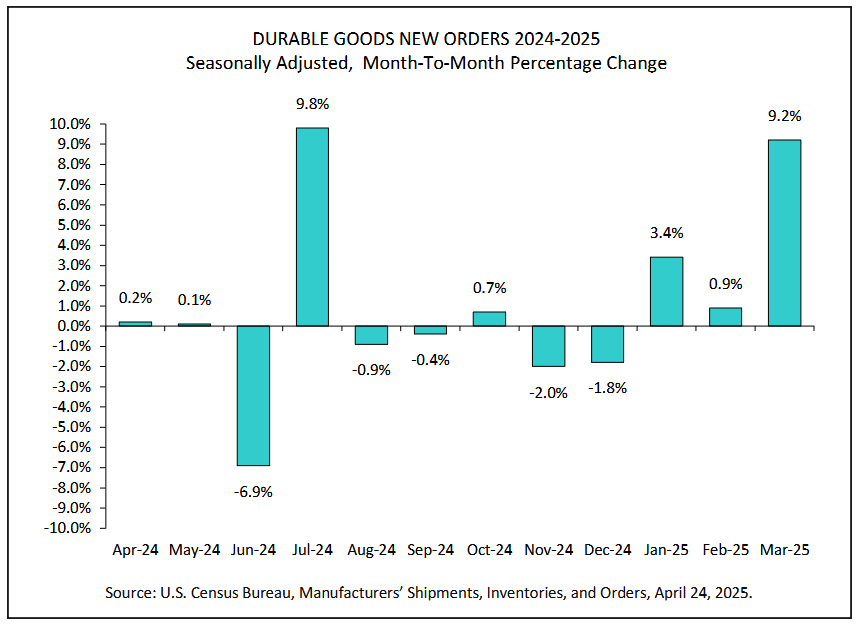
US durable goods orders surge 9.2% mom on transportation demand, but underlying momentum stalls
US durable goods orders soared by 9.2% mom in March to USD 315.7B, far surpassing expectations of a 1.5% mom gain. The sharp rise was driven almost entirely by a surge in transportation equipment, which jumped 27% mom to USD124.6B, marking a third consecutive monthly increase.
Orders excluding defense also posted a strong 10.4% mom gain to USD 300.0B, highlighting a significant boost in civilian aircraft and related components.
However, the underlying momentum in business investment appeared far less robust. Core orders excluding transportation were flat at USD 191.1B, missing forecasts for a modest 0.2% mom increase.
US initial jobless claims rise to 222k, matched expectations
US initial jobless claims rose 6k to 222k in the week ending April 19, matched expectations. Four-week moving average of initial claims fell -1k to 220k. Continuing claims fell -37k to 1841k in the week ending April 12. Four-week moving average of continuing claims fell -1.5k to 1864k.
ECB’s Nagel and Lane warn of growth hit from tariffs, downplay recession risk
German ECB Governing Council member Joachim Nagel acknowledged today that Germany faces significant downside risks to growth due to US tariffs.
“As far as economic growth is concerned, which of course also depends on the level of the respective tariffs, the impact in Europe will also be significant for Germany,” he warned.
But on inflation, "we are relatively certain that the impact on inflation in the US will be stronger than in the euro zone," Nagel added.
Separately, ECB Chief Economist Philip Lane told Bloomberg News that while the tariff shock will likely drag on Eurozone growth, the region is not on an automatic path toward recession.
Lane emphasized the bloc’s diversified trade relationships beyond the US, which could act as a cushion against a more severe downturn.
German Ifo climbs slightly to 86.9, but rising uncertainty signals turbulence ahead
Germany’s Ifo Business Climate Index edged higher in April, rising from 86.7 to 86.9 and beating market expectations of 85.2. Current Assessment Index climbed to 86.4 from 85.7. Expectations, while slightly lower at 87.4 compared to March’s 87.7, still surpassed the anticipated 85.0.
However, a closer look at the sectoral breakdown reveals growing divergence and fragility. Manufacturing sentiment deteriorated further, dropping from -16.6 to -18.1, while trade confidence took a notable hit, falling from -23.8 to -27.0. On the other hand, modest gains in services (from -1.1 to -0.8) and construction (from -24.3 to -21.9) offered some relief, though both remain firmly in negative territory.
The Ifo Institute cautioned that “uncertainty among the companies has increased,” adding that “the German economy is preparing for turbulence.”
USD/CHF Mid-Day Outlook
Daily Pivots: (S1) 0.8215; (P) 0.8264; (R1) 0.8355; More….
USD/CHF's rebound from 0.8038 is still in progress and intraday bias stays mildly on the upside. However, strong resistance should be seen from 38.2% retracement of 0.9200 to 0.8038 at 0.8482 to limit upside. On the downside, break of 0.8038 will resume larger down trend.
In the bigger picture, long term down trend from 1.0342 (2017 high) is still in progress and met 61.8% projection of 1.0146 (2022 high) to 0.8332 from 0.9200 at 0.8079 already. In any case, outlook will stay bearish as long as 55 W EMA (now at 0.8794) holds. Sustained break of 0.8079 will target 100% projection at 0.7382.
ECB’s Nagel and Lane warn of growth hit from tariffs, downplay recession risk
German ECB Governing Council member Joachim Nagel acknowledged today that Germany faces significant downside risks to growth due to US tariffs.
“As far as economic growth is concerned, which of course also depends on the level of the respective tariffs, the impact in Europe will also be significant for Germany,” he warned.
But on inflation, "we are relatively certain that the impact on inflation in the US will be stronger than in the euro zone," Nagel added.
Separately, ECB Chief Economist Philip Lane told Bloomberg News that while the tariff shock will likely drag on Eurozone growth, the region is not on an automatic path toward recession.
Lane emphasized the bloc’s diversified trade relationships beyond the US, which could act as a cushion against a more severe downturn.
US durable goods orders surge 9.2% mom on transportation demand, but underlying momentum stalls
US durable goods orders soared by 9.2% mom in March to USD 315.7B, far surpassing expectations of a 1.5% mom gain. The sharp rise was driven almost entirely by a surge in transportation equipment, which jumped 27% mom to USD124.6B, marking a third consecutive monthly increase.
Orders excluding defense also posted a strong 10.4% mom gain to USD 300.0B, highlighting a significant boost in civilian aircraft and related components.
However, the underlying momentum in business investment appeared far less robust. Core orders excluding transportation were flat at USD 191.1B, missing forecasts for a modest 0.2% mom increase.