
Sample Category Title
De-escalation of Trade Tensions, Dovish Fed Comments, Alphabet Earnings Boost Appetite
Yesterday allowed global risk investors to take a deeper breath. Dovish comments from Federal Reserve (Fed) members, and de-escalation of trade tensions between the US and China allowed a further recovery in global equities. Optimism was backed today by the Chinese announcement that it is considering easing tariffs on some US imports, further signalling de-escalation of trade tensions and supporting earlier comments from the Trump administration that triple-digit tariffs could come ‘substantially’ down. As a result, the Chinese CSI 300 is better bid this Friday, while the Hang Seng Index in HK is up nearly 1.50% at the time of writing. Part of the optimism is due to de-escalation of trade tensions, and part is due to Politburo’s reiteration of pro-active fiscal and supportive monetary stimulus to support the economy.
Turning dovish?
In the US, a few Fed members have started to lower their guard. Christopher Waller said he would support rate cuts if jobs are affected, and Beth Hammack indicated that the next Fed cut could arrive as early as June if there’s clear evidence of a US economic downturn. If Atlanta Fed’s GDP Now forecast is any indication, the US economy could post a 2.5% decline in Q1, down from 2.4% in Q4. Activity in Fed funds futures shows a more than 60% chance of a June rate cut.
The risk is the inflation outlook for the US is uncertain. If the economic slowdown doesn’t temper inflationary pressures, rising inflation from tariffs will limit the Fed’s scope for action. For now, however, market movements suggest investors are optimistic the Fed will act sooner rather than later. The US 2-year yield—best capturing Fed expectations—stands below 3.80% this morning compared to around 4.40% at the beginning of the year. But we sense that companies will try to pass tariffs on to their clients. Giants like P&G and Unilever warned this week: Unilever beat estimates in Q1 by raising prices, and P&G’s CEO said the company will ‘likely’ raise prices due to higher tariffs. Now, all eyes are on inflation and employment figures to determine what the Fed should do and how much they could ease pressure.
In Europe, the situation is different. Falling energy prices and a cheaper US dollar make the inflation outlook much softer than in the US, and softening inflation means the European central banks could continue cutting interest rates to support their economies, which are poised to slow down due to rising trade tensions. On the other hand, European government spending on security and infrastructure will likely boost prices in limited areas and won’t generate broad-based price pressure. As such, the diverging inflation outlooks for the US and Europe—and the idea that European economies will take a softer hit—support the euro against a broadly weakened US dollar. Though, the pair is struggling to find buyers into the 1.14 mark, as there’s growing fear that a too-strong euro could hurt European economies: 60% of the Stoxx 600's sales come from abroad and melt when converted back to euros. So far, the earnings season in Europe has been inconclusive. Luxury companies posted disappointing results, while tech results were mixed, with strong growth from SAP but significantly lower bookings from ASML.
Across the Channel, the FTSE 100 is outperforming the Stoxx 600. Miners are performing well. Fresnillo, for example, is up nearly 80% since the beginning of the year, while Antofagasta is up more than 30% since its April dip, as copper futures rally despite a gloomy global outlook. This rally is explained by a weaker dollar, Chinese stimulus, supply constraints, and perhaps increased buying before tariffs. Easing trade tensions could further boost appetite for the UK’s energy- and commodity-rich FTSE 100.
In the US, the selloff appears to have eased this week, and the first glance at tech earnings wasn’t that bad. Tesla did poorly for political reasons, but Netflix beat estimates, and Google—who announced its latest results yesterday after the bell—showed better-than-expected revenue growth for both its advertising and cloud segments, justifying the company’s AI spending plans. This gave AI investors a timid smile, indicating that the AI theme isn’t dead—it’s just been overshadowed by Trump’s trade news. As a result, Alphabet jumped more than 4.5% in after-hours trading and could break free from its year-to-date bearish trend. If all goes well, today’s post-earnings jump in Alphabet could push its share price above the critical 38.2% Fibonacci retracement of this year’s slump, into the medium-term bullish consolidation zone. The idea that AI is helping boost revenue and justify spending should also fuel appetite in AI enablers like Nvidia, diverting attention from the tariff war for a while.
As such, Nasdaq futures are leading gains this morning, and sentiment across major markets suggests that the week will likely end in a better mood than when it started! Let’s cross our fingers that the weekend news don’t spoil the latest optimism.
Watch Out for Final April Inflation Expectations
In focus today
The week concludes with a light macro schedule, where we keep an eye on the University of Michigan's revised April consumer sentiment survey. The preliminary data showed yet another worrying uptick in inflation expectations.
Economic and market news
What happened overnight
In Japan, Tokyo inflation for April came in higher than expected, with the headline at 3.5% y/y (prior: 2.9%) and core at 3.4% y/y (cons: 3.2%, prior: 2.4%), driven by a broad-based uptick in prices. April marks the start of a new fiscal year, a time when firms reassess their price-setting, and this year's increases were higher than expected, as firms are passing on rising input costs to consumers. Combined with the strong wage growth ahead, we expect the BoJ to continue its policy normalization path - though this remains contingent of the trade war. Also addressing the risks of US tariffs, BoJ Governor Ueda stated yesterday that the BoJ will continue its hiking cycle if underlying inflation converges toward the 2% target, but the impact of US tariffs could change that course.
What happened yesterday
In the US, March durable goods orders was much stronger than expected at 9.2% m/m SA (cons: 2.0%). The figures were clearly affected by front-loading, as orders of primary metals and cars have ticked higher in early 2025. Looking at details, the largest uptick occurred in non-defence aircraft orders at 149% y/y, mostly reflecting a strong increase in Boeing's order books, since excluding aircraft, new orders hardly increased at all. As the uptick mainly reflects temporary factors, the market impact was muted.
Several Fed speakers were on the wire yesterday. Cleveland Fed President (hawk and non-voting member) unsurprisingly struck a hawkish tone, emphasizing that the Fed should be patient rather than pre-emptive in assessing how tariffs will impact inflation and growth. Fed Governor Waller (dove and voting member), conversely, conveyed a dovish tone, noting that it would not be surprising to see more layoffs and higher unemployment. Minneapolis Fed President Kashkari (hawk and non-voting member) expressed concern that the trade policy made him "nervous" about potential large-scale layoffs, though so far, he has only heard about businesses beginning to plan for this scenario if trade uncertainty persists. Importantly, the blackout period ahead of the May meeting begins on Saturday. The Fed staying put is seemingly a done deal, unless Trump somehow causes some renewed chaos in markets before the meeting. We maintain our call for the next cut in June and expect quarterly 25bp reductions until the policy rate reaches a terminal range of 3.00-3.25% by mid-2026.
In the US-China trade war, Beijing yesterday played some of their cards, stating that the US should cancel all "unilateral tariff measures" against China "if it truly wanted" to resolve the trade war. Currently, no economic and trade negotiations between the two countries have taken place, despite the US frequently mentioning de-escalation in recent days.
Firms also appear to be factoring in the ongoing trade war between the US and China, as reflected by Apple's plan to relocate the production of iPhones sold in the US from China to India as soon as next year, according to the Financial Times this morning.
In Germany, the Ifo index for April was surprisingly positive, not really impacted by tariffs, as was expected. The assessment of the current economic situation rose to 86.4 in contrast to an expected decline (cons: 85.4, prior: 85.7). Interestingly, the expectations component declined only marginally to 87.4, much less than expected (cons: 85.0, prior: 87.7). Hence, like the PMI data, the Ifo index did not really show an abrupt impact of the Trump trade war. Details show that the smaller-than-expected decline in expectations was due to construction expectations rising, services remaining unchanged, and manufacturing expectations declining. Hence, the manufacturing leg was marginally impacted by the trade war, while the construction expectations ticked higher most likely due to the infrastructure package.
Equities: Equity markets continued their upward trajectory yesterday, consistent with the pattern observed in recent sessions. Once again, US equities led the gains, with cyclical stocks outperforming, supported by declining implied and realised volatility. As US cyclicals, growth, and tech stocks outperformed, we also saw significant underperformance in minimum-volatility stocks. The investment narrative remains relatively straightforward at present. Macro and micro data are taking a back seat, with market focus squarely on whether the US continues to escalate - or de-escalate - the trade conflict. Yesterday brought further signals from the US administration pointing towards de-escalation. In the US yesterday, Dow +1.2%, S&P 500 +2.0%, Nasdaq +2.7% and Russell 2000 +2.0%. Asian equity markets are broadly in the green this morning, supported by initial signs from China suggesting a softening stance, not further escalation. Reports indicate that China is considering exempting certain product categories from the steep 125% tariffs currently imposed on US imports. Futures in both Europe and the US are also trading higher this morning, with US futures driven by positive earnings after the close yesterday.
FI & FX: Rates rallied, both in the US and Europe, during yesterday's trading session. The USD weakened somewhat against the EUR yesterday but regained all back in today's morning session. Rumours that China might suspend the elevated tariffs on some of the US goods imports, lifts Chinese sentiment this morning. A rather empty macro-agenda makes lacks any triggers for big movements, and focus will be on any (geo)political comments that might come during the day.
USD/CAD Daily Outlook
Daily Pivots: (S1) 1.3830; (P) 1.3864; (R1) 1.3889; More...
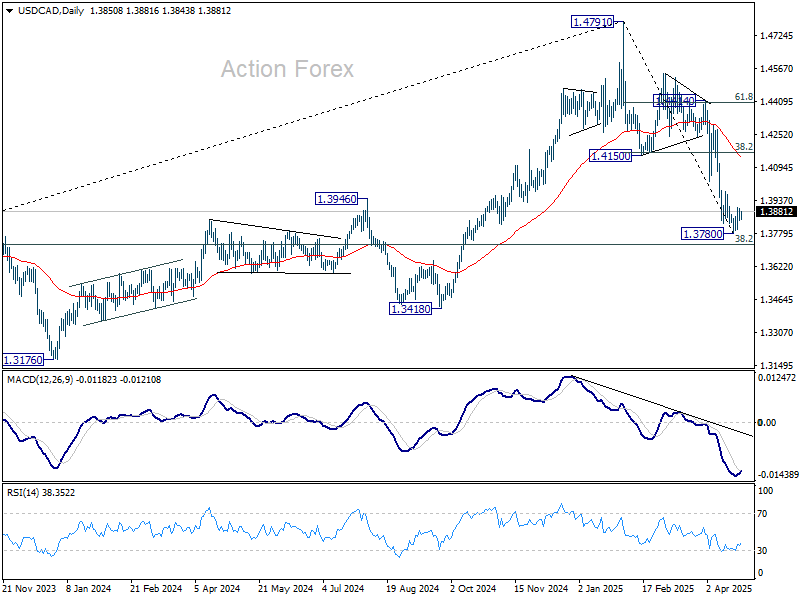
Intraday bias in USD/CAD stays mildly on the upside at this point. Recovery from 1.3780 short term bottom could extend higher. However, upside should be limited by 1.4150 support turned resistance (38.2% retracement of 1.4791 to 1.3780 at 1.4166. On the downside, firm break of 1.3780 will resume the whole fall from 1.4791.
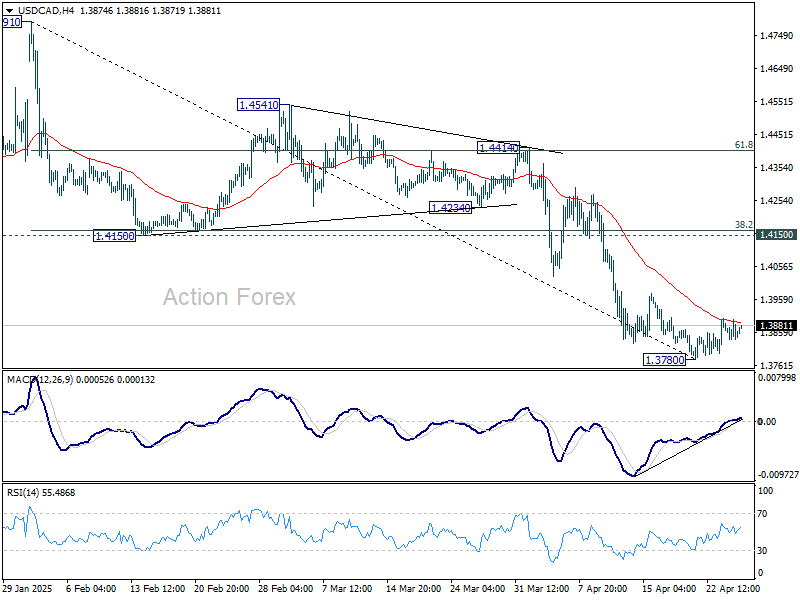
In the bigger picture, the break of 1.3976 resistance turned support (2022 high) and 55 W EMA (now at 1.3982) indicates that a medium term top is already in place at 1.4791. Fall from there would either be a correction to rise from 1.2005, or trend reversal. In either case, firm break of 38.2% retracement of 1.2005 (2021 low) to 1.4791 at 1.3727 will pave the way back to 61.8% retracement at 1.3069.
Glimmers of Trade Optimism Lift Asian Markets, But Concrete Progress Still Elusive
There’s a cautious tone of optimism in Asian markets today, though gains are largely concentrated in Japan, South Korea, and Hong Kong. This moderate rally is being supported by a handful of headlines suggesting incremental movement in global trade diplomacy, even if concrete progress remains limited.
One of the more notable developments comes from a Bloomberg report indicating that China is considering suspending its 125% tariffs on certain US imports, including medical equipment, industrial chemicals, and possibly even aircraft leases. While such a move would mark a significant de-escalation, it remains speculative at this stage.
Adding to the mix, U.S. President Donald Trump pushed back on China’s claims that no talks were underway between Washington and Beijing. Trump insisted that “they had a meeting this morning,” although it was unclear who “they” referred to—even he conceded the ambiguity. With no official confirmation from either side, the market reaction has been understandably restrained.
More tangible, however, was news from Washington of a “very successful” trade meeting between the US and South Korea. Treasury Secretary Scott Bessent expressed unexpected optimism following the bilateral “2+2” talks, suggesting that technical-level negotiations could begin as early as next week. South Korea is hoping to strike a deal with the US by July to avert impending tariffs. The news gave a noticeable lift to South Korean shipbuilding stocks, a sector highly sensitive to global trade developments.
In Japan, Prime Minister Shigeru Ishiba unveiled an emergency economic package designed to cushion the impact of higher US tariffs. The stimulus includes corporate financing support, consumer-focused measures to boost domestic spending, and targeted relief such as subsidies for energy bills and fuel price reductions. This has added to the positive tone in Japanese equities, as the government shows readiness to act swiftly in cushioning external shocks and stabilizing demand.
Currency markets are also reflecting shifting sentiment. Kiwi continues to lead the pack this week, followed by Aussie and Dollar. On the weaker end, safe-haven currencies like Swiss Franc, Yen, and Euro remain under some pressure as investors unwind defensive positions.
Sterling and Loonie are holding in the middle of the pack, awaiting further direction from today’s retail sales reports out of the UK and Canada. Market participants will also be watching for any comments from SNB Chair Schlegel regarding the Franc’s recent strength amid global risk aversion.
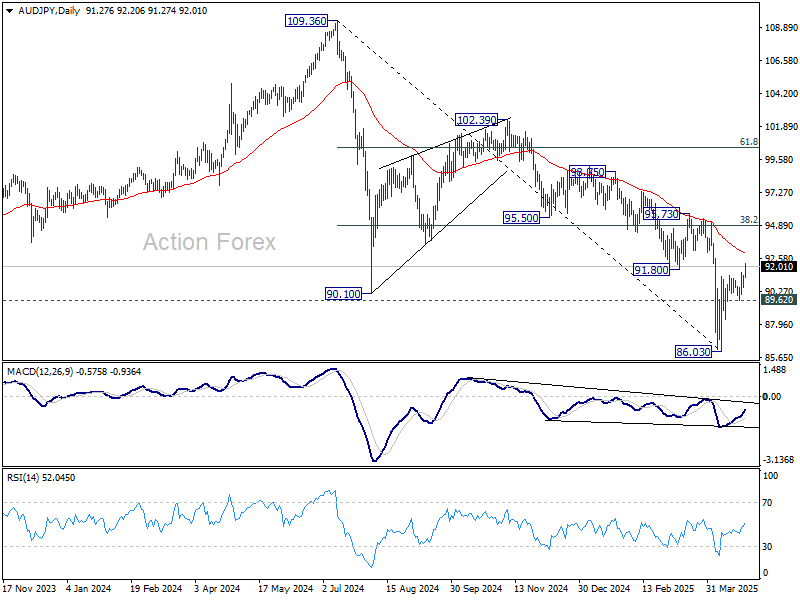
Technically, it's possible that AUD/JPY's fall from 102.39 has completed as a five-wave impulse at 86.03, which also marks the completion of the whole three-wave correction from 109.36. For now, further rise is in favor as long as 89.62 support holds. Next target is 55 D EMA (now at 92.97). Sustained trading above there will solidify bullish reversal, and target 38.2% retracement of 109.36 to 86.03 at 94.94 next.
In Asia, at the time of writing, Nikkei is up 1.80%. Hong Kong HSI is up 1.05%. China Shanghai SSE is up 0.05%. Singapore Strait Times is down -0.02%. Japan 10-year JGB yield is up 0.028 at 1.337. Overnight, DOW rose 1.23%. S&P 500 rose 2.03%. NASDAQ rose 2.74%. 10-year yield fell -0.082 to 4.305.
Tokyo CPI core surges to 3.4% in April, strengthening case for BoJ June hike
Inflation in Japan’s capital city surged in April, with Tokyo core CPI (excluding food) accelerating from 2.4% yoy to 3.4% yoy, above the 3.2% yoy forecast. The more domestically focused core-core measure (excluding food and energy) also rose sharply, from 2.2% yoy to 3.1% yoy. Headline CPI jumped from 2.9% yoy to 3.5% yoy.
Despite the upside surprise, BoJ is still expected to hold rates steady at its May 1 policy meeting as it gauges the broader impact of recent US tariffs and awaits progress in ongoing trade negotiations. However, with inflation gathering pace across key categories, market expectations are shifting toward a rate hike as soon as June.
BoJ's Ueda says G20 peers aAlign on tariff risks to trade and sentiment
BoJ Governor Kazuo Ueda acknowledged growing global concern over the economic impact of tariffs, following discussions with international counterparts at a G20 finance ministers' meeting.
Speaking at a press conference, Ueda said many global policymakers "roughly had the same view" that tariffs weigh on trade activity, weaken business sentiment, and increase market volatility. He noted that these factors will be integrated into BoJ’s evolving assessment of Japan’s economic outlook and monetary policy.
Ueda reaffirmed BoJ’s intention to raise interest rates gradually, provided underlying inflation continues to converge toward the 2% target. But he emphasized a cautious, data-dependent approach.
“We would like to scrutinize various data that comes in, without pre-conception,” he said.
Fed's Kashkari: Trade shift could raise US borrowing costs
Minneapolis Fed President Neel Kashkari highlighted the economic risks tied to shifts in the US trade balance and lingering uncertainty from ongoing trade disputes.
Speaking at an event overnight, Kashkari noted that the US's persistent trade deficit has long been supported by foreign capital inflows, which have helped keep interest rates low. However, if the U.S. were to move toward a trade surplus and lose its status as the "singular premier destination for capital", borrowing costs could rise, along with the neutral interest rate.
Kashkari emphasized that resolving current trade disputes with major partners could provide much-needed clarity for businesses and households, reducing the "extraordinary uncertainty" they currently face.
He warned that a collective loss of confidence could quickly ripple through the economy, "really bring down the economy, really slow it down" and potentially triggering job losses. While such a downturn hasn't materialized yet, Kashkari said it's a risk he is "keeping a close eye on."
USD/CAD Daily Outlook
Daily Pivots: (S1) 1.3830; (P) 1.3864; (R1) 1.3889; More...
Intraday bias in USD/CAD stays mildly on the upside at this point. Recovery from 1.3780 short term bottom could extend higher. However, upside should be limited by 1.4150 support turned resistance (38.2% retracement of 1.4791 to 1.3780 at 1.4166. On the downside, firm break of 1.3780 will resume the whole fall from 1.4791.
In the bigger picture, the break of 1.3976 resistance turned support (2022 high) and 55 W EMA (now at 1.3982) indicates that a medium term top is already in place at 1.4791. Fall from there would either be a correction to rise from 1.2005, or trend reversal. In either case, firm break of 38.2% retracement of 1.2005 (2021 low) to 1.4791 at 1.3727 will pave the way back to 61.8% retracement at 1.3069.
BoJ’s Ueda says G20 peers align on tariff risks to trade and sentiment
BoJ Governor Kazuo Ueda acknowledged growing global concern over the economic impact of tariffs, following discussions with international counterparts at a G20 finance ministers' meeting.
Speaking at a press conference, Ueda said many global policymakers "roughly had the same view" that tariffs weigh on trade activity, weaken business sentiment, and increase market volatility. He noted that these factors will be integrated into BoJ’s evolving assessment of Japan’s economic outlook and monetary policy.
Ueda reaffirmed BoJ’s intention to raise interest rates gradually, provided underlying inflation continues to converge toward the 2% target. But he emphasized a cautious, data-dependent approach.
“We would like to scrutinize various data that comes in, without pre-conception,” he said.
Tokyo CPI core surges to 3.4% in April, strengthening case for BoJ June hike
Inflation in Japan’s capital city surged in April, with Tokyo core CPI (excluding food) accelerating from 2.4% yoy to 3.4% yoy, above the 3.2% yoy forecast. The more domestically focused core-core measure (excluding food and energy) also rose sharply, from 2.2% yoy to 3.1% yoy. Headline CPI jumped from 2.9% yoy to 3.5% yoy.
Despite the upside surprise, BoJ is still expected to hold rates steady at its May 1 policy meeting as it gauges the broader impact of recent US tariffs and awaits progress in ongoing trade negotiations. However, with inflation gathering pace across key categories, market expectations are shifting toward a rate hike as soon as June.
Fed’s Kashkari: Trade shift could raise US borrowing costs
Minneapolis Fed President Neel Kashkari highlighted the economic risks tied to shifts in the US trade balance and lingering uncertainty from ongoing trade disputes.
Speaking at an event overnight, Kashkari noted that the US's persistent trade deficit has long been supported by foreign capital inflows, which have helped keep interest rates low. However, if the U.S. were to move toward a trade surplus and lose its status as the "singular premier destination for capital", borrowing costs could rise, along with the neutral interest rate.
Kashkari emphasized that resolving current trade disputes with major partners could provide much-needed clarity for businesses and households, reducing the "extraordinary uncertainty" they currently face.
He warned that a collective loss of confidence could quickly ripple through the economy, "really bring down the economy, really slow it down" and potentially triggering job losses. While such a downturn hasn't materialized yet, Kashkari said it's a risk he is "keeping a close eye on."
USD/JPY Recovery Stalls — Bearish Pressure Mounting Again?
Key Highlights
- USD/JPY started a recovery wave from the 140.00 zone.
- A major bearish trend line is forming with resistance at 143.40 on the 4-hour chart.
- EUR/USD corrected gains below the 1.1450 support zone.
- GBP/USD could aim for a fresh increase above the 1.3400 level.
USD/JPY Technical Analysis
The US Dollar started a decent recovery wave above 140.50 against the Japanese Yen. USD/JPY climbed above the 141.50 and 142.00 resistance levels.
Looking at the 4-hour chart, the pair surpassed the 23.6% Fib retracement level of the downward move from the 148.28 swing high to the 139.88 low. However, the bears were active below the 144.00 level.
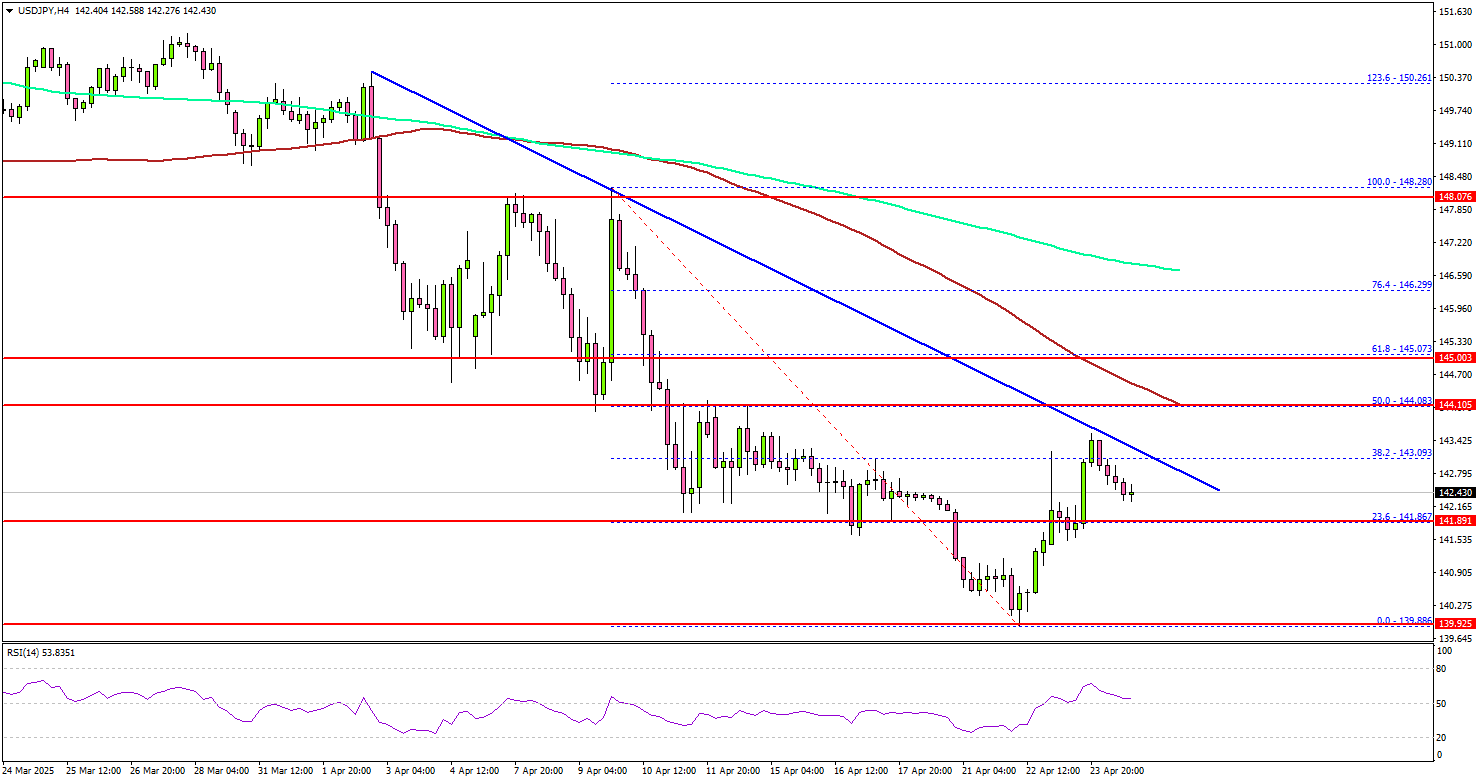
The pair remained below the 100 simple moving average (red, 4-hour) and the 200 simple moving average (green, 4-hour). There is also a major bearish trend line forming with resistance at 143.40 on the same chart.
If there is a fresh increase, the pair could face resistance near the 143.40 level and the trend line. The next major resistance is near the 144.00 level and the 50% Fib retracement level of the downward move from the 148.28 swing high to the 139.88 low.
A close above the 144.00 level could set the tone for another increase. In the stated case, the pair could even clear the 145.00 resistance.
On the downside, immediate support sits near the 141.80 level. The next key support sits near the 141.20 level. Any more losses could send the pair toward the 140.00 level, where the bulls might take a stand.
Looking at EUR/USD, the pair corrected some gains below 1.0450 but the bulls might remain active above the 1.1280 level.
Upcoming Economic Events:
- IMF Meeting.
- Michigan Consumer Sentiment Index for April 2025 – Forecast 50.8, versus 50.8 previous.
Elliott Wave View: USDCHF Zigzag Corrective Rally Expected to Fail
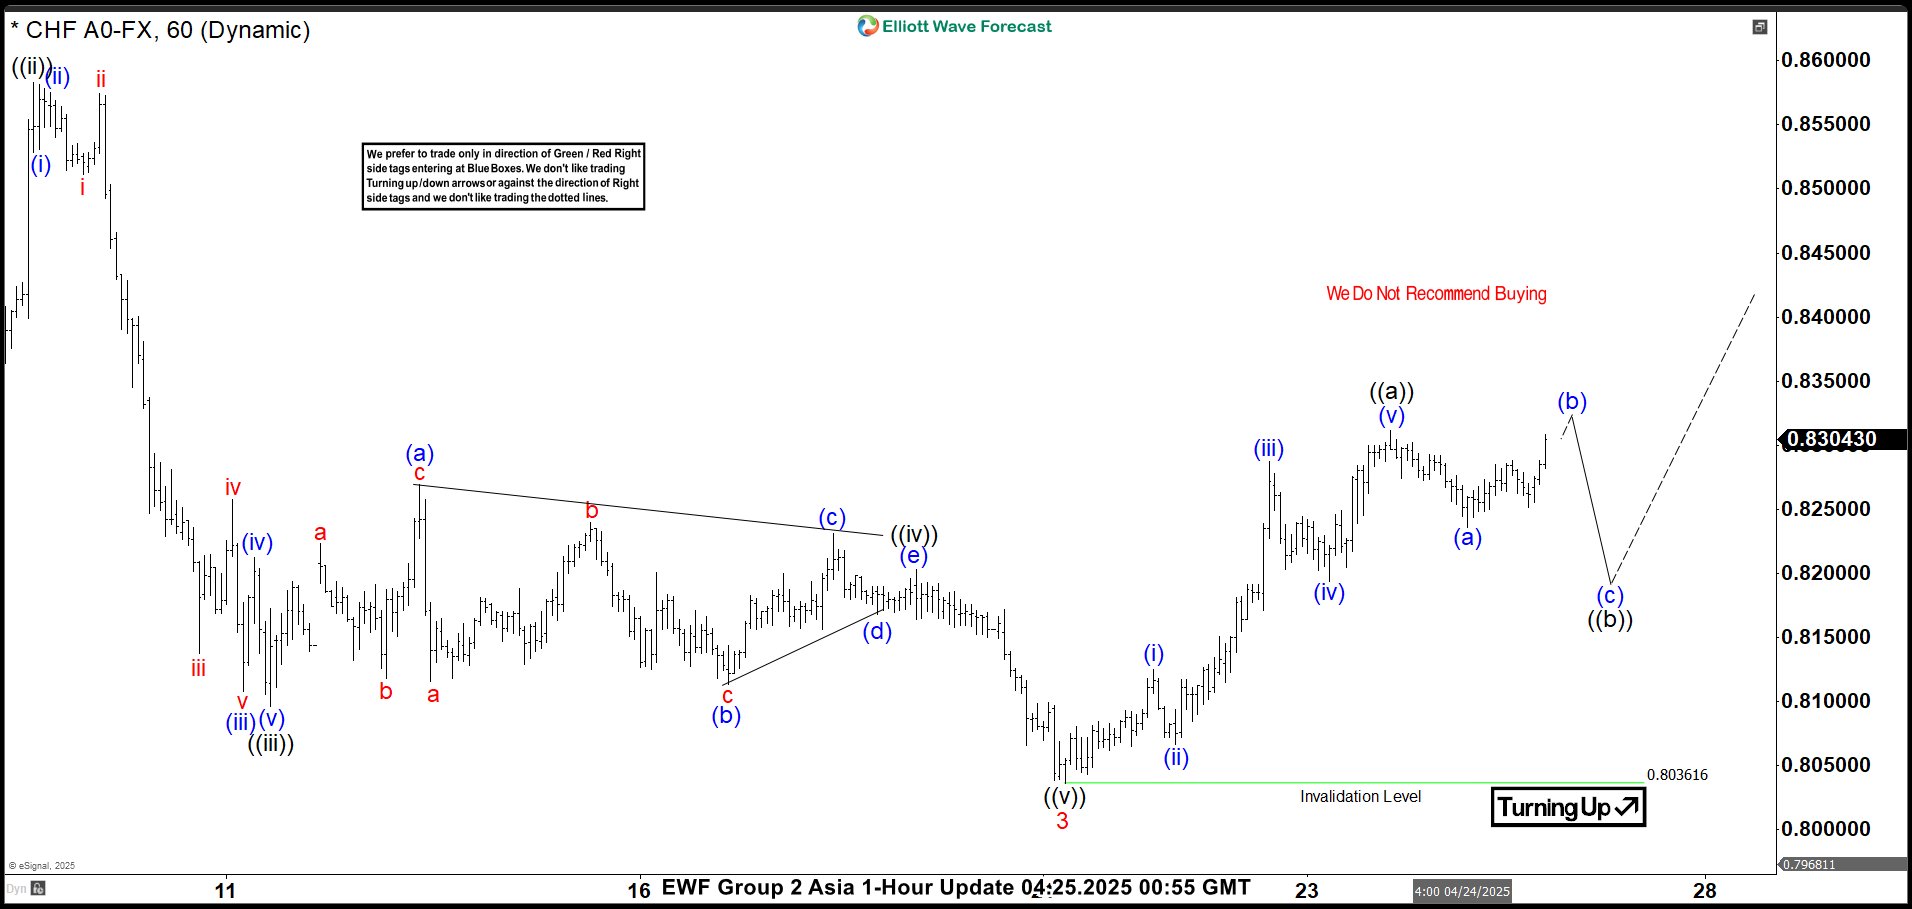
The USDCHF currency pair has been trending downward since its high on January 13, 2026. The pair follows a pattern known as a 5-wave impulse in Elliott Wave analysis. This pattern helps traders predict price movements by breaking them into distinct waves. Starting from the peak, the first wave (wave 1) saw the pair drop to 0.8965. After this decline, a brief recovery, or wave 2, pushed the price back up to 0.9196. From there, the pair resumed its downward trajectory in wave 3, which unfolded in several stages.
In wave 3, the price first fell to 0.8356, marking the end of an internal sub-wave (wave ((i))). A small bounce to 0.8583 completed wave ((ii)). The decline continued, with wave ((iii)) reaching 0.8096, followed by a slight rally to 0.8203 for wave ((iv)). The final leg of wave 3, wave ((v)), bottomed out at 0.803, wrapping up the third wave.
Currently, USDCHF is in an upward correction in wave 4, which is taking the shape of a zigzag pattern. From the low at 0.803, the pair climbed to 0.8124 in wave (i). Pair dipped to 0.8066 in wave (ii) then rose again to 0.8286 in wave (iii). A pullback to 0.8194 marked wave (iv), and the final push to 0.8311 completed wave ((a)), the first part of wave 4. Right now, the pair is experiencing a short-term pullback, called wave ((b)), correcting the rise that began on April 21, 2025. As long as the key support level at 0.8036 remains intact, USDCHF is expected to resume its upward movement soon, potentially reaching higher levels before the next major trend develops.
USDCHF 60 Minute Elliott Wave Chart
USDCHF Video
https://www.youtube.com/watch?v=O_8Fe5TikaU
USD/CHF Analysis: Will Swiss National Bank (SNB) act on CHF surge?
- The Swiss Franc has significantly risen against the USD, driven by safe-haven demand.
- Concerns are growing about potential intervention by the Swiss National Bank (SNB) due to the Franc's impact on exports.
- The SNB has stated they prioritize price stability and haven't ruled out negative rates.
- Technical analysis suggests USD/CHF found support, but bearish signals indicate possible retests of recent lows.
The Swiss Franc has been on a tear of late against the USD and a host of other currencies. The CHFs rapid rise has come about amid the rise in uncertainty and a demand for safe havens. The beneficiaries being the traditional havens like the Japanese Yen, the Swiss Franc and of course Gold.
The Swiss Franc is an interesting one though given the reliance of Swiss business on the export market. Swiss Franc gains last year already prompted businesses to bring up the idea of intervention by the Swiss National Bank to assist.
The Franc or Swissie as it is also known, has jumped about 9% against the dollar this month, marking its biggest monthly rise since the 2008 financial crisis. Last week, it reached its highest level since January 2015, when the SNB ended its minimum exchange rate policy.
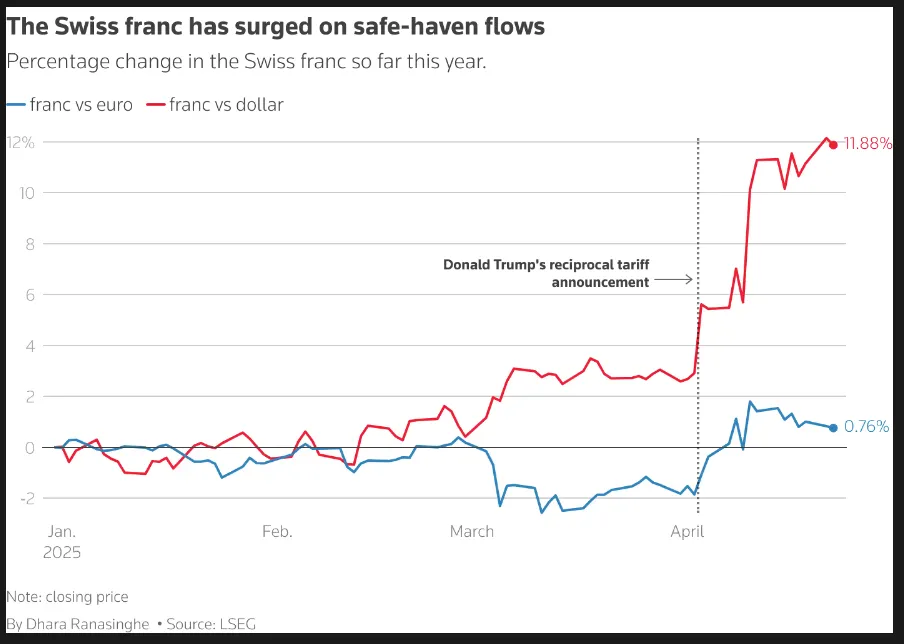
Source: LSEG
This begs the question, will the SNB step in and intervene?
Well voices on the matter are certainly growing with Jean-Philippe Kohl, vice director of industry association Swissmem saying he did not demand SNB action but would welcome any moves by the central bank to mitigate the franc's rise.
Swiss National Bank (SNB) response
The SNB stated this month that it doesn’t manipulate currency and only steps in to maintain price stability. It also mentioned the possibility of bringing back negative rates.
However, negative rates, used from 2014 to 2022, were unpopular with banks, savers, and pension funds, making interventions seem like a simpler option.
While a lot of the focus has been on the performance of the Swissie against the US Dollar, policymakers are likely focused on the Swiss currency's rise against the euro since most Swiss trade is with eurozone countries, making euro-priced imports a bigger factor in inflation.
In 2023, 57% of Swiss imports were in euros, compared to 13% in dollars. The central bank says it doesn’t focus on single currency pairs but looks at a range of currencies to guide its policy and ensure it meets its inflation target.
Irrespective of the comments thus far, the SNB may be running out of options. The rise of the Franc has put the Central Bank in a difficult situation with the likelihood of intervention growing.
Technical Analysis - USD/CHF
From a technical standpoint, USD/CHF appears to have found a bottom around the 0.8079 handle with the last two days of bullish daily candle closes a positive sign for further gains.
However, today's daily candle is on course for an inside bar handing man candle close which is a bearish sign and may spook market participants. Given that the moves are largely driven by tariff developments, a visit to recent lows cannot be ruled if the US-China stalemate drags on.
USD/CHF Daily Chart, April 24, 2025
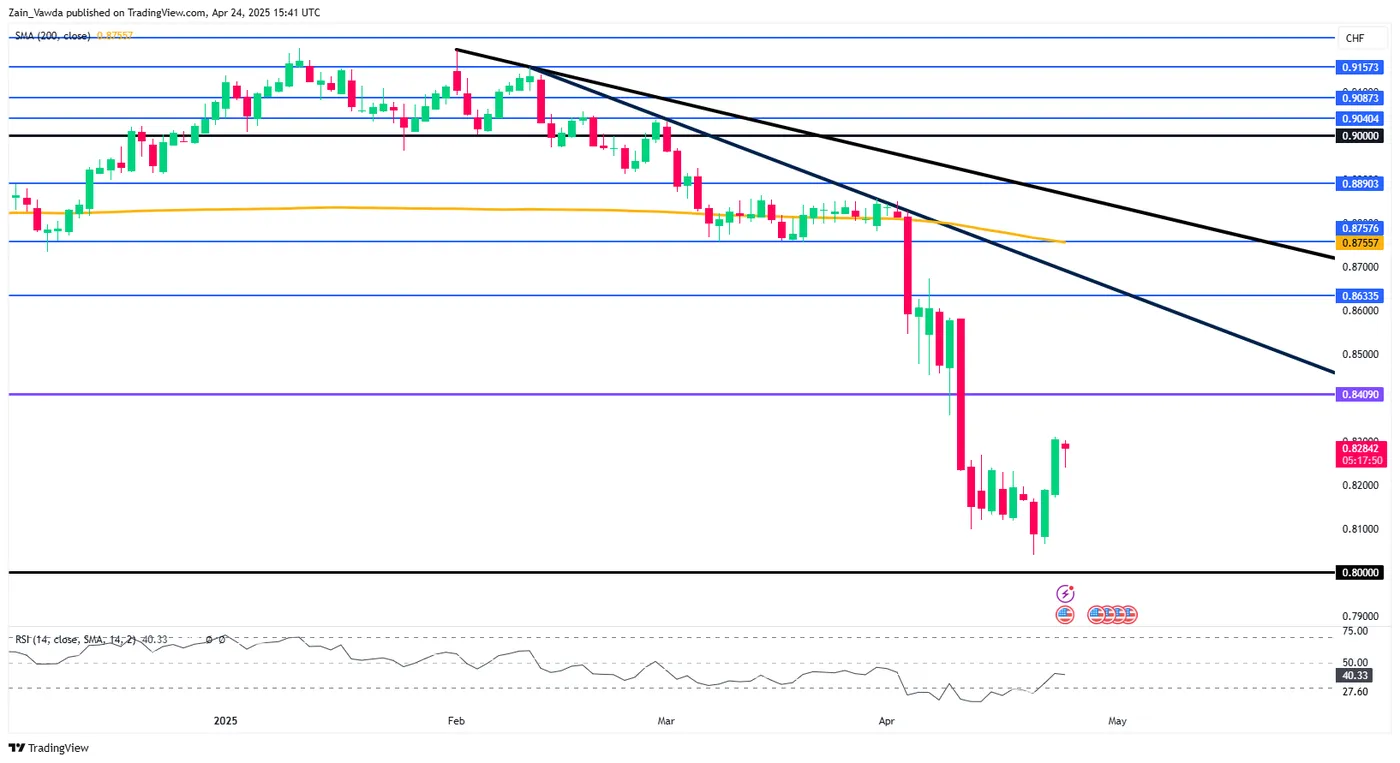
Source: TradingView (click to enlarge)
Dropping down to a four-hour chart and the trendline break does support further upside.
A move higher faces resistance at 0.8350 and 0.8409 handles before the 200-day MA and significant swing high at 0.8577 come into focus.
There is also a chance of a trendline retest if the tit-for -tat between the US and China continues.
In such a scenario, support rests at 0.8200 before the trendline becomes support and lastly we have the psychological 0.8000 handle which could finally come into play.
USD/CHF Four-Hour Chart, April 24, 2025
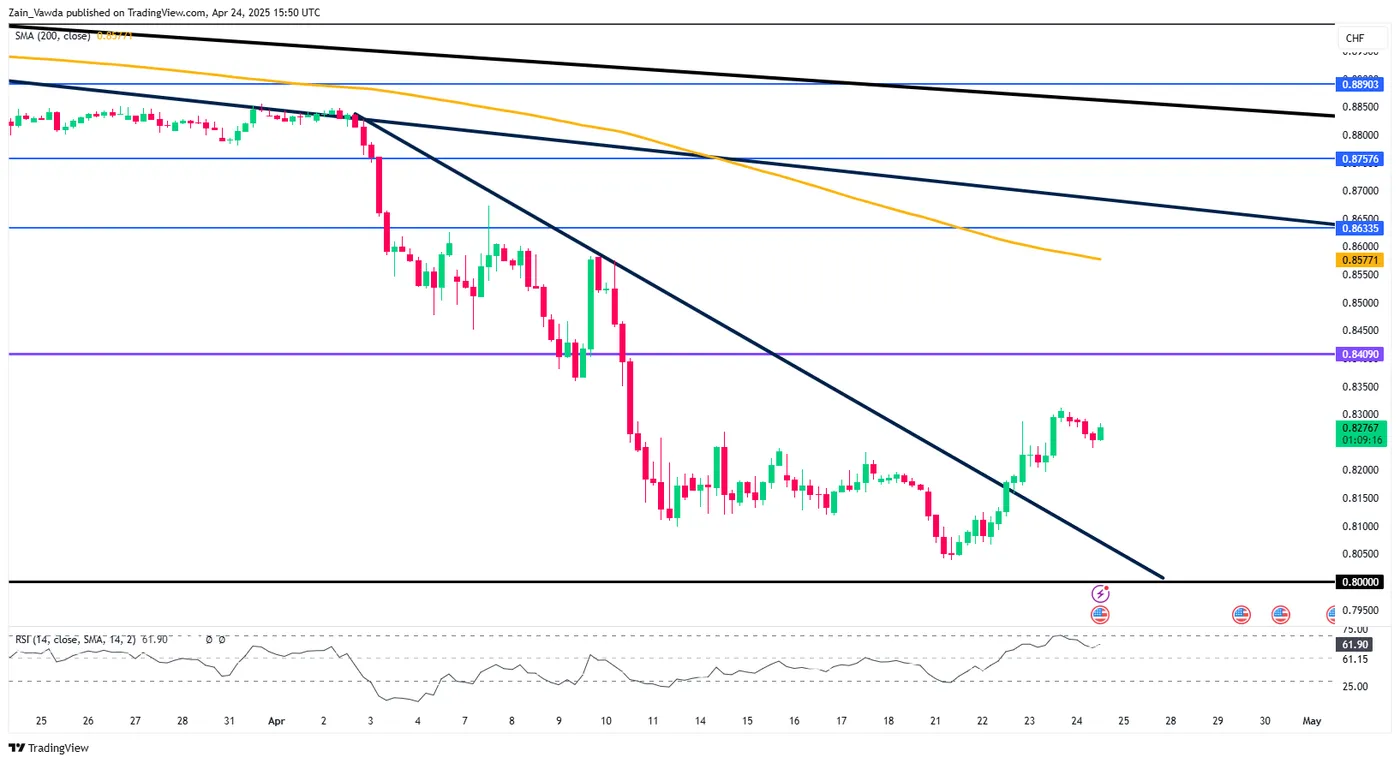
Source: TradingView (click to enlarge)
Client sentiment data
Taking a look at client sentiment data and 86% of traders are currently net-long USD/CHF. I tend to take a contrarian view toward sentiment which means that USD/CHF could face a downside correction in the short-term.