Sample Category Title
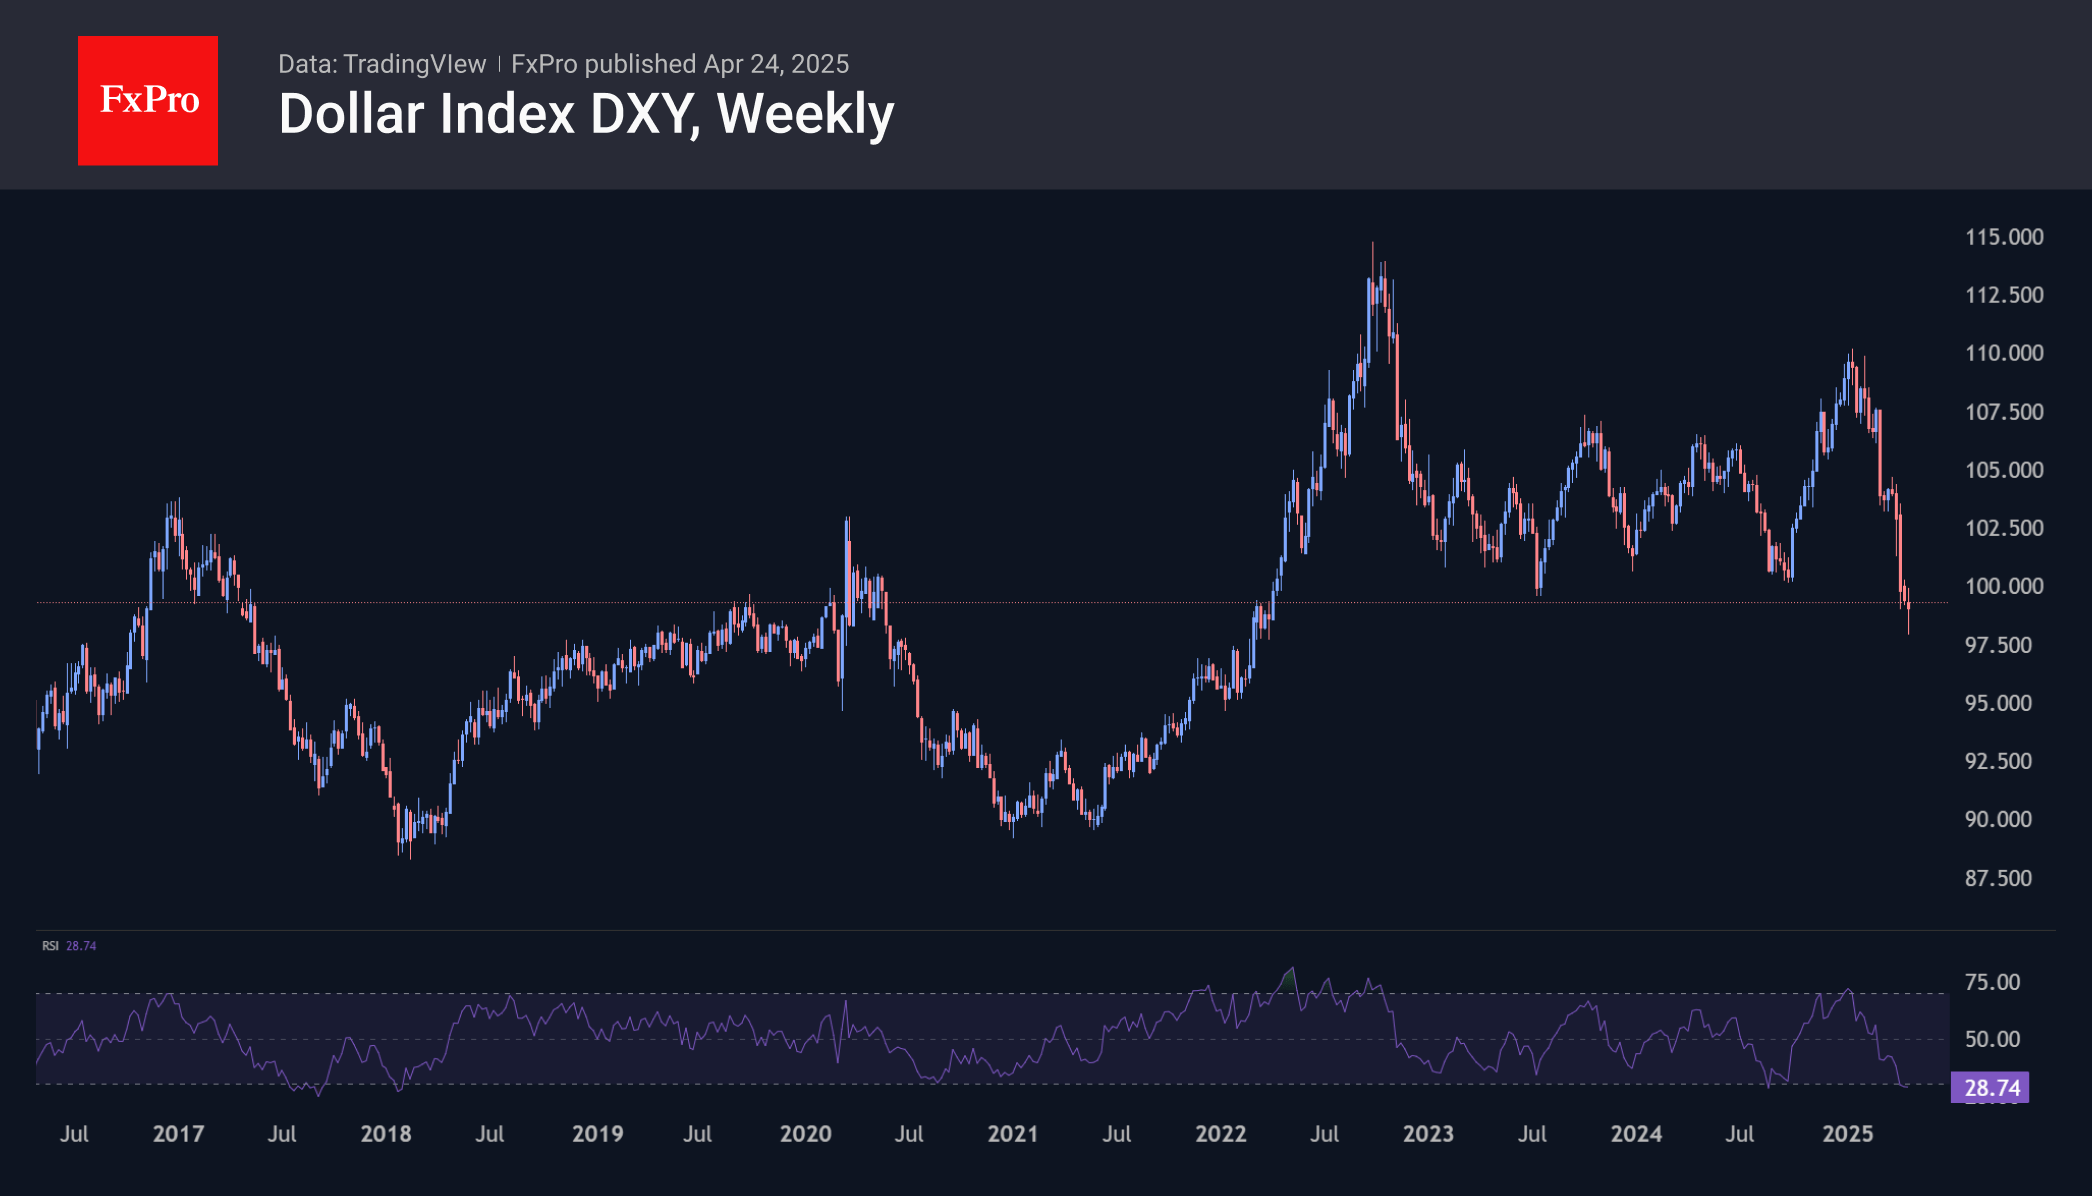
Dollar: Set to Bounce Back
The U.S. currency started the week by hitting three-year lows against a basket of key currencies, but soon closed the gap on DXY, rising from 97.7 to 99.7. However, the upward trend has not yet developed. Unresolved trade disputes between the US and China continue to undermine the US currency’s position, creating impulses for a simultaneous sell-off in USD, equities and bonds.
We saw positive traction when markets received assurances that Trump would not fire Powell. But we also continue to note the Fed’s rather hawkish rhetoric. Open Market Committee members are openly saying they will not rush to cut rates and are wary of the impact of tariffs on inflation. That said, interest rate futures give a more than 50% chance of four. That’s a marked shift from 2-3 cuts a month earlier, which underlies the current dollar weakness. It’s a worrying bet that Powell will have to pull the economy out of recession at the end of the year.
Technical analysis suggests an increased chance of a corrective bounce since the start of the year, as there is consolidation after the failure. At the same time, historical data previously showed that after the rebound, one should be ready for a new wave of decline in the US currency.
Gold Wave Analysis
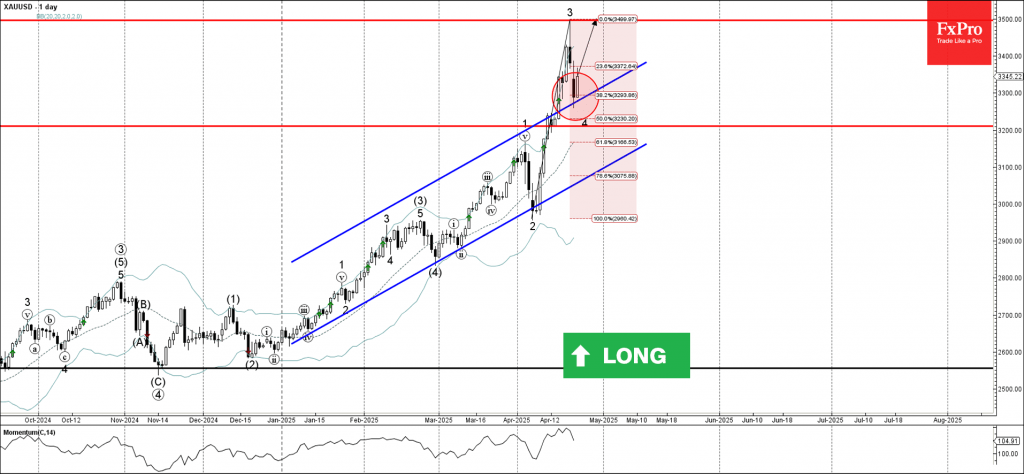
Gold: ⬆️ Buy
- Gold reversed from support area
- Likely to rise to resistance level 3500.00
Gold recently reversed up from the support area between the upper trendline of the daily up channel from January and the 38.2% Fibonacci correction of the upward impulse 3 from last month.
The upward reversal from this support area stopped the previous minor downward correction 4 which started earlier from the key resistance level 3500.00.
Given the strong daily uptrend, Gold can be expected to rise in the active impulse wave 5 toward the next resistance level 3500.00.
EURUSD Wave Analysis
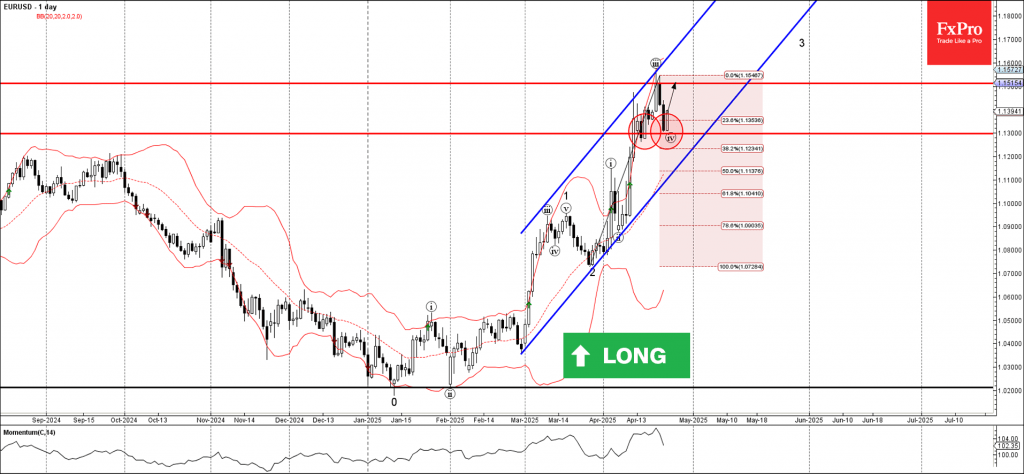
EURUSD: ⬆️ Buy
- EURUSD reversed from support area
- Likely to rise to resistance level 1.1510
EURUSD currency pair recently reversed up from the support area between the key support level 1.1300 (which also reversed the price at the start of April) and the 38.2% Fibonacci correction of the upward impulse from March.
The upward reversal from this support area stopped the earlier short-term ABC correction iv from the middle of April.
Given the clear multi-month uptrend, EURUSD currency pair can be expected to rise toward the next resistance level 1.1510, which stopped the earlier impulse wave iii.
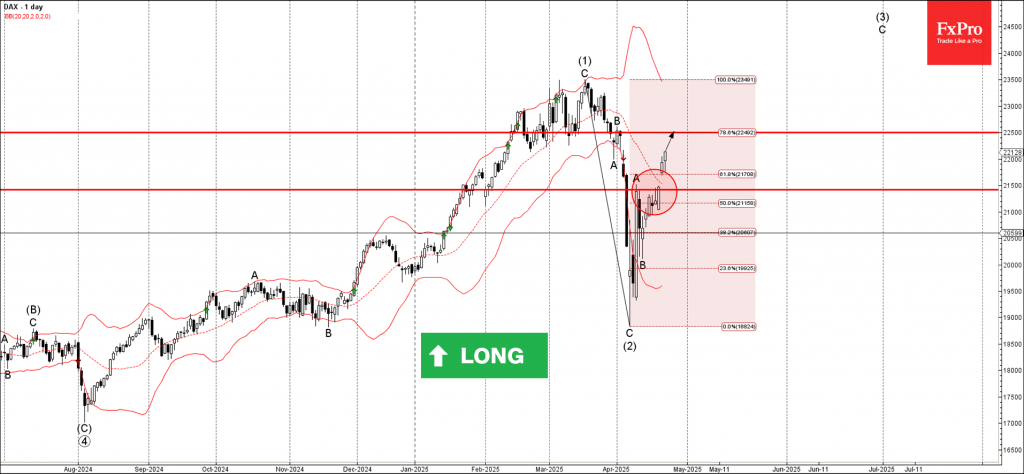
DAX Wave Analysis
DAX: ⬆️ Buy
- DAX broke resistance area
- Likely to rise to resistance level 22500.00
DAX index is under the bullish pressure after it broke the resistance area between resistance level 21500.00 (top of the previous correction A) and the 61.8% Fibonacci correction of the downward ABC wave (2) from March.
The breakout of this resistance area accelerated the active impulse wave (3) from the start of April.
Given the clear daily uptrend, DAX index can be expected to rise toward the next resistance level 22500.00 (which stopped wave B of the earlier ABC wave (2)).
Which is the Best Trade War Proxy in the FX Arena?
- Tariffs remain at the top of investors’ agendas.
- Wall Street and gold have been very responsive to headlines.
- But which FX pair is best reflecting the turbulence?
- Aussie/franc has the strongest correlation with the S&P 500.
Markets in the mercy of Trump’s tariff rhetoric
Since Donald Trump entered the White House, market participants have been keeping their gaze locked on his remarks and policies, especially when it comes to tariffs and trade.
On April 2, the so-called “Liberation Day”, he announced tariffs on all of the US’s trading partners, and since then, he has been playing a back-and-forth game, adopting aggressive rhetoric on one day, and proceeding with delays or expressing willingness to negotiate on the other.
His chaotic strategy has been well reflected in the markets, with risk-linked assets, like equities, tumbling when the outlook becomes blinker, and rebounding when Trump is softening his stance. The opposite is true for safe havens, like gold, which amidst this turbulence hit a record high of around $3,500 on April 22.
How has the forex market been behaving?
Things are a bit more complicated in this market, as currency pairs consist of two currencies and each of them has their own drivers. The most profound reaction in the current environment is the tumbling of the US dollar but given that the world’s reserve currency has been on the back foot nearly against all its major counterparts, it is very hard to grasp sentiment swings by observing a dollar pair.
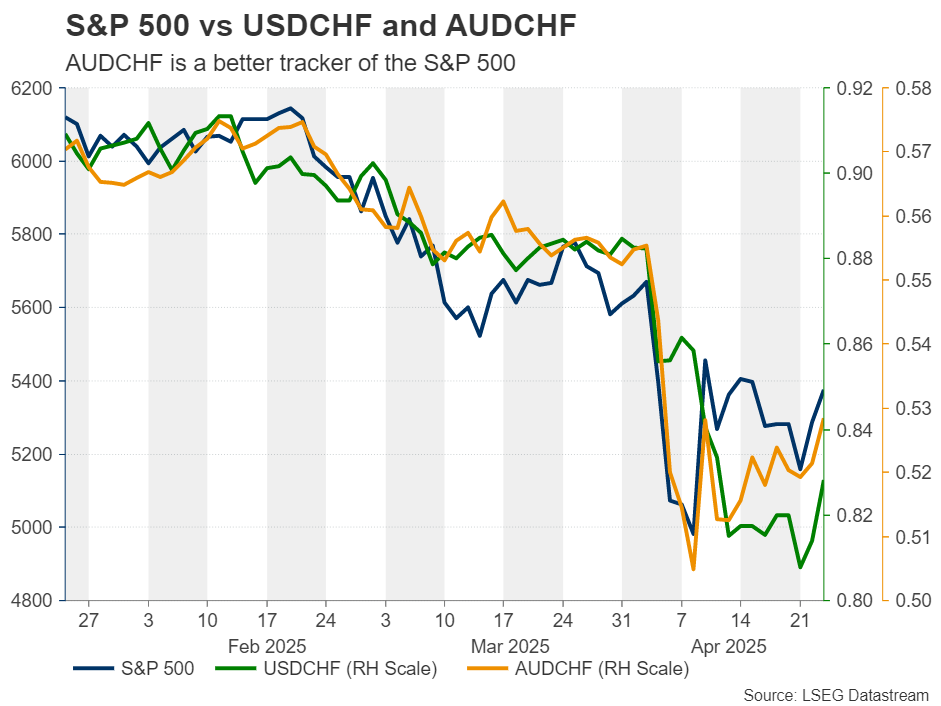
Even if someone choses the dollar against the safe-haven Swiss franc, which saw strong gains when the markets entered panic mode, the correlation of dollar/franc with the S&P 500 is not as strong as the correlation of aussie/franc with the Wall Street index.
Is aussie/franc the best tariff proxy?
But why is an FX pair that does not include the US currency so strongly correlated with the US stock market? This may have to do with the fact that in Trump’s main enemy when it comes to tariffs is China; and China is the main trading partner of Australia. So, when US-Sino tensions escalate, the aussie slides, while it gains when hopes of a deal between the world’s two largest economies arise.
What about aussie/yen?
The yen has also worn its safe-haven suit in this environment, but its responses where less aggressive compared to the Swiss franc. Perhaps investors did not show the same preference for the yen as the tariff-related turmoil and economic concerns prompted market participants to scale back their BoJ rate hike bets. From assigning an 80% chance of a 25bps hike in June, they are not seeing a 50% probability of a hike by the end of the year.
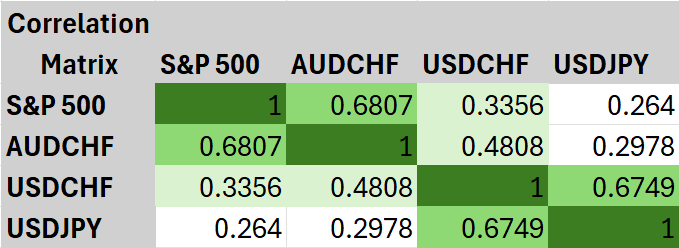
Aussie/franc has the strongest correlation with the S&P 500
Concluding, the best proxy for Trump’s tariff chaos in the FX arena is aussie/franc and the table below is confirming the argument as it has a stronger correlation with the S&P 500 than other candidates.
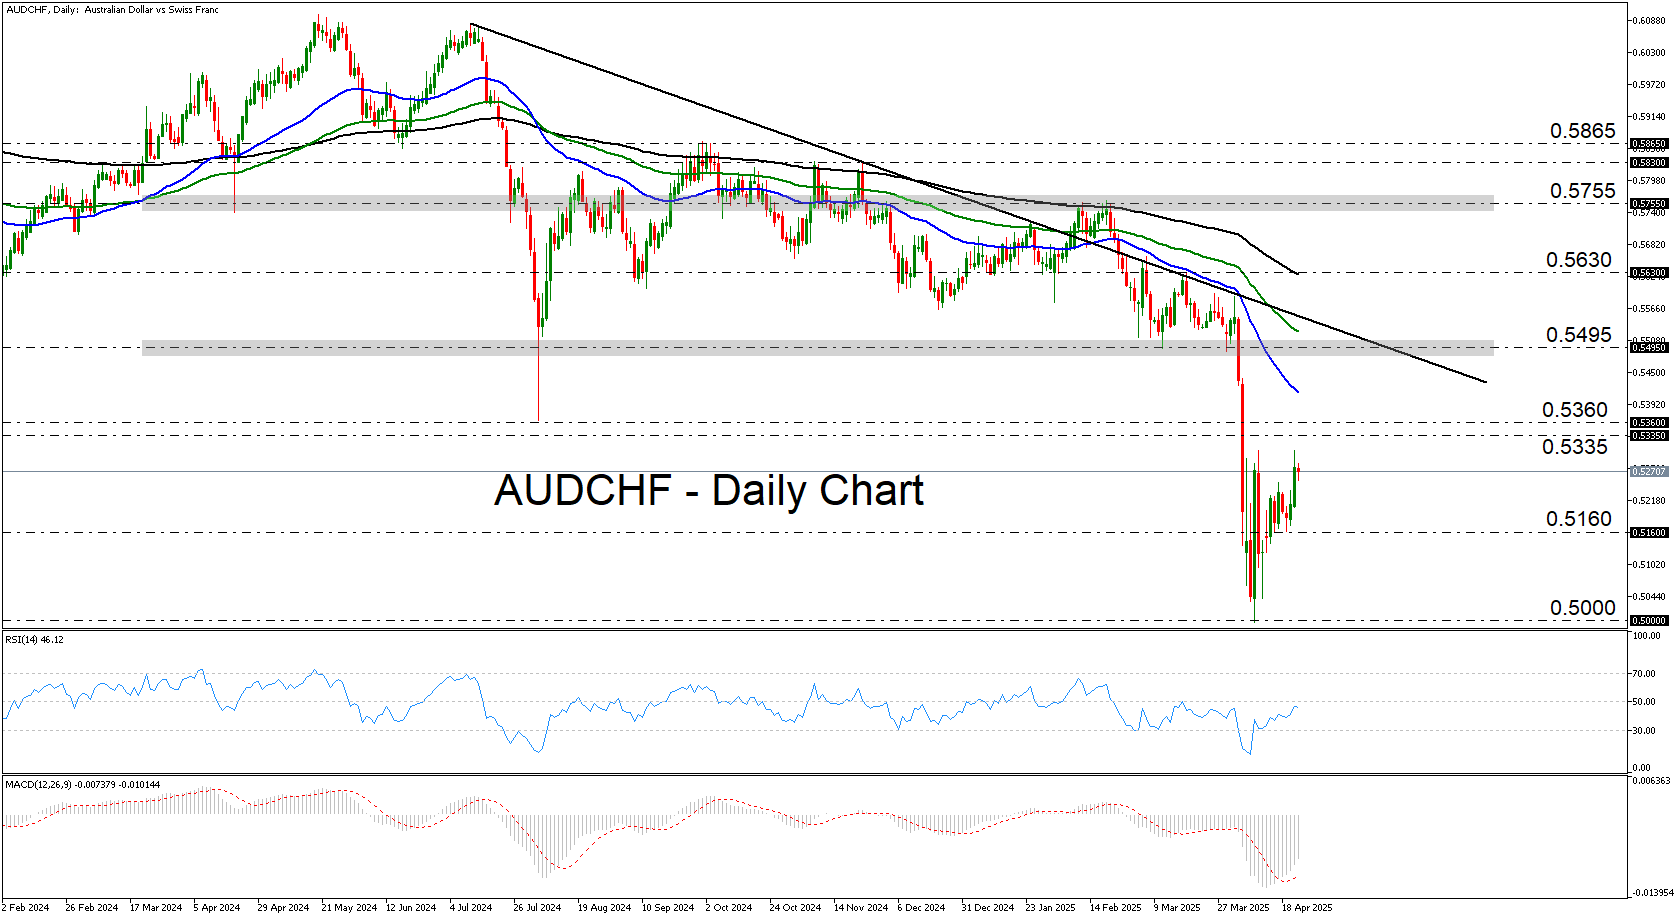
Despite the recovery, the outlook remains gloomy
From a technical standpoint, aussie/franc entered a recovery mode after hitting a record low of 0.5000. Although the pair is getting closer to the key resistance (prior support) area of 0.5335/60, it is still trading well below the downtrend line drawn from the high of July 11. This suggests that the bears may feel confident to jump back into the action at any time. If they do so from below 0.5335, they may initially aim for the low of April 21, the break of which could allow for declines and another test near the round number of 0.5000.
On the upside, a move back above 0.5495 would switch the outlook neutral, while the move that could signal the beginning of a bullish trend may be a break above 0.5755.
Cliff Notes: Possibilities and Probabilities
Key insights from the week that was.
There was no significant data of interest in Australia this week, bookended by Easter Monday and ANZAC Day public holidays, leaving the market’s focus on developments offshore.
In the US, markets continued to react quickly to headlines around trade policy, most of which were tempered in subsequent communications. This includes recent reports of President Trump considering cutting tariffs on Chinese imports by 50-65%, to which Treasury Secretary Bessent later clarified that there is no “unilateral” offer on the table, suggesting such outcomes would require mutual action from China. Also, reports of a potential exemption of tariffs on auto parts before the May 3 deadline were seemingly rebuked by President Trump shortly after. Markets also grew anxious over the prospect that President Trump’s disdain over the FOMC’s policy approach could lead to an attempt to oust Chair Powell, but nerves have since been calmed as President Trump explicitly stated that he had no plans to fire the Federal Reserve Chair.
On balance, markets are viewing recent messaging as more constructive, but the persistence of back-and-forth headlines on ‘possible’ avenues for trade policy, none of which have been officially delivered, leaves an air of uncertainty looming over the outlook.
The data flow broadly agreed with this assessment. This week, the Federal Reserve’s Beige Book reported that while there have been few material changes in overall economic activity since March, uncertainty is heightened across several districts, especially as it relates to tariffs. Spending was mixed, with the ‘front-running’ of vehicle purchases ahead of tariffs able to offset declines in consumption elsewhere. However, many businesses are adopting a cautious approach to their investment and hiring intentions until there is more clarity on economic conditions, though relatively few firms are preparing for layoffs as of yet.
The US S&P Global PMIs were somewhat mixed. Manufacturing beat expectations for a decline, instead lifting from 50.2 in March to 50.7 in April. Meanwhile, growth in services activity moderated by more than expected, falling from 54.4 to 51.4. While the exact impact of tariffs on current conditions is not yet clear, the report noted that business expectations have dropped to their lowest level since the pandemic and that tariffs are the main contributor to recent price rises. While next week’s Q1 GDP data is likely to capture some big swings around imports and inventories amid tariff ‘front-running’, the onset of deep pessimism among US households and its impact on underlying consumer spending will be an important focus.
Similarly, across the pond, the Eurozone’s HCOB PMIs also revealed that manufacturing conditions fared better than consensus feared, holding broadly steady at 48.7 in April. Most manufacturers are reportedly “not too fazed” in the face of broad-sweeping tariffs of 10% and auto-specific tariffs of 25%, however the services gauge disappointed, falling from 51.0 to 49.7 as business confidence plummeted to its weakest level since 2020.
Meanwhile in the UK, the S&P Global PMIs suggest that growth slowed considerably moving into the second quarter, with manufacturing conditions sliding further into deep contraction while services activity surprised materially to the downside, falling from 51.5 in March to 48.2 in April. Against a backdrop of aggressive job cutting and deep business pessimism, the report noted these results are consistent with GDP contracting at a quarterly rate of –0.3%.
Finally in Japan, April’s Jibun Bank PMIs continued to report sluggish conditions in the manufacturing sector, with a sharp decline in new orders as a result of weakening foreign demand and growing uncertainty over tariffs. In contrast, the services sector reported a bounce in demand, seeing the index move into expansionary territory. Both sectors are reporting acute inflationary pressures, which for policymakers’ looking to achieve long-term sustainable inflation, is likely viewed as another welcome signal. However, this is unlikely to shift the dial just yet, with the Bank of Japan expected to keep rates on hold at its policy meeting next week.
Sunset Market Commentary
Markets
Yesterday’s US risk rebound shifted in lower gear. It adds to our cautious view on the durability of such moves in these headline-based trading circumstances where the outlook remains clouded as ever. The “meaning” of Wednesday’s upside rip headlines - “I have no intention to fire him [Fed chair Powell]” & “We’re going to be very nice [to the Chinese]” - was watered down mere hours later. First by US Treasury Secretary Bessent, then WH press secretary Leavitt and finally to a certain extent by president Trump himself. Adding to the whipsawing trade narrative was China maintaining a tough stance. It implored the US to revoke all tariffs it imposed. The Wall Street Journal yesterday reported the US was mulling to cut (not fully remove) them with Bessent later adding that it would not do so unilaterally. Stocks already finished well of the intraday highs on Wednesday and continue to thread water today. Core bonds gain with Treasuries slightly outperforming Bunds. US rates drop between 4.6 and 7.5 bps with declines growing on arrival of the first US investors. German yields drop up to 6.6 bps at the front, helped by comments from Finish ECB governing council member Rehn. He doesn’t want to rule out larger rate cuts in a monetary policy which he said needs to be agile and active. While saying the great uncertainty requires the ECB to keep an open mind on next steps, Rehn saw few good arguments to pause the cutting cycle, referring to growth risks identified in March that are materializing and financial conditions having tightened. Chief economist Lane later offered a more balanced view. On the 50 bps cut matter he stressed the theoretic nature of the debate. He said the euro area growth forecasts will see a moderate markdown in June but remains optimistic over the longer term. Either way, the comments don’t impact the euro, which is gaining against the biggest G10 peers including the US dollar. EUR/USD recovers some of the recent declines to trade around 1.138. The USD in general is pressured with the trade-weighted index sliding towards 99.34 again. Both JPY and CHF trade higher, revealing a cautious stance in (FX) markets.
News & Views
Czech economic sentiment in April dropped from 99.5 (best since mid-2022) to 96.7 (lowest since October last year). The decline was both due to a weaker business confidence (96.5 from 99.6) and a more modest decline in consumer confidence (97.7 from 98.8). Confidence only increased in construction (+ 0.6 points), but decreased the most in industry (-4.5 points), followed by trade and selected services. The share of consumers expecting the overall economic situation and their own financial situation to deteriorate over the next twelve months increased. The proportion of consumers who believe that the current period is not conducive to making large purchases decreased for the second time in a row. In Hungary, the GKI economic sentiment indicator showed a slightly different dynamic, improving from -16.8 to -15.7. The industrial sector showed signs of recovery while the service sector declined. Confidence in the trade and construction sectors remained virtually stagnant. Still construction continues to be the least optimistic sector, while business services remain the most upbeat. The price indicator, decreased substantially for the fourth consecutive month, reaching a six-month low. Price increase intentions declined across all sectors, consumer confidence after reaching a low point in November 2024 has improved somewhat. Most sub indicators in the survey improved while at the same time inflation expectations decreased.
Belgian business confidence stabilized in April, improving slightly from -15.1 to -14.7 and ducking the feared deterioration to -16. Today’s outcome is still the second weakest one since January 2024. The confidence of business leaders rose in the manufacturing industry but fell further in the building industry and in business-related services. The uptick in manufacturing (-16.1 from -18) was mainly due to a significantly more favourable assessment of total order books combined with a sharp upward revision of the outlook for overall market demand. In the business-related services sector (-9.3 from -7.6), the NBB noticed worse assessments of current and future activity levels even though expectations for overall market demand improved as well. Aside from demand expectations, all components contributed to the drop in subindicator for the building industry (-13.1 from -10.1). The business climate also worsened in the trade sector (-17 from -14.3) after two consecutive months of recovery.
Fed’s Hammack: May too early for rate cut, eyes June for clearer data
Cleveland Fed President Beth Hammack told CNBC that it’s “too soon” to consider easing interest rates at the May 6-7 FOMC meeting. Emphasizing the need for patience, Hammack said she prefers to “take our time” and monitor how the economy evolves rather than acting prematurely.
While Hammack stressed an open-minded approach to every meeting, she suggested that clearer direction could emerge by June.
“If we have clear and convincing data by June, then I think you’ll see the committee move,” she said, noting that any decision would depend on whether the incoming information provides a strong signal on the appropriate policy path.
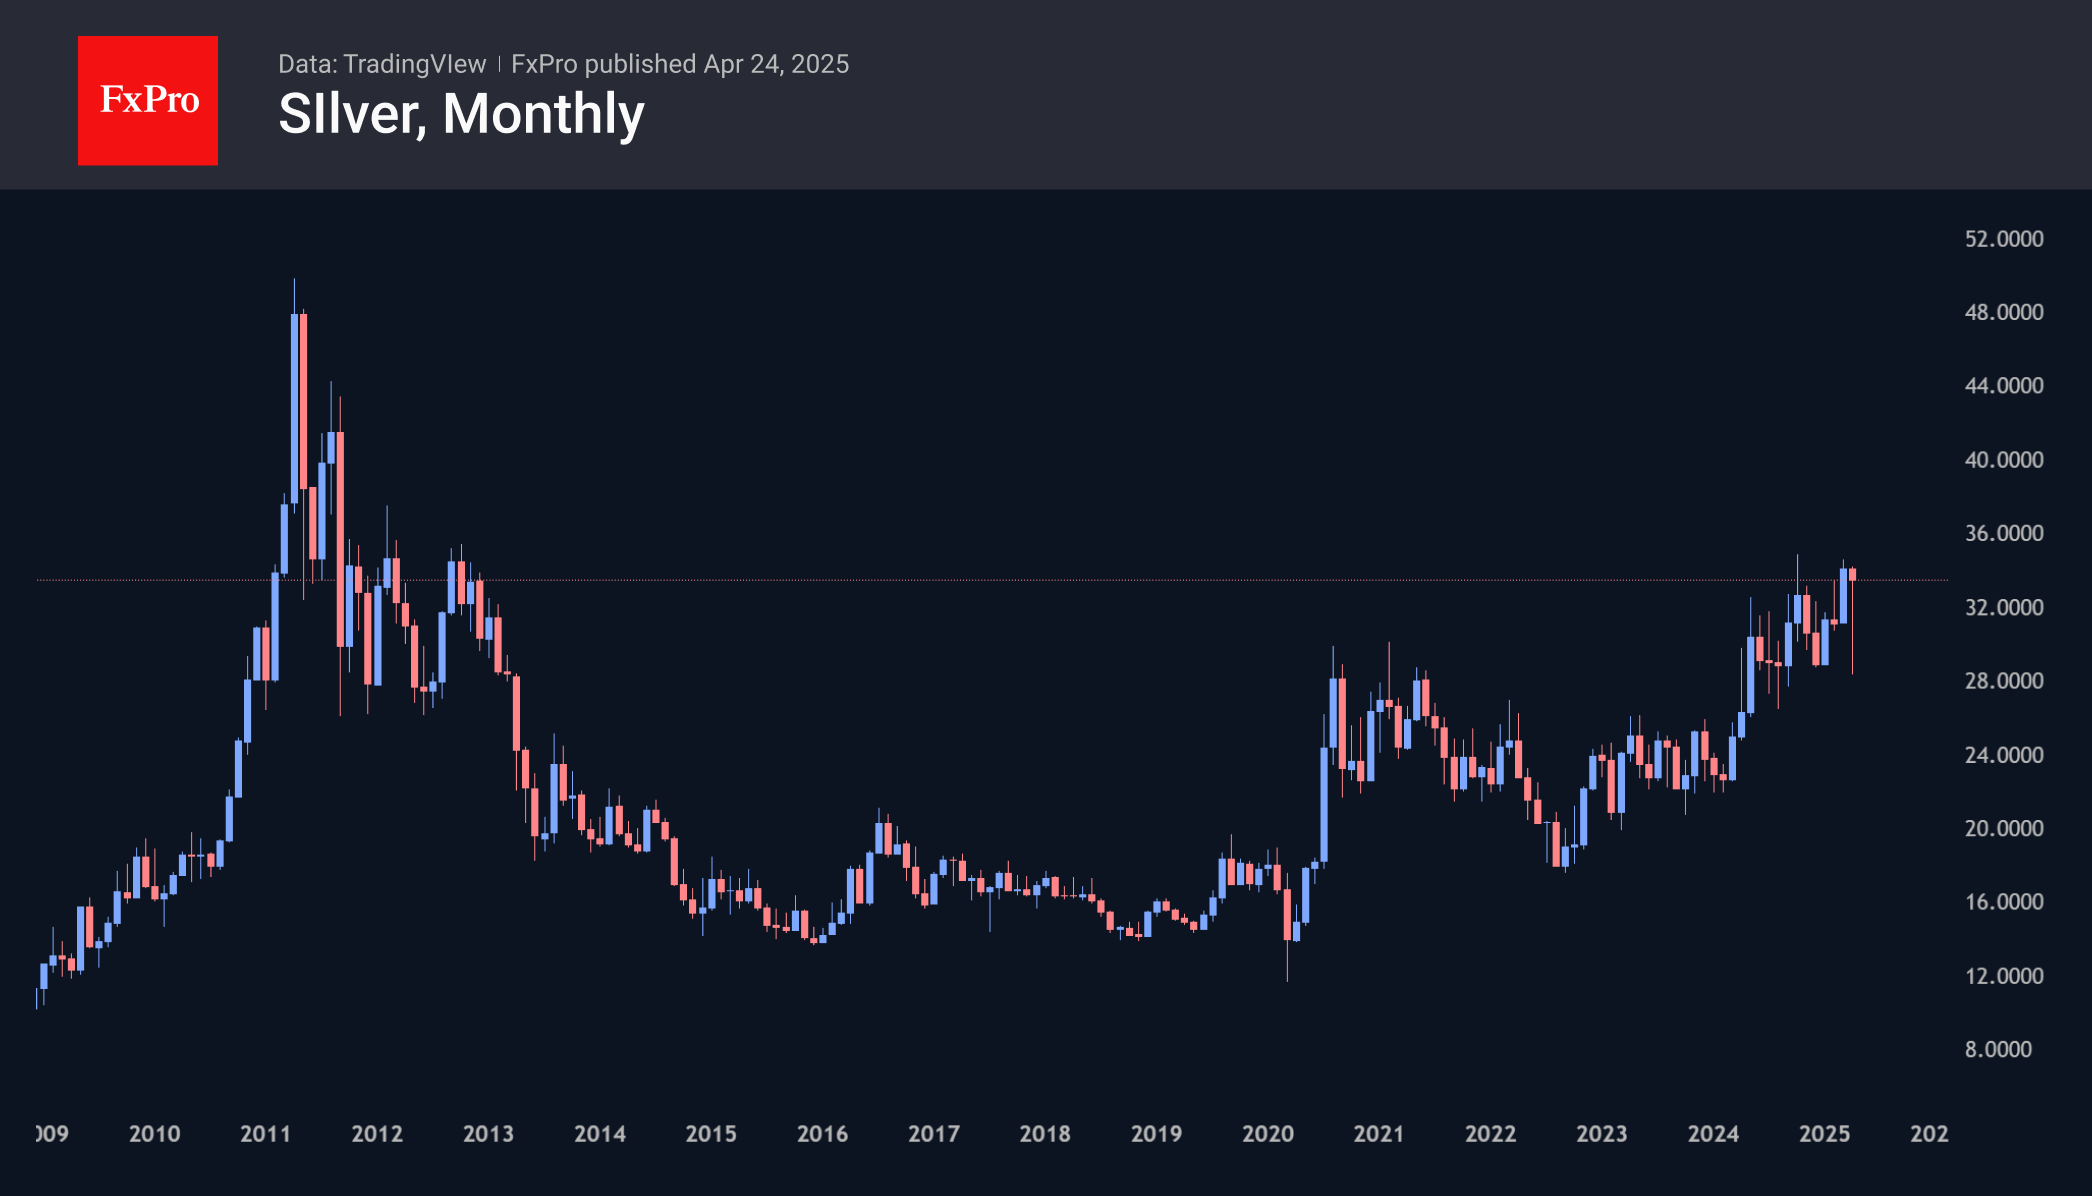
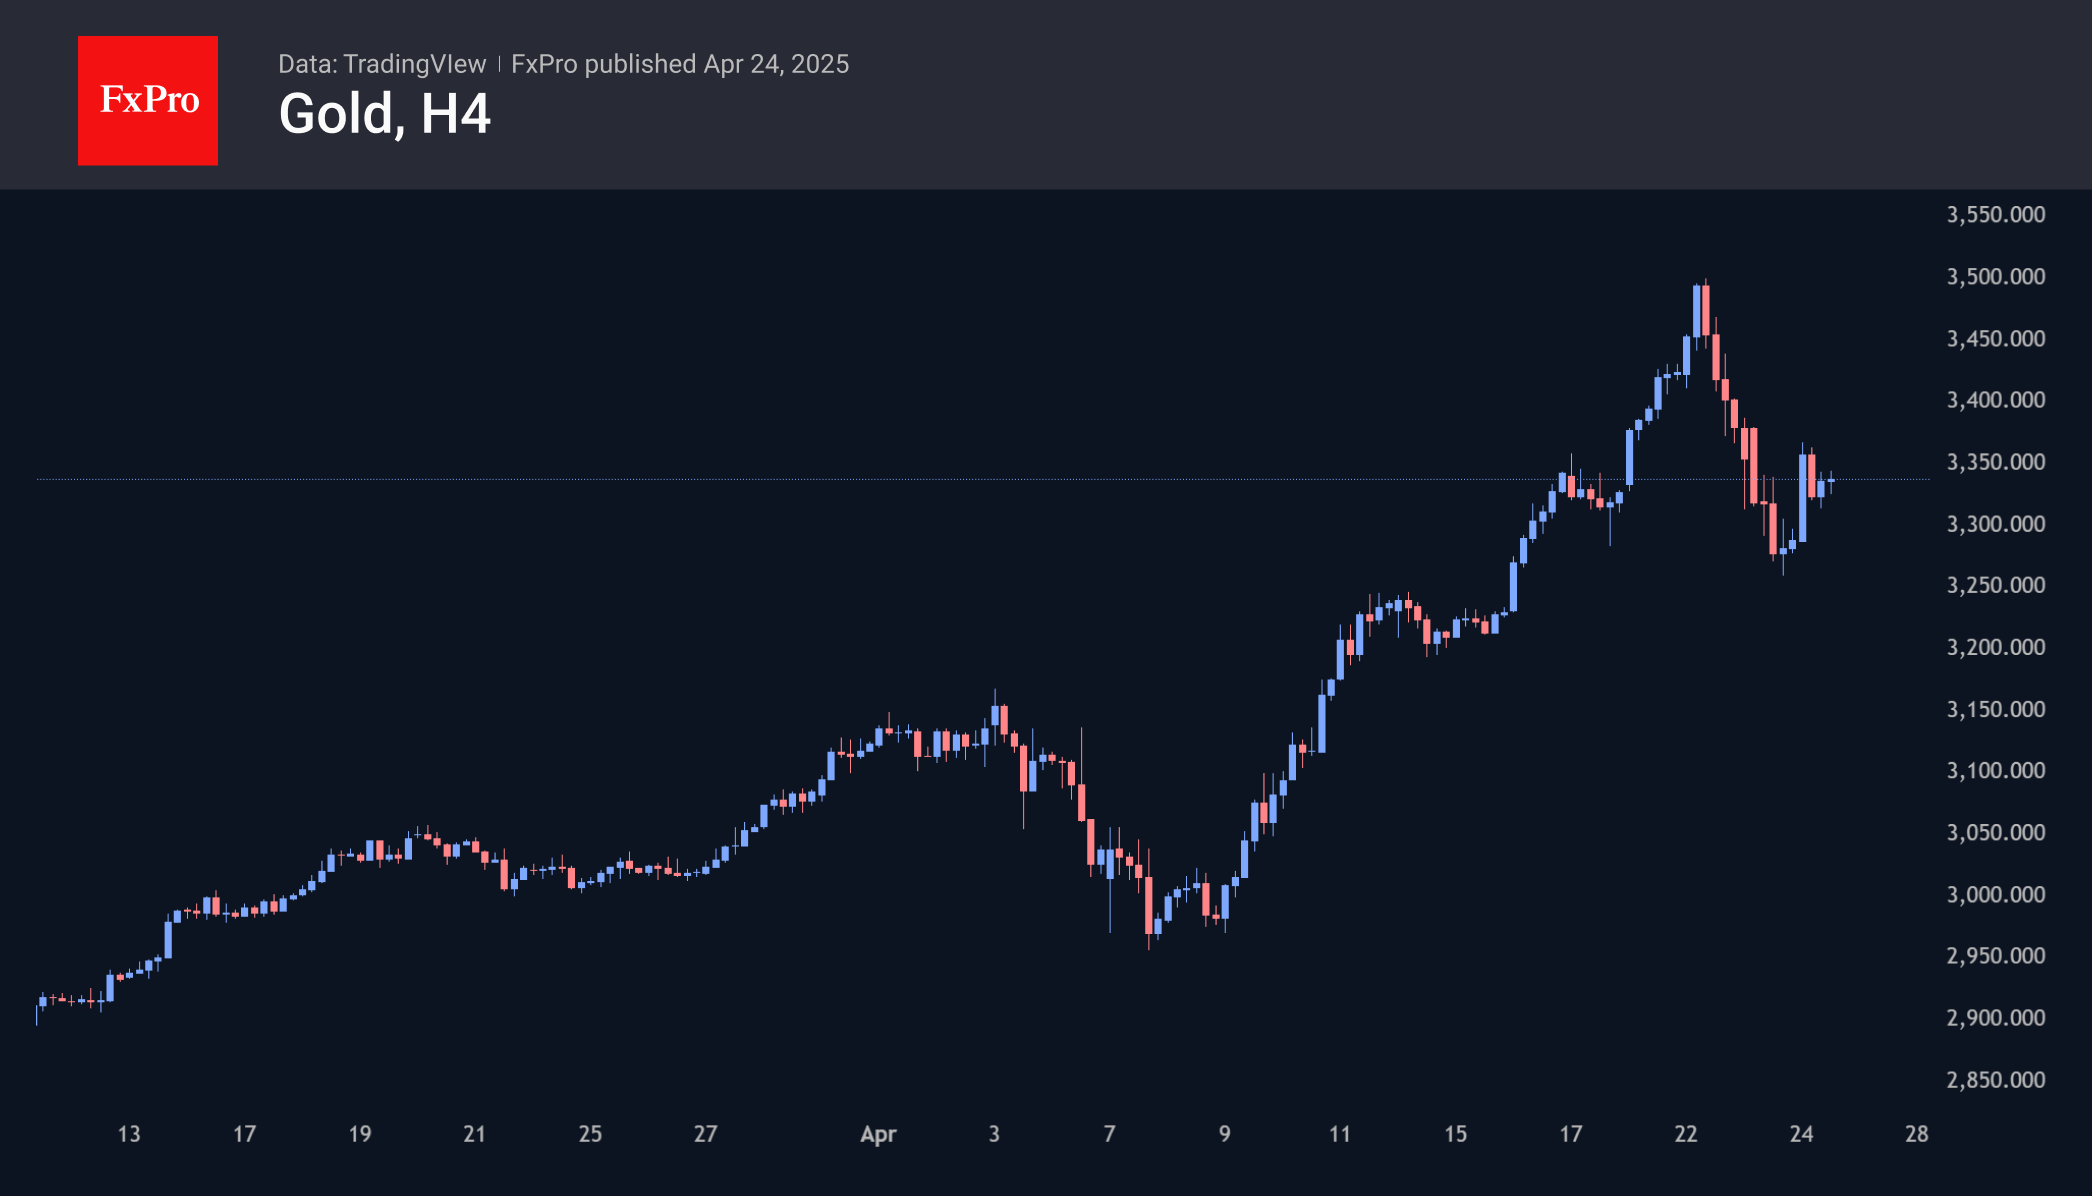
Gold: Volatility at the Top
Gold’s 5% rally in the first 30 hours of the trading week, and touching the important round level of $3500, was followed by a steep fall to $3260 in the next 30 hours. After that, the price stabilised at $3340, close to the highs of the previous week.
Signs of a ‘head and shoulders’ pattern are forming on the charts. In case of a new decline under $3300, we may witness the acceleration of profit-taking. It may be a selloff after a dizzying rally, with the potential to go below $3000, mirroring early April’s growth. The long-term technical picture points to continued overheating and elevated correction potential.
An alternative medium-term scenario is that the massive decline has already cleared the way for a new wave of gains. The news on tariffs and geopolitical tensions has enough power to override the entire technical picture.
Silver is moving asynchronously to gold. It has almost managed to climb out of the hole it fell into in early April. This return to the highs of October 2024 and March 2025 is of great significance. From around this area near $34, we also saw a reversal in 2012, after which the price lost 60% in the following three years.