Sample Category Title
UK Retail Sales Beat Forecast, Pound Edges Lower
The British pound has edged lower on Friday. In the European session, GBP/USD is trading at 1.3214, down 0.17% on the day.
UK retail sales climbs 0.4%
UK retail sales were a ray of sunshine in March. Monthly, retail sales rose 0.4%, beating the market estimate of -0.4% but below the revised 0.7% increase in February. Clothing sales showed strong growth as shoppers took advantage of the sunny weather.
Annualized, retail sales rose 2.6% from a revised 1.8% gain in February and above the market estimate of 1.8%. This was the strongest gain in three months.
UK consumer confidence worsens
The strong retail sales was a pleasant surprise but the consumer economy remains fragile. The GfK consumer confidence index deteriorated in April to -23 from -19 and below the market estimate of -22. This was the lowest level since November 2023.
Consumers are concerned over the rising cost of living and worsening global trade tensions which has been fuelled by President Trump's tariffs. The GfK survey found that consumers are anxious that inflation will continue to rise due to the US tariffs.
The Bank of England is following trade tensions carefully as well. On Thursday, Governor Andrew Bailey said that the BoE was "quite focused on the growth shock" for the UK from the tariffs, although he said the UK was not close to a recession. If the global trade war intensifies, it will weigh on UK growth but will also push inflation lower.
US consumer inflation expectations expected to climb
President Trump's tariff policy is expected to raise inflation and consumers are anxious that inflation will rise sharply. The UoM consumer inflation expectations index jumped to 6.7% in the initial April release, up from 5.0% in March. Today's final release is expected to confirm this figure, which would mark the highest level since Nov. 1981.
GBP/USD Technical
- GBP/USD is testing support at 1.3313. Below, there is support at 1.3277
- There is resistance at 1.3375 and 1.3411

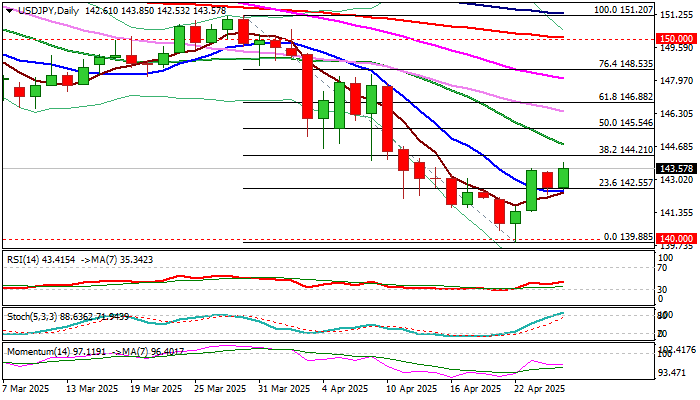
USD/JPY: Inflated by Fresh Risk Appetite But Still Lacks Clearer Direction Signal
USDJPY remains constructive as bounce from multi-month low (139.88) holds above broken Fibo level at 142.55 (23.6% of 151.20/139.88 bear-leg, reinforced by 10DMA) for the third consecutive day.
Safe haven yen benefited from the recent uncertainty over US trade tariffs and anticipated negative impact on global economy, advancing over 10% from its January low vs US dollar, but the latest calmer tones that come from two biggest world’s economies (USA and China) faded safe haven demand that could further pressure yen if situation continues to improve
Friday’s fresh gains fully reversed Thursday’s drop, keeping in play hopes for attack at pivotal Fibo barrier at 144.21 (38.2% retracement) break of which to strengthen the structure and open way for stronger recovery.
However, predominantly negative daily studies (bearish momentum is still strong and stochastic is overbought) warn of possible recovery stall.
Look for reaction on key levels (142.55 or 144.21) which would provide clearer direction signals.
Res: 143.85; 144.21; 144.78; 145.54.
Sup: 142.55; 141.65; 141.41; 140.47.
SNB’s Schlegel: Growth may miss forecasts due to trade uncertainty
Swiss National Bank Chairman Martin Schlegel warned at the central bank's annual general meeting that high levels of trade policy uncertainty continue to cloud the economic outlook.
“It remains very uncertain how inflation and the economy in Switzerland will develop,” Schlegel said, adding that “an economic slowdown cannot be ruled out.”
Growth forecasts are already under pressure, with SNB's March projection of 1% to 1.5% GDP growth this year falling below Switzerland’s long-term average of 1.8%.
Schlegel reiterated that SNB stands ready to adjust policy if needed, including interest rate changes and foreign exchange interventions. However, he acknowledged the limits of monetary policy in addressing deeper structural uncertainty.
“Price stability cannot prevent trade policy uncertainty,” he cautioned, but emphasized that maintaining stable prices provides an essential foundation for the broader economy.
Yen Loses Ground as Tokyo Core CPI Hits 2-Year High
The Japanese yen is in negative territory on Friday. In the European session, USD/JPY is trading at 143.45, up 0.59% on the day.
Tokyo Core CPI rises to 3.4%
Tokyo Core CPI rose to 3.4% y/y in April, its highest level since April 2023. This was sharply higher from the 2.4% gain in March and beat the market estimate of 3.2%. The spike was driven by a reduction in government energy subsidies as well as hikes in food prices. The price of rice, a staple food, has skyrocketed by 93% in the past year and grain prices have jumped 25% during that time. Tokyo CPI also surged to 3.5% from 2.9% in March.
BoJ in wait-and-see-mode
The Bank of Japan won't be able to ignore these hot inflation numbers and is expected to raise interest rates. The BoJ doesn't like to telegraph its intentions and the timeline of another hike is unclear. The central bank will likely hold rates at next week's meeting and the markets are looking at a rate hike in June or July.
US tariffs have complicated matters for the Bank of Japan and could delay the next rate hike. President Trump's trade policy has been erratic and it's still unclear whether he will reduce tariffs against China and other countries. BoJ policy makers are in a wait-and-see stance and hoping that US trade policy will be more clear in the coming months.
Markets bracing for weak US consumer sentiment, inflation expectatations
The US wraps up the week with consumer sentiment and inflation expectations. The UoM consumer sentiment index slipped to 50.8 in April, down from 57.0 in March and the lowest level since June 2022. The final estimate is expected to confirm the weak initial release.
Consumers are expecting a jump in inflation, with the UoM inflation expectations hitting 6.7% in April in the initial release, up from 5.0% in March. The final estimate is expected to confirm the initial reading. This would mark the steepest inflation expectations since November 1981.
USD/JPY Technical
- USD/JPY has pushed above resistance at 143.032 and is testing resistance at 143.42. Next, there is resistance at 144.01
- 142.44 and 142.05 are the next support levels
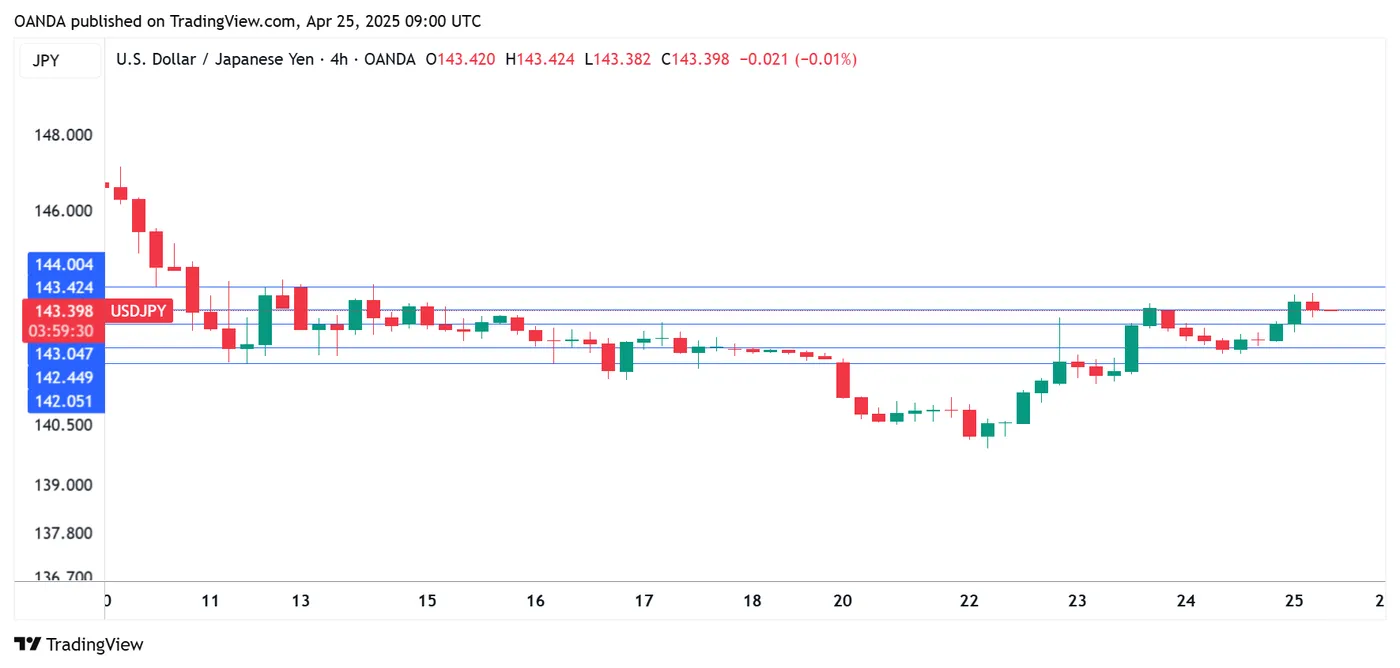
USDJPY 4-Hour Chart, April 25, 2025
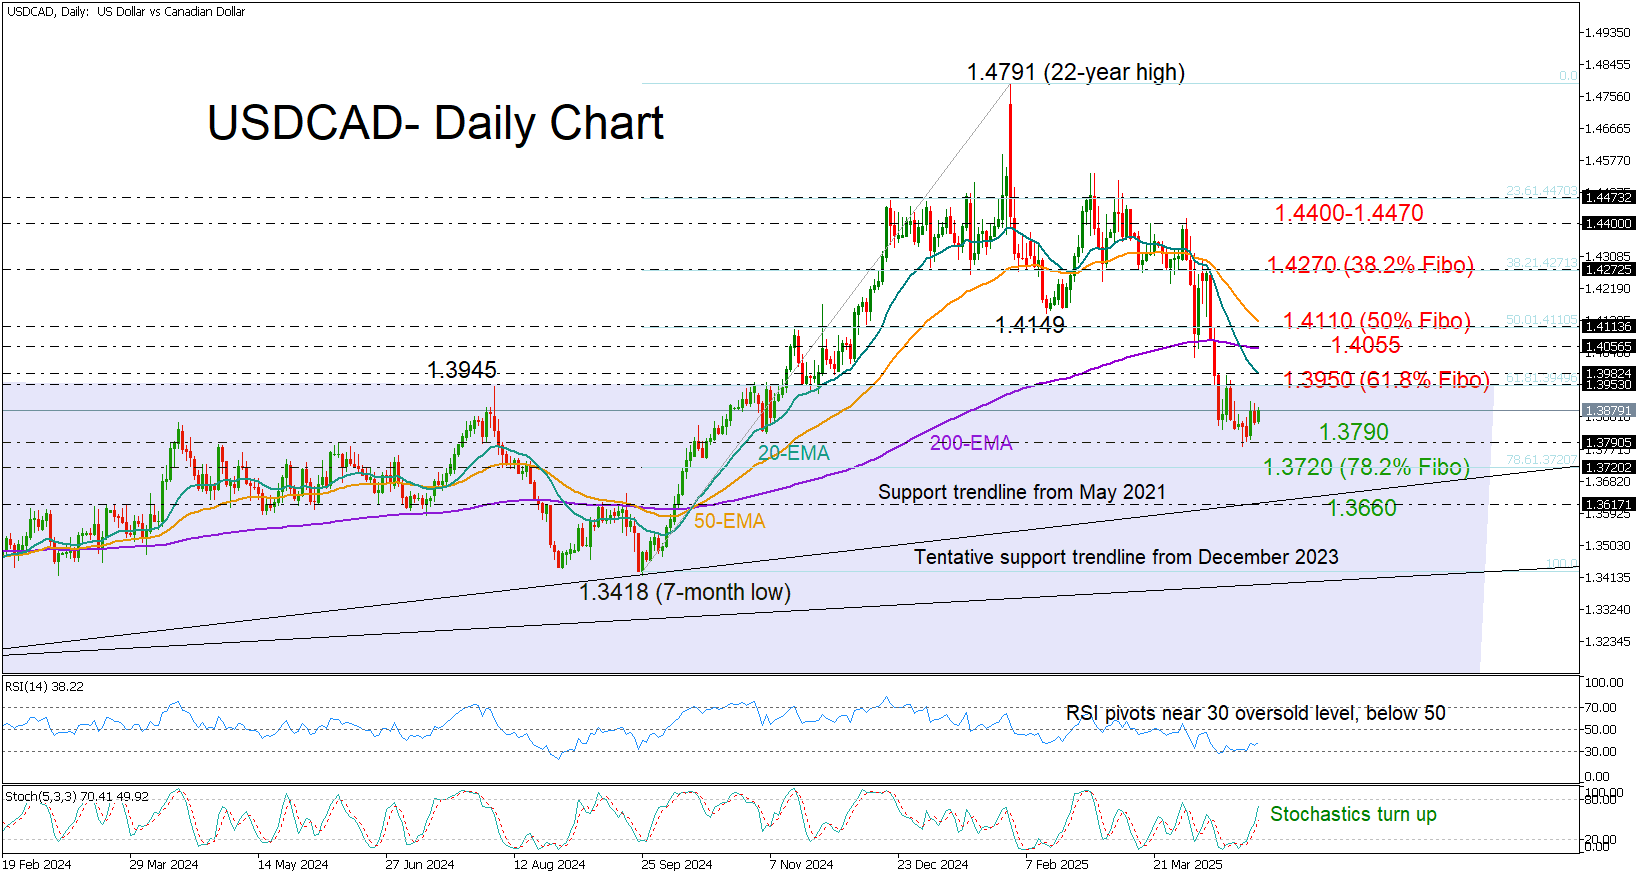
USD/CAD Flatlines: Reversal Ahead?
- USDCAD meets long-term support trendline near 1.3810.
- Technical indicators reflect easing selling interest.
- A decisive move above EMAs needed to shift outlook.
USDCAD saw limited movement throughout the week and is currently heading for a second consecutive neutral close.
However, the sideways trajectory in the price, combined with oversold signals from the RSI and stochastic oscillator, increases speculation that the recent downtrend may have reached a bottom.
Indeed, the price is hovering near the 1.3810 support region from November 6 and around the ascending trendline drawn from the May 2021 low, making a rebound likely. However, for a meaningful recovery, the bulls will need to push above the broad neutral zone at 1.3950 and break through the 20-day exponential moving average (EMA). The 200- and 50-day EMAs could also present resistance near 1.4055 and 1.4120, respectively. A successful breakout could breathe life back into the pair, potentially boosting buying interest toward the 1.4270 resistance zone, while higher, the spotlight may shift to the crucial barrier at 1.4400–1.4470.
In the bearish scenario, where the price retreats below the support trendline near 1.3790, the 78.2% Fibonacci retracement of the September–February rally at 1.3720 could offer temporary relief. Failing that, the sell-off could accelerate toward the 1.3620 support area, which was the neckline of the double bottom pattern formed last September. A break below that level could trigger stronger selling pressure.
In brief, USDCAD has reached an ideal area for a bullish reversal. However, only a rally above the exponential moving averages and beyond the 1.4100 mark would be sufficient to eliminate downside risks.
Note that Canada is heading to the polls on Monday April 28 to decide whether Prime Minister Mark Carney's Liberal Party will stay in power.
USD/CAD Consolidates
In the second half of April, the USD/CAD chart has shown a decline in volatility following significant spikes observed since February.
The Canadian dollar has stabilised against the US dollar within the 1.390–1.380 range over the past week, as market participants assess what a fair USD/CAD rate might be, given the evolving news backdrop:
→ The US dollar gained upward momentum on hopes of easing trade tensions between the US and China, although the information remains conflicting — Trump claims negotiations are ongoing, while Beijing denies this.
→ Oil prices — a key Canadian export — have recovered by more than 10% from their April lows, providing support for the Canadian dollar.
→ Economic data published this week suggests a cooling in the Canadian economy: employment is declining, and the pace of average wage growth has slowed to 5.4%.
→ Although an important political event — the Canadian Parliamentary elections — is set to take place this weekend, it appears to have had little impact on the USD/CAD exchange rate so far. Trade tariffs between the US and Canada likely remain the dominant concern.
Technical Analysis of the USD/CAD Chart
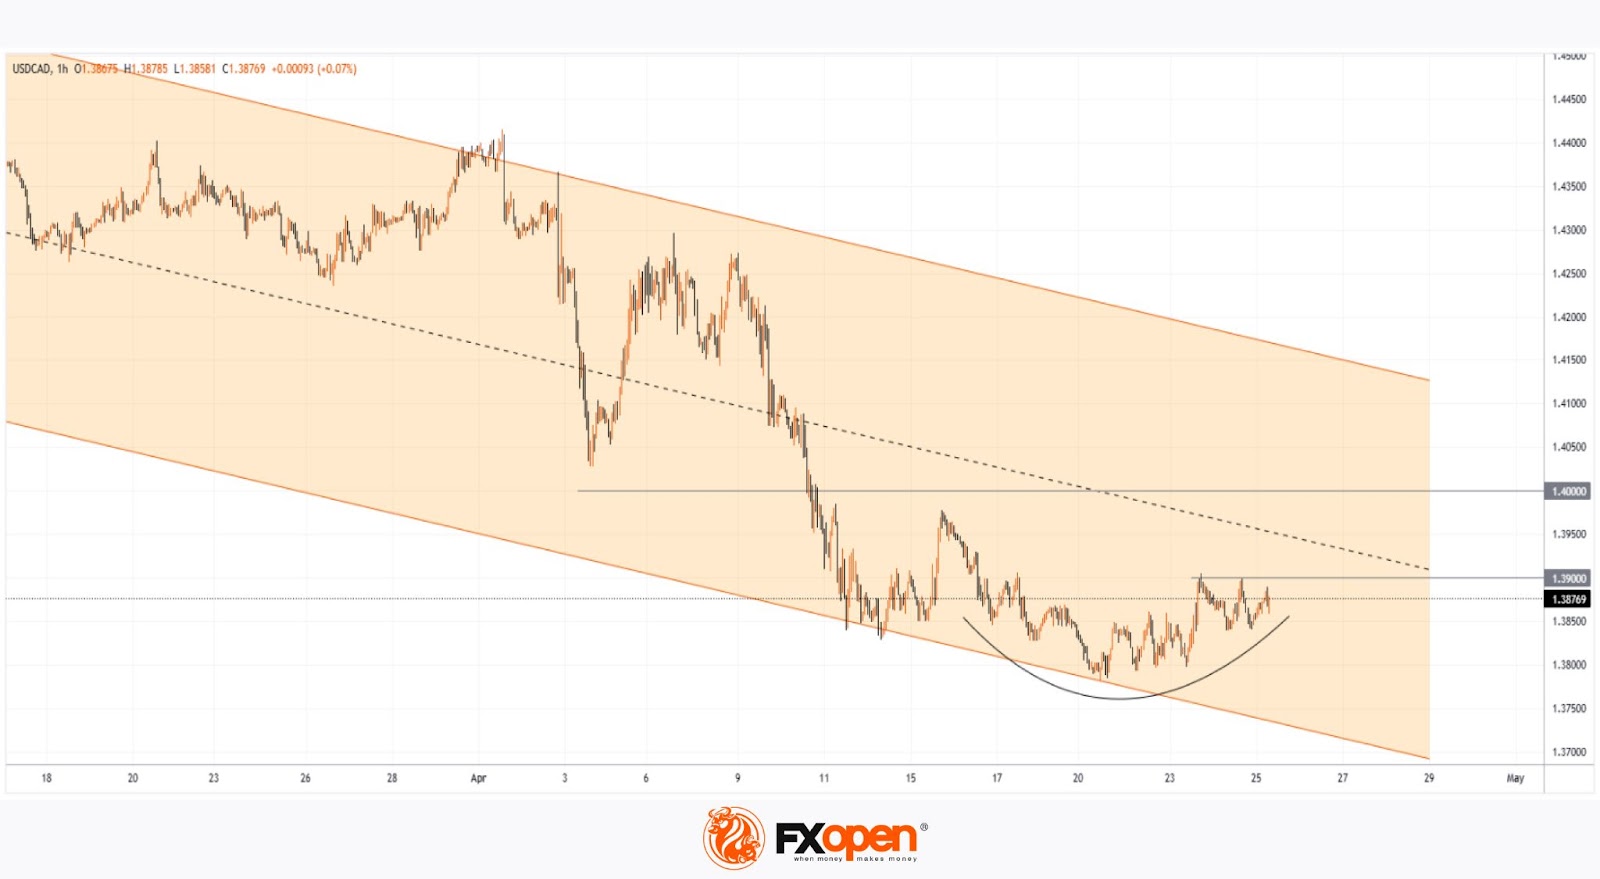
Price fluctuations have formed a descending channel that originated in March.
From a bearish perspective, resistance may be encountered at:
→ the median line of the channel;
→ the psychological level of 1.400.
From a bullish perspective:
→ the price has formed a rounding bottom pattern near the 1.380 level;
→ the lower boundary of the channel is acting as significant support.
It is possible that the weekend will bring key developments that could act as catalysts, breaking the established range between 1.390 and 1.380.
Trade over 50 forex markets 24 hours a day with FXOpen. Take advantage of low commissions, deep liquidity, and spreads from 0.0 pips. Open your FXOpen account now or learn more about trading forex with FXOpen.
This article represents the opinion of the Companies operating under the FXOpen brand only. It is not to be construed as an offer, solicitation, or recommendation with respect to products and services provided by the Companies operating under the FXOpen brand, nor is it to be considered financial advice.
EUR/USD Stuck in Consolidation: Rumours Abound, But Facts Remain Scarce
On Friday, the major currency pair became further entrenched within a local sideways channel, hovering around 1.1339. The US dollar retained gains accumulated over recent sessions, supported by US President Donald Trump’s confirmation that trade negotiations with China would continue.
Key factors driving EUR/USD movements
The dollar received additional support from signs of progress in trade discussions with Japan and South Korea.
Earlier in the week, US Treasury Secretary Scott Bessent emphasised that substantial US-China negotiations would require significant tariff reductions, highlighting the importance of reducing tensions between the world’s two largest economies.
Trump also softened his stance on Federal Reserve Chair Jerome Powell, saying he had no plans to replace him. This statement helped alleviate investor uncertainty regarding the Fed’s leadership.
Meanwhile, Cleveland Fed President Beth Hammack suggested that an interest rate cut could materialise as early as June, contingent on economic data. While this initially weighed on the dollar, the currency regained strength amid renewed trade optimism.
Technical analysis: EUR/USD
H4 chart
The EUR/USD pair has formed a consolidation range around 1.1358. We anticipate the downward wave to continue towards 1.1280, followed by a potential corrective rebound to 1.1427. A subsequent decline towards 1.1045 remains plausible. This scenario is technically supported by the MACD indicator, with its signal line firmly below zero and pointing downward.

H1 chart
On the hourly chart, the pair continues its downward trajectory towards 1.1280, with this level likely to be tested imminently. A corrective pullback towards 1.1427 may follow. The Stochastic oscillator corroborates this outlook, with its signal line currently below 20 and poised for an upward swing towards 80.

Conclusion
The EUR/USD remains confined within a consolidation phase, with trade developments and Fed policy expectations driving near-term volatility. Traders should monitor key support and resistance levels for confirmation of the next directional move.
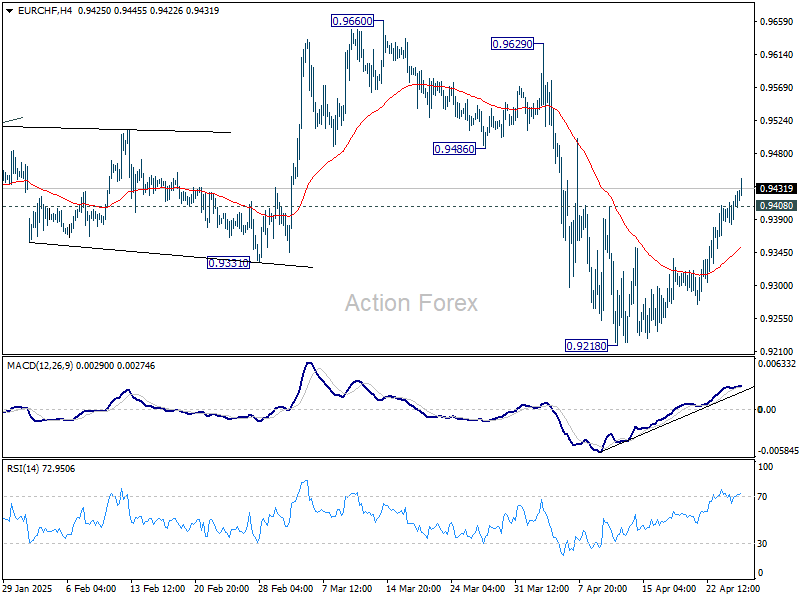
EUR/CHF Daily Outlook
Daily Pivots: (S1) 0.9393; (P) 0.9410; (R1) 0.9436; More....
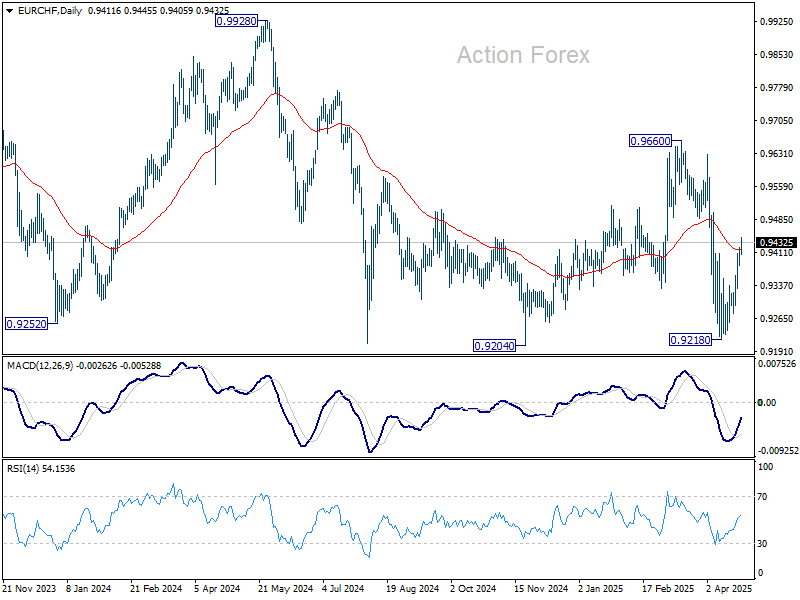
EUR/CHF's break of 0.9408 resistance argues that fall from 0.9660 has already completed at 0.9218. Intraday bias is back on the upside for stronger rebound back to 0.9660. But strong resistance could be seen there to limit upside. After all, larger down trend is expected to continue through 0.9204 low as long as 0.9960 holds.
In the bigger picture, rejection by long-term falling channel resistance (now at 0.9600) retains medium term bearishness. That is, down trend from 1.2004 (2018 high) is still in progress. Firm break of 0.9204 (2024 low) will confirm resumption.
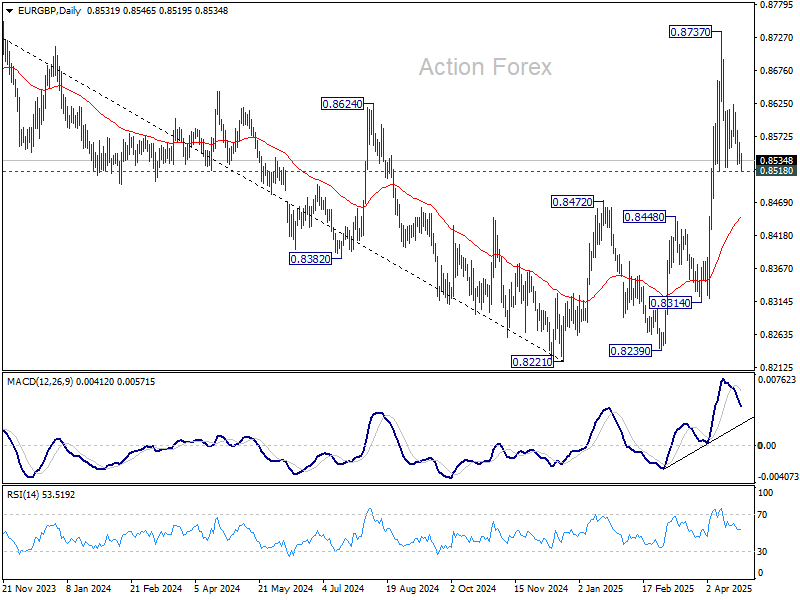
EUR/GBP Daily Outlook
Daily Pivots: (S1) 0.8525; (P) 0.8545; (R1) 0.8559; More...
Intraday bias in EUR/GBP remains neutral and consolidation from 0.8737 might extend. Still, further rise is expected as long as 0.8518 support holds. On the upside, 0.8622 minor resistance will bring retest of 0.8737 first. Firm break there will resume the larger rally from 0.8221. However, sustained break of 0.8518 will bring deeper fall back to 55 D EMA (now at 0.8447).
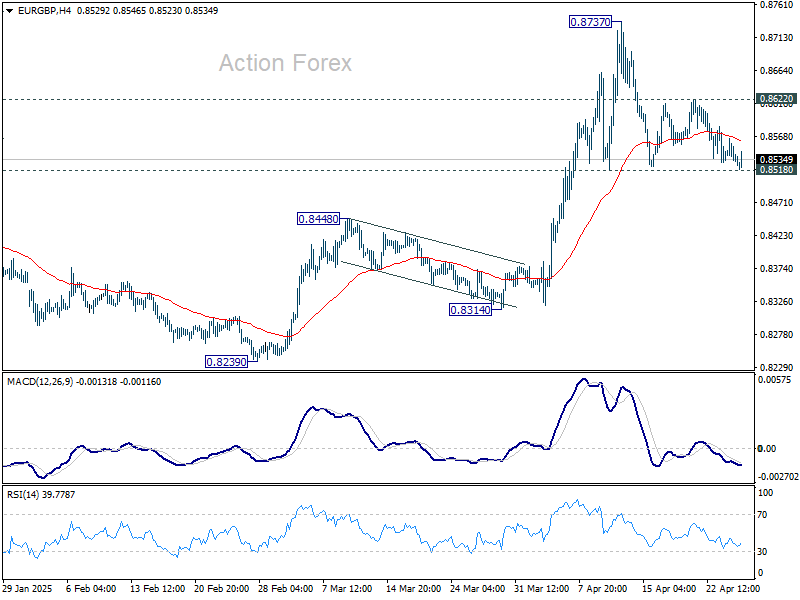
In the bigger picture, down trend from 0.9267 (2022 high) should have completed at 0.8221, just ahead of 0.9201 key support (2024 low). Rise from 0.8221 is likely reversing the whole fall. Further rise should be seen to 61.8% retracement of 0.9267 to 0.8221 at 0.8867 next. This will now remain the favored case as long as 0.8472 resistance turned support holds.
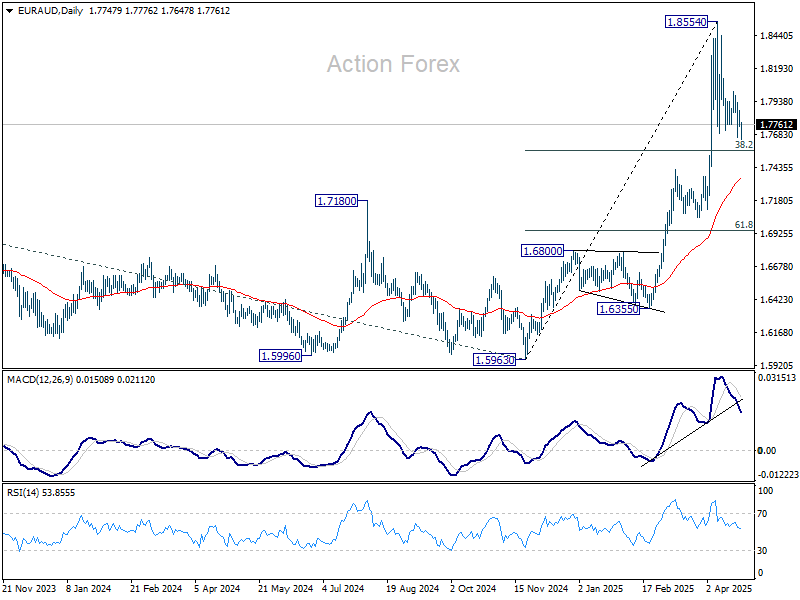
EUR/AUD Daily Outlook
Daily Pivots: (S1) 1.7723; (P) 1.7797; (R1) 1.7844; More...
Intraday bias in EUR/AUD remains neutral first, as consolidations from 1.8553 continues. Downside of pull back should be contained by 38.2% retracement of 1.5963 to 1.8854 at 1.7750. On the upside, above 1.8014 minor resistance will bring retest of 1.8554 first. Firm break there will resume larger up trend. However, firm break of 1.7750 will bring deeper fall to 55 D EMA (now at 1.7335).
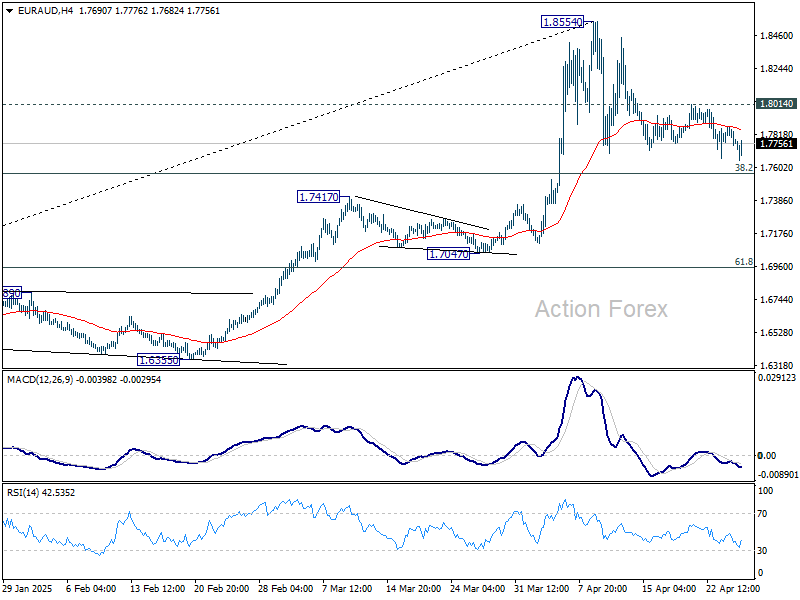
In the bigger picture, up trend from 1.4281 (2022 low) is in progress, and in reacceleration phase as seen in W MACD. Next target is 100% projection of 1.4281 to 1.7062 from 1.5963 at 1.8744. Firm break there will pave the way to 138.2% projection at 1.9806, which is close to 1.9799 (2020 high). Outlook will remain bullish as long as 1.7417 resistance turned support holds even in case of deep pullback.